The same plot in 14 other libraries — JavaScript: D3.js, Apache ECharts, Highcharts, MUI X Charts; Python: Altair, Bokeh, lets-plot, Matplotlib, Plotly, plotnine, Pygal, Seaborn; R: ggplot2; Julia: Makie.jl. Compare all 15 side by side: 100% Stacked Area Chart in Python, R, Julia and JavaScript.
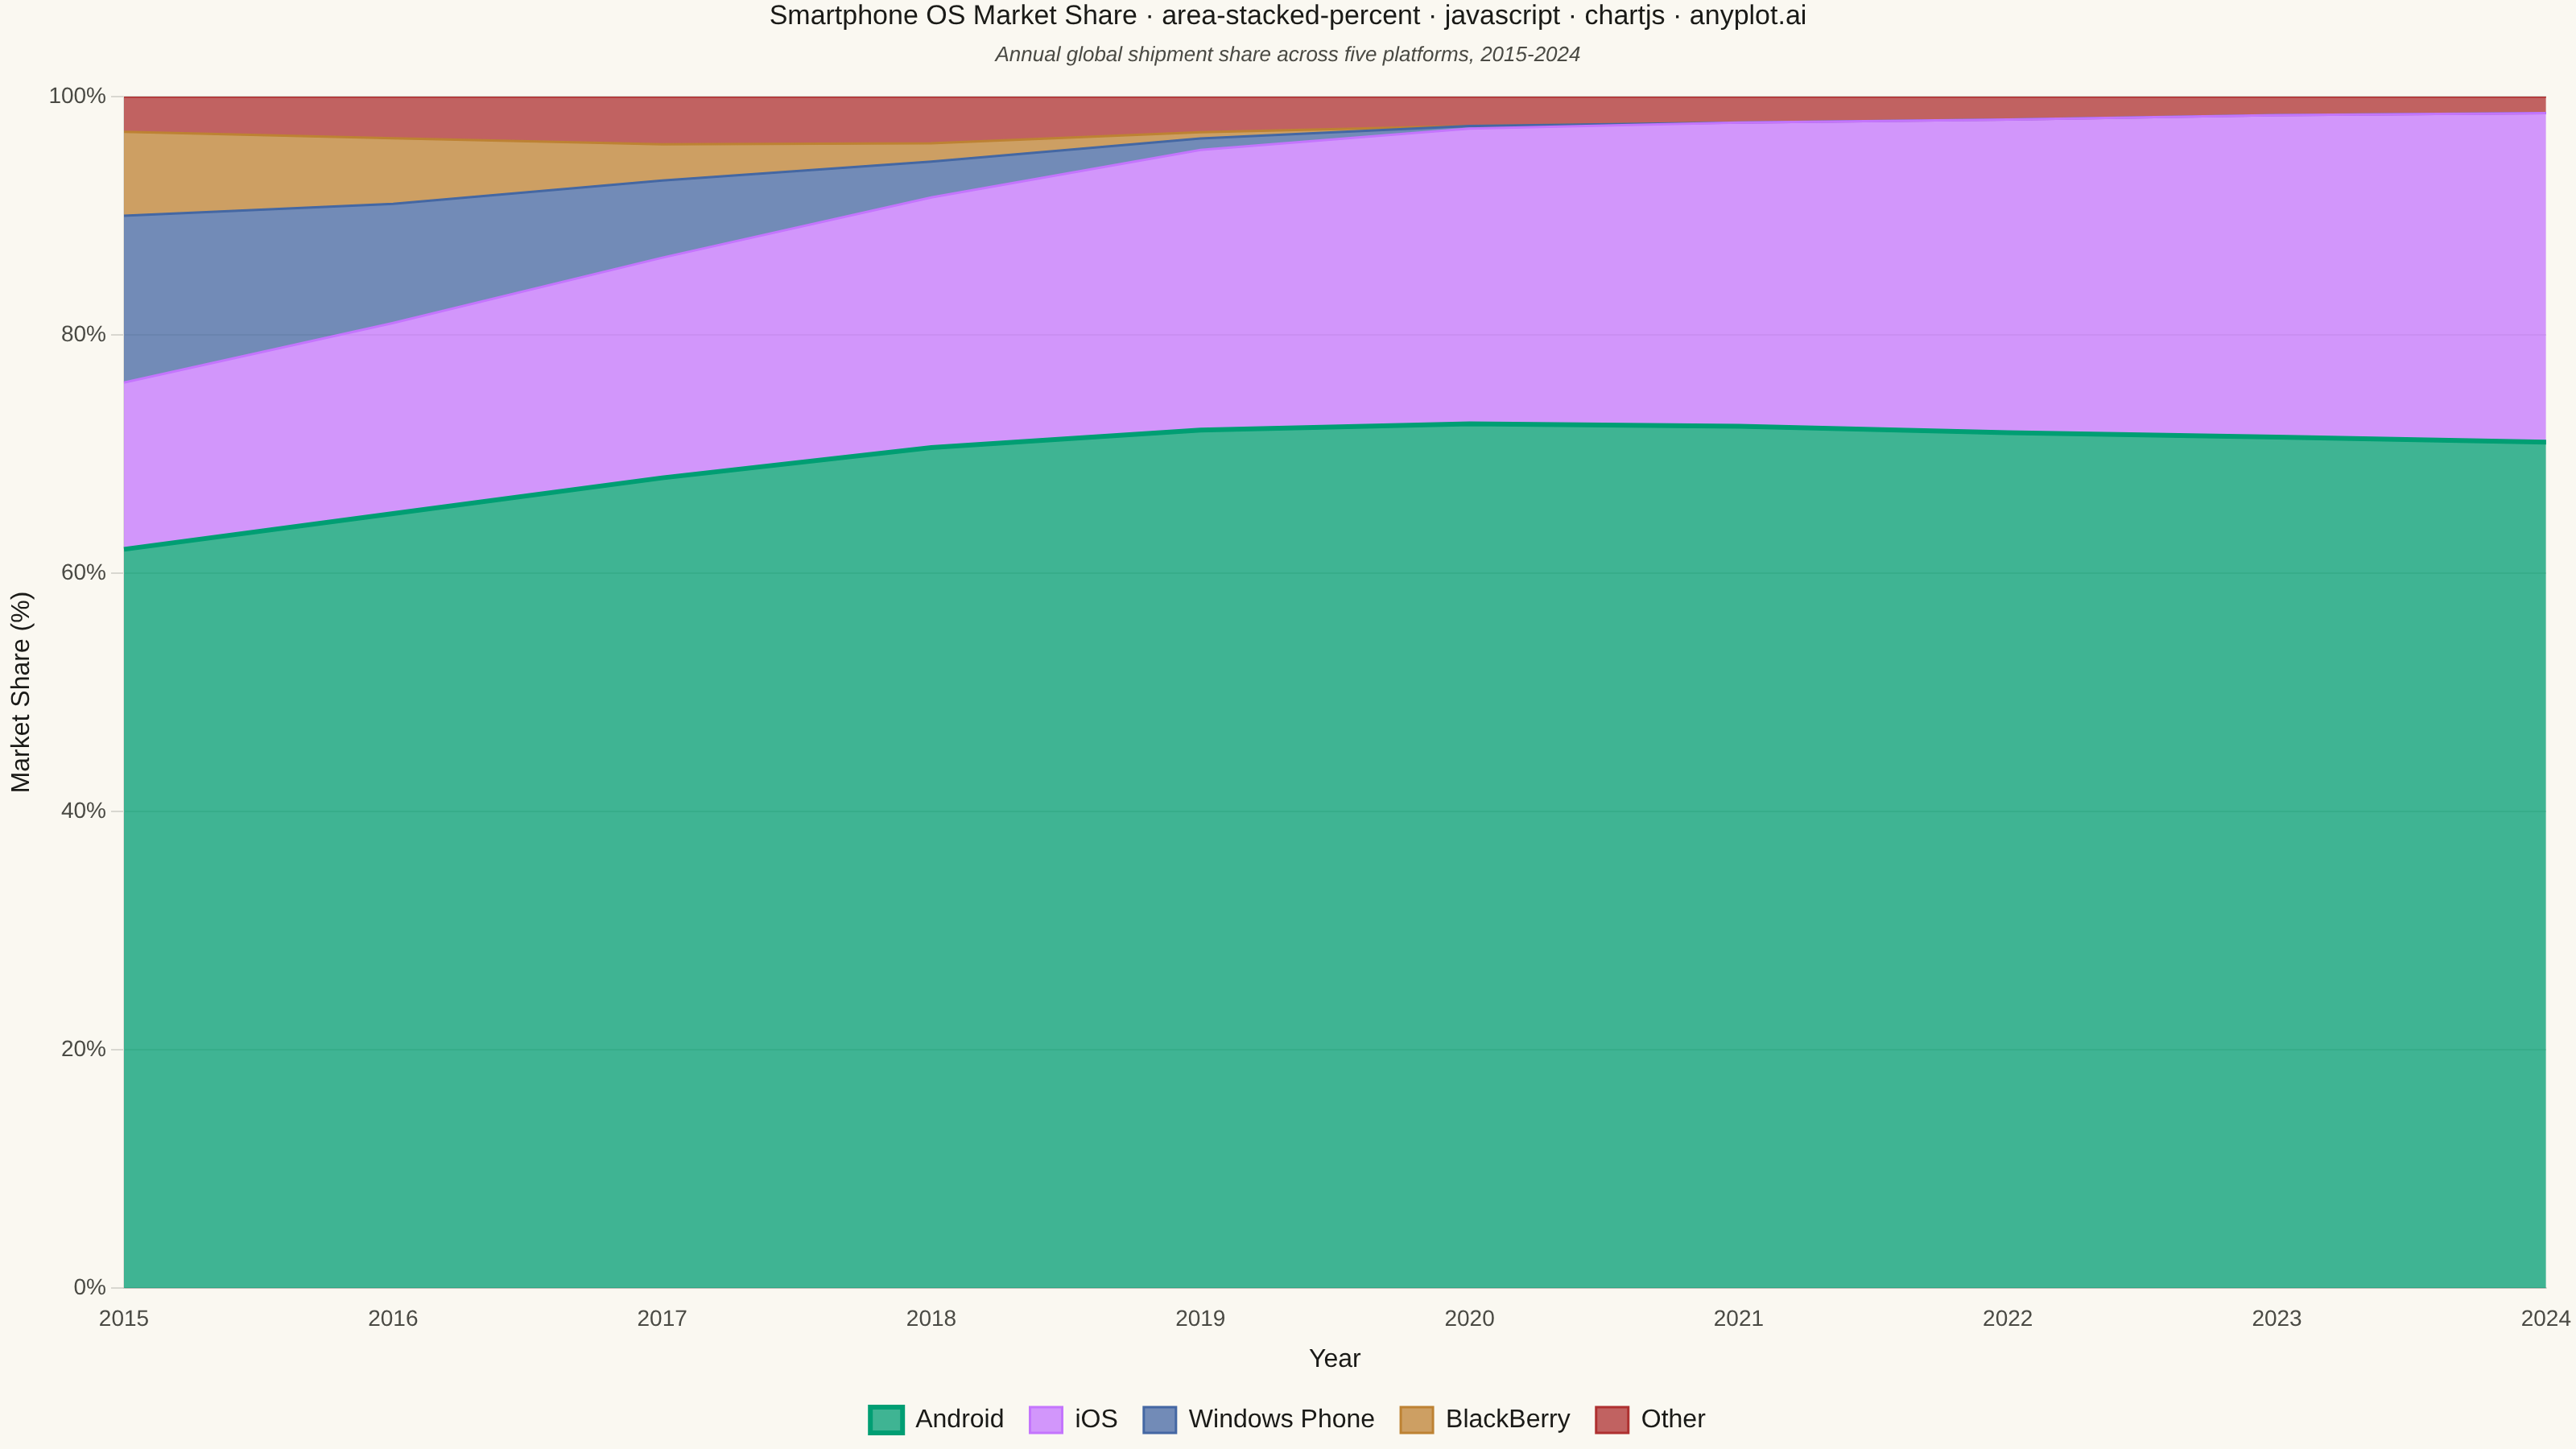
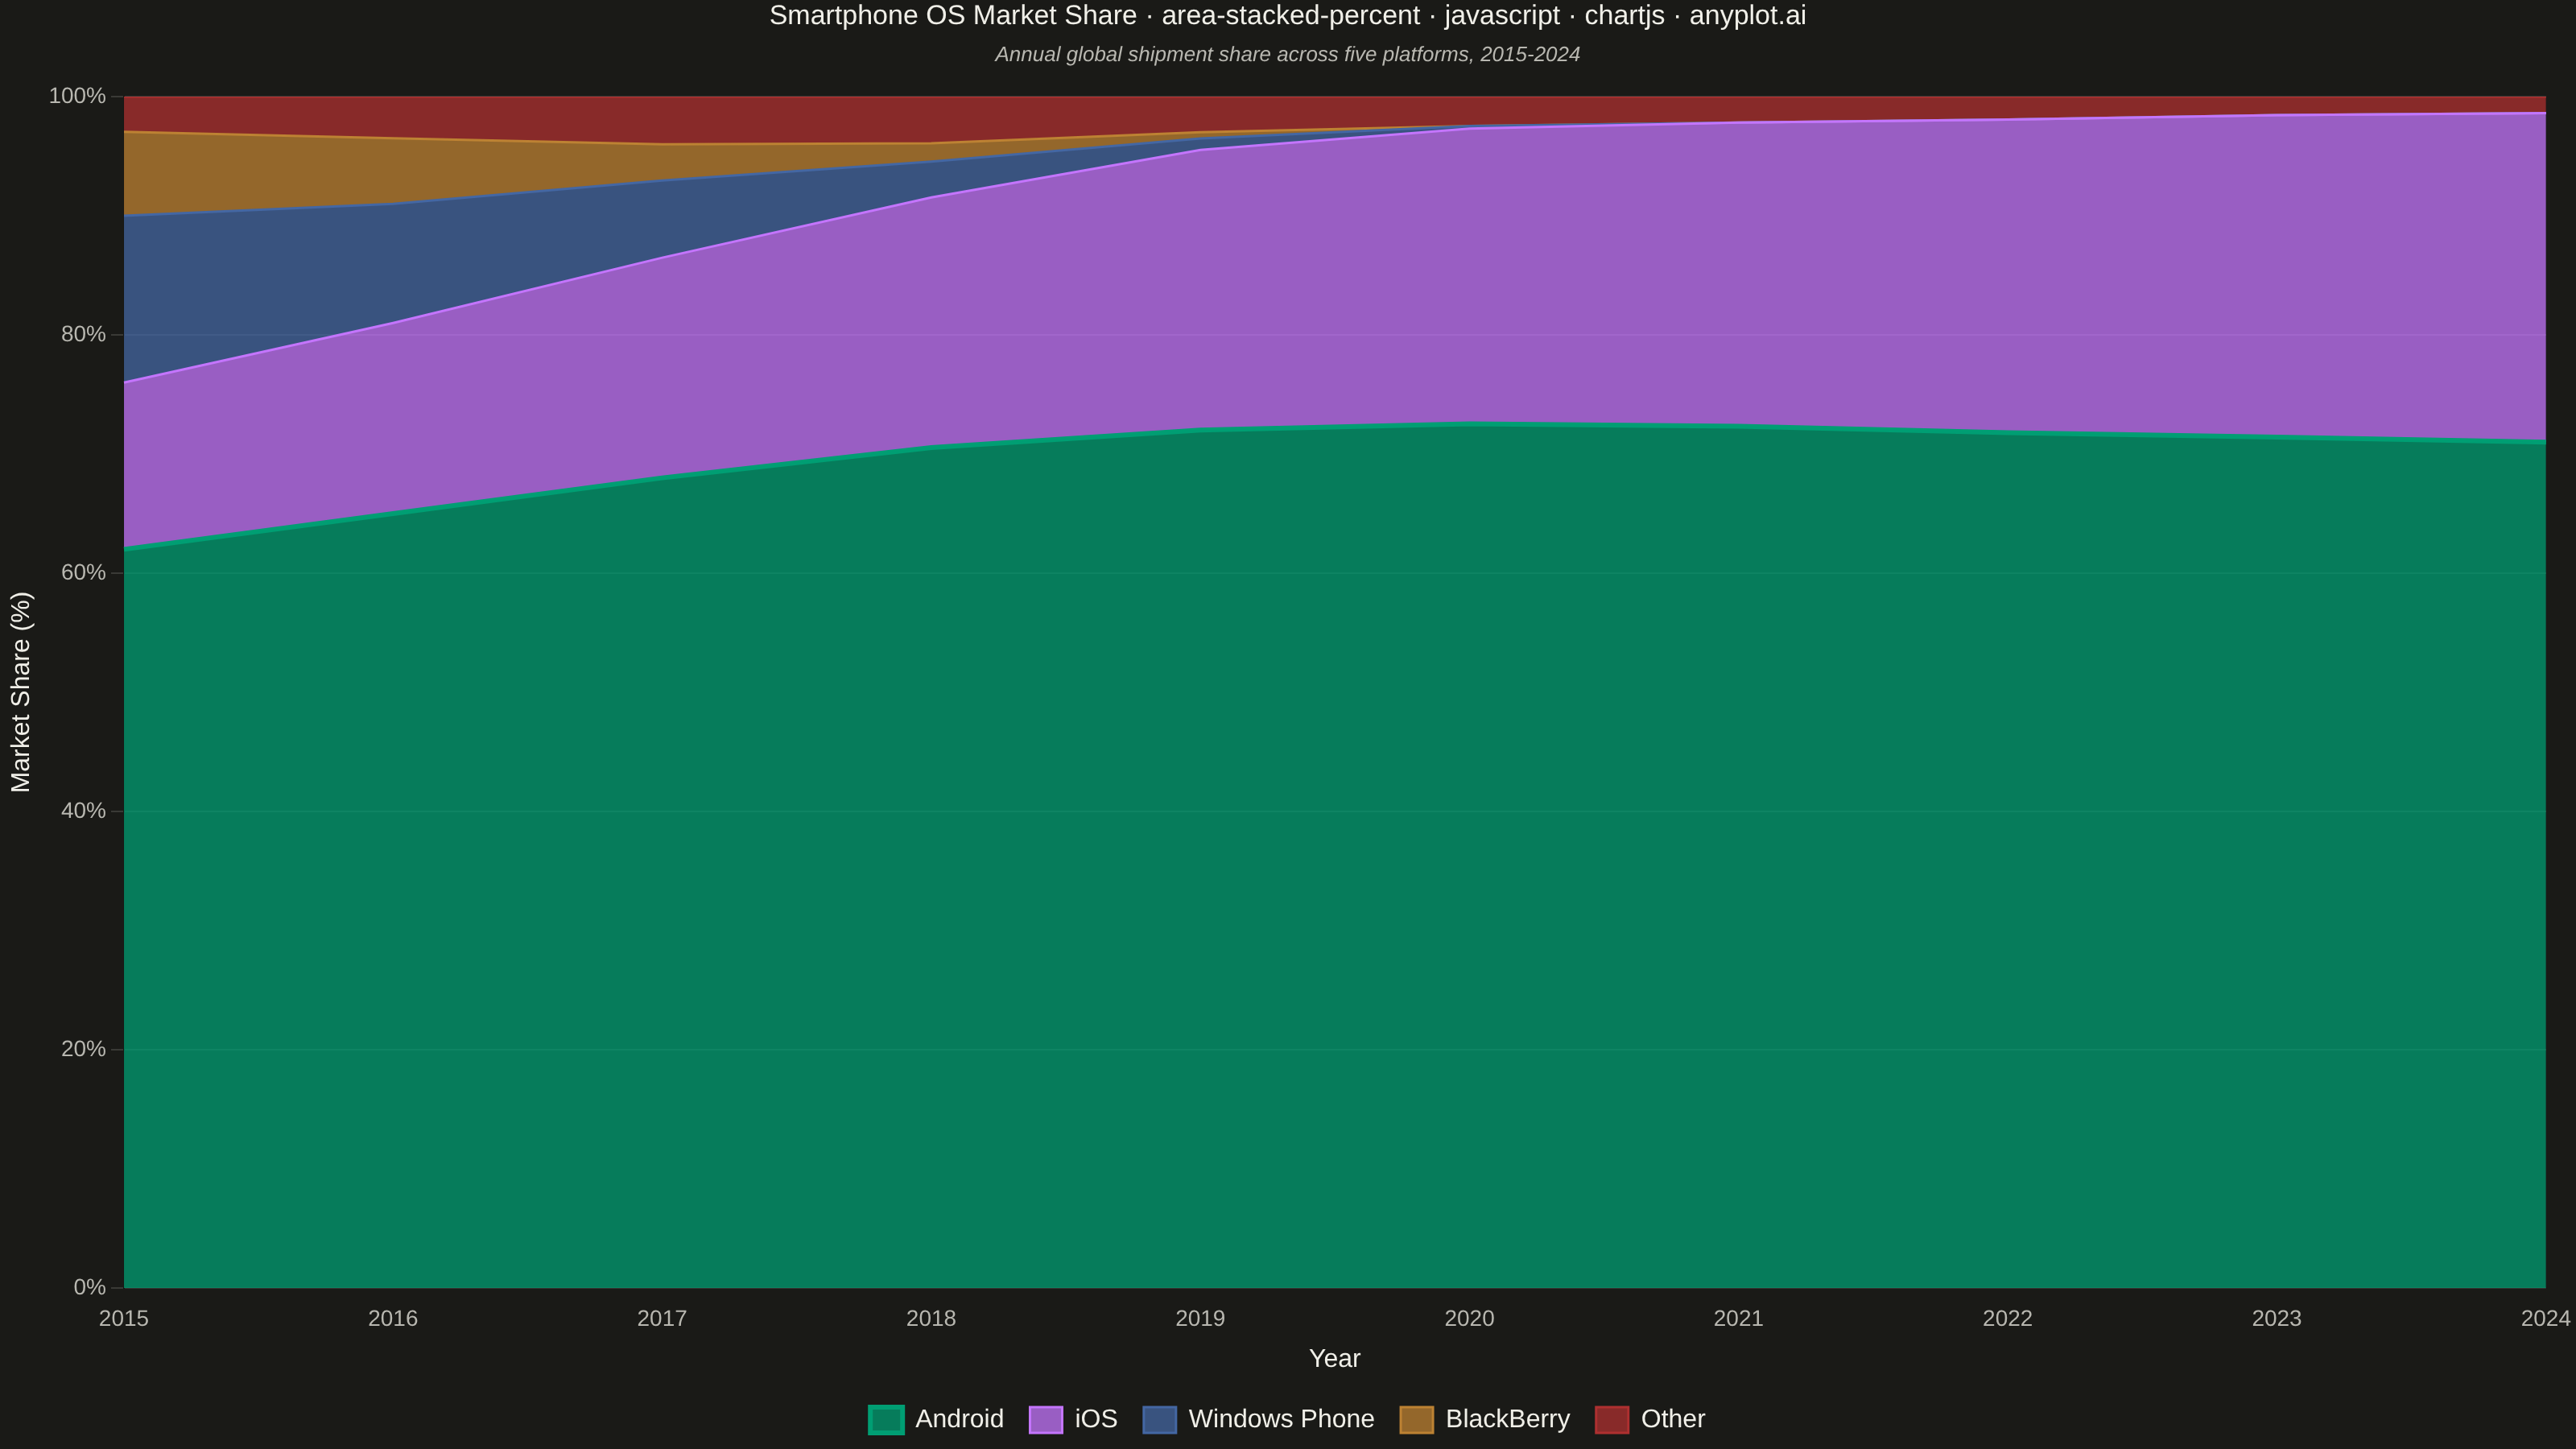
A stacked area chart normalized to 100%, where each area represents the percentage contribution of a category to the total. The combined height always equals 100%, showing proportional changes over time.
// anyplot.ai
// area-stacked-percent: 100% Stacked Area Chart
// Library: chartjs 4.4.7 | JavaScript 22.23.2
// Quality: 92/100 | Created: 2026-09-02

const t = window.ANYPLOT_TOKENS;

// --- Data (in-memory, deterministic) ----------------------------------------
// Smartphone OS market share, 2015-2024 — raw unit counts normalized to a
// percentage of the yearly total so every stack sums to exactly 100%.
const years = [2015, 2016, 2017, 2018, 2019, 2020, 2021, 2022, 2023, 2024];
const rawByCategory = {
  Android: [713, 780, 850, 917, 965, 1001, 1027, 1041, 1057, 1072],
  iOS: [161, 192, 231, 273, 315, 342, 362, 381, 400, 417],
  "Windows Phone": [161, 120, 81, 39, 13, 3, 0, 0, 0, 0],
  BlackBerry: [81, 66, 38, 20, 7, 0, 0, 0, 0, 0],
  Other: [34, 42, 50, 51, 40, 34, 31, 28, 23, 21],
};

const categories = Object.keys(rawByCategory);
const yearlyTotals = years.map((_, i) =>
  categories.reduce((sum, cat) => sum + rawByCategory[cat][i], 0),
);
const shareByCategory = {};
categories.forEach((cat) => {
  shareByCategory[cat] = rawByCategory[cat].map(
    (v, i) => (v / yearlyTotals[i]) * 100,
  );
});

const hexToRgba = (hex, alpha) => {
  const r = parseInt(hex.slice(1, 3), 16);
  const g = parseInt(hex.slice(3, 5), 16);
  const b = parseInt(hex.slice(5, 7), 16);
  return `rgba(${r}, ${g}, ${b}, ${alpha})`;
};

const datasets = categories.map((cat, i) => ({
  label: cat,
  data: shareByCategory[cat],
  backgroundColor: hexToRgba(t.palette[i % t.palette.length], 0.75),
  borderColor: t.palette[i % t.palette.length],
  // Dominant series (Android) gets a heavier stroke as the focal emphasis.
  borderWidth: i === 0 ? 3 : 1.5,
  pointRadius: 0,
  // Straight segments guarantee the 100%-stacked bands never overshoot
  // between the 10 sampled years (a spline could dip below 0 or over 100).
  tension: 0,
  fill: i === 0 ? "origin" : "-1",
}));

// --- Mount -------------------------------------------------------------------
const canvas = document.createElement("canvas");
document.getElementById("container").appendChild(canvas);

// --- Chart ---------------------------------------------------------------
const title =
  "Smartphone OS Market Share · area-stacked-percent · javascript · chartjs · anyplot.ai";

new Chart(canvas, {
  type: "line",
  data: { labels: years, datasets },
  options: {
    responsive: true,
    maintainAspectRatio: false,
    animation: false,
    interaction: { intersect: false, mode: "index" },
    plugins: {
      title: {
        display: true,
        text: title,
        color: t.ink,
        font: { size: 17, weight: "500" },
        padding: { bottom: 6 },
      },
      subtitle: {
        display: true,
        text: "Annual global shipment share across five platforms, 2015-2024",
        color: t.inkSoft,
        font: { size: 13, weight: "400", style: "italic" },
        padding: { bottom: 18 },
      },
      legend: {
        position: "bottom",
        labels: { color: t.ink, font: { size: 16 }, boxWidth: 20, padding: 16 },
      },
      filler: { propagate: false },
    },
    scales: {
      x: {
        title: { display: true, text: "Year", color: t.ink, font: { size: 16 } },
        ticks: { color: t.inkSoft, font: { size: 14 } },
        grid: { display: false },
      },
      y: {
        stacked: true,
        min: 0,
        max: 100,
        title: {
          display: true,
          text: "Market Share (%)",
          color: t.ink,
          font: { size: 16 },
        },
        ticks: {
          color: t.inkSoft,
          font: { size: 14 },
          stepSize: 20,
          callback: (value) => `${value}%`,
        },
        grid: { color: t.grid, borderDash: [3, 4] },
      },
    },
  },
});
Runnable source as JSON, for any HTTP client: https://api.anyplot.ai/specs/area-stacked-percent/chartjs/code. Any spec id and library id listed in llms-full.txt fit the same URL shape; every URL below is complete and callable.
{
  "spec_id": "area-stacked-percent",
  "language": "javascript",
  "library": "chartjs",
  "page": "https://anyplot.ai/area-stacked-percent/javascript/chartjs",
  "hub": "https://anyplot.ai/area-stacked-percent",
  "code_json": "https://api.anyplot.ai/specs/area-stacked-percent/chartjs/code",
  "spec_json": "https://api.anyplot.ai/specs/area-stacked-percent",
  "render_light_png": "https://storage.googleapis.com/anyplot-images/plots/area-stacked-percent/javascript/chartjs/plot-light.png",
  "render_dark_png": "https://storage.googleapis.com/anyplot-images/plots/area-stacked-percent/javascript/chartjs/plot-dark.png",
  "interactive_light_html": "https://storage.googleapis.com/anyplot-images/plots/area-stacked-percent/javascript/chartjs/plot-light.html",
  "interactive_dark_html": "https://storage.googleapis.com/anyplot-images/plots/area-stacked-percent/javascript/chartjs/plot-dark.html",
  "quality_score": 92.0,
  "license": "MIT",
  "guide": "https://anyplot.ai/llms.txt"
}
Part of 100% Stacked Area Chart on anyplot.ai.