The same plot in 14 other libraries — JavaScript: Chart.js, Apache ECharts, Highcharts, MUI X Charts; Python: Altair, Bokeh, lets-plot, Matplotlib, Plotly, plotnine, Pygal, Seaborn; R: ggplot2; Julia: Makie.jl. Compare all 15 side by side: 100% Stacked Area Chart in Python, R, Julia and JavaScript.
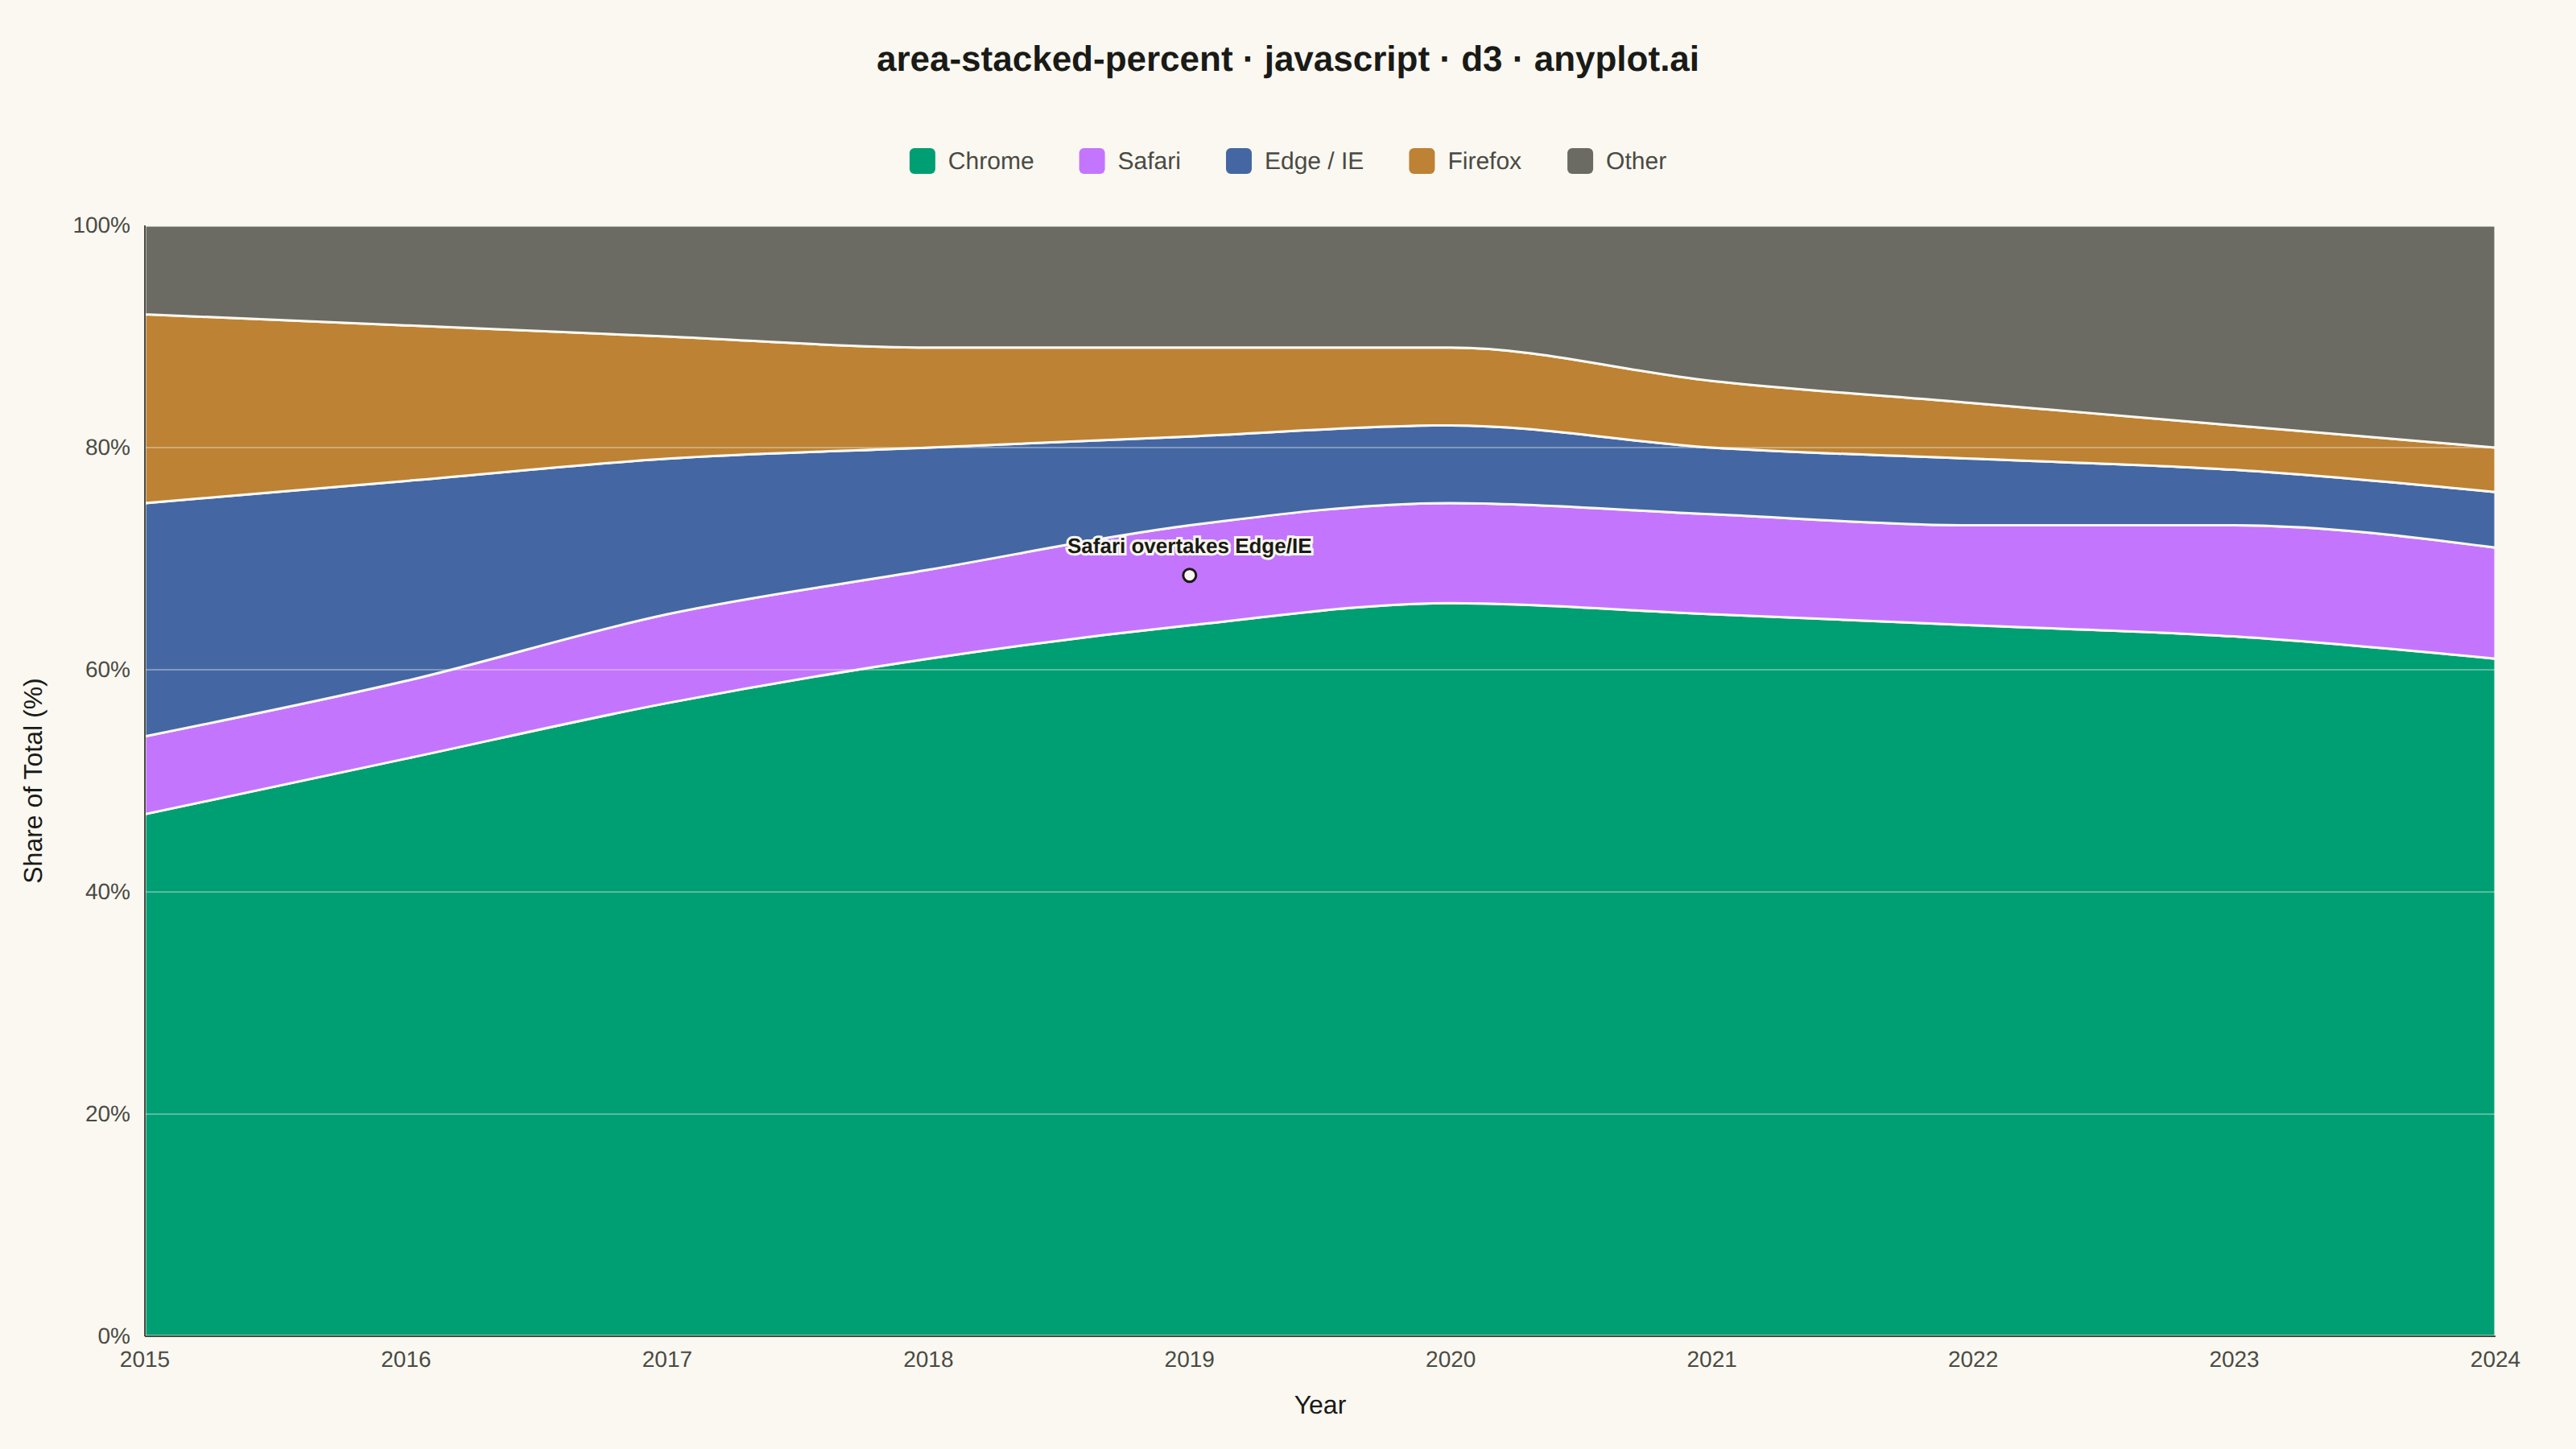
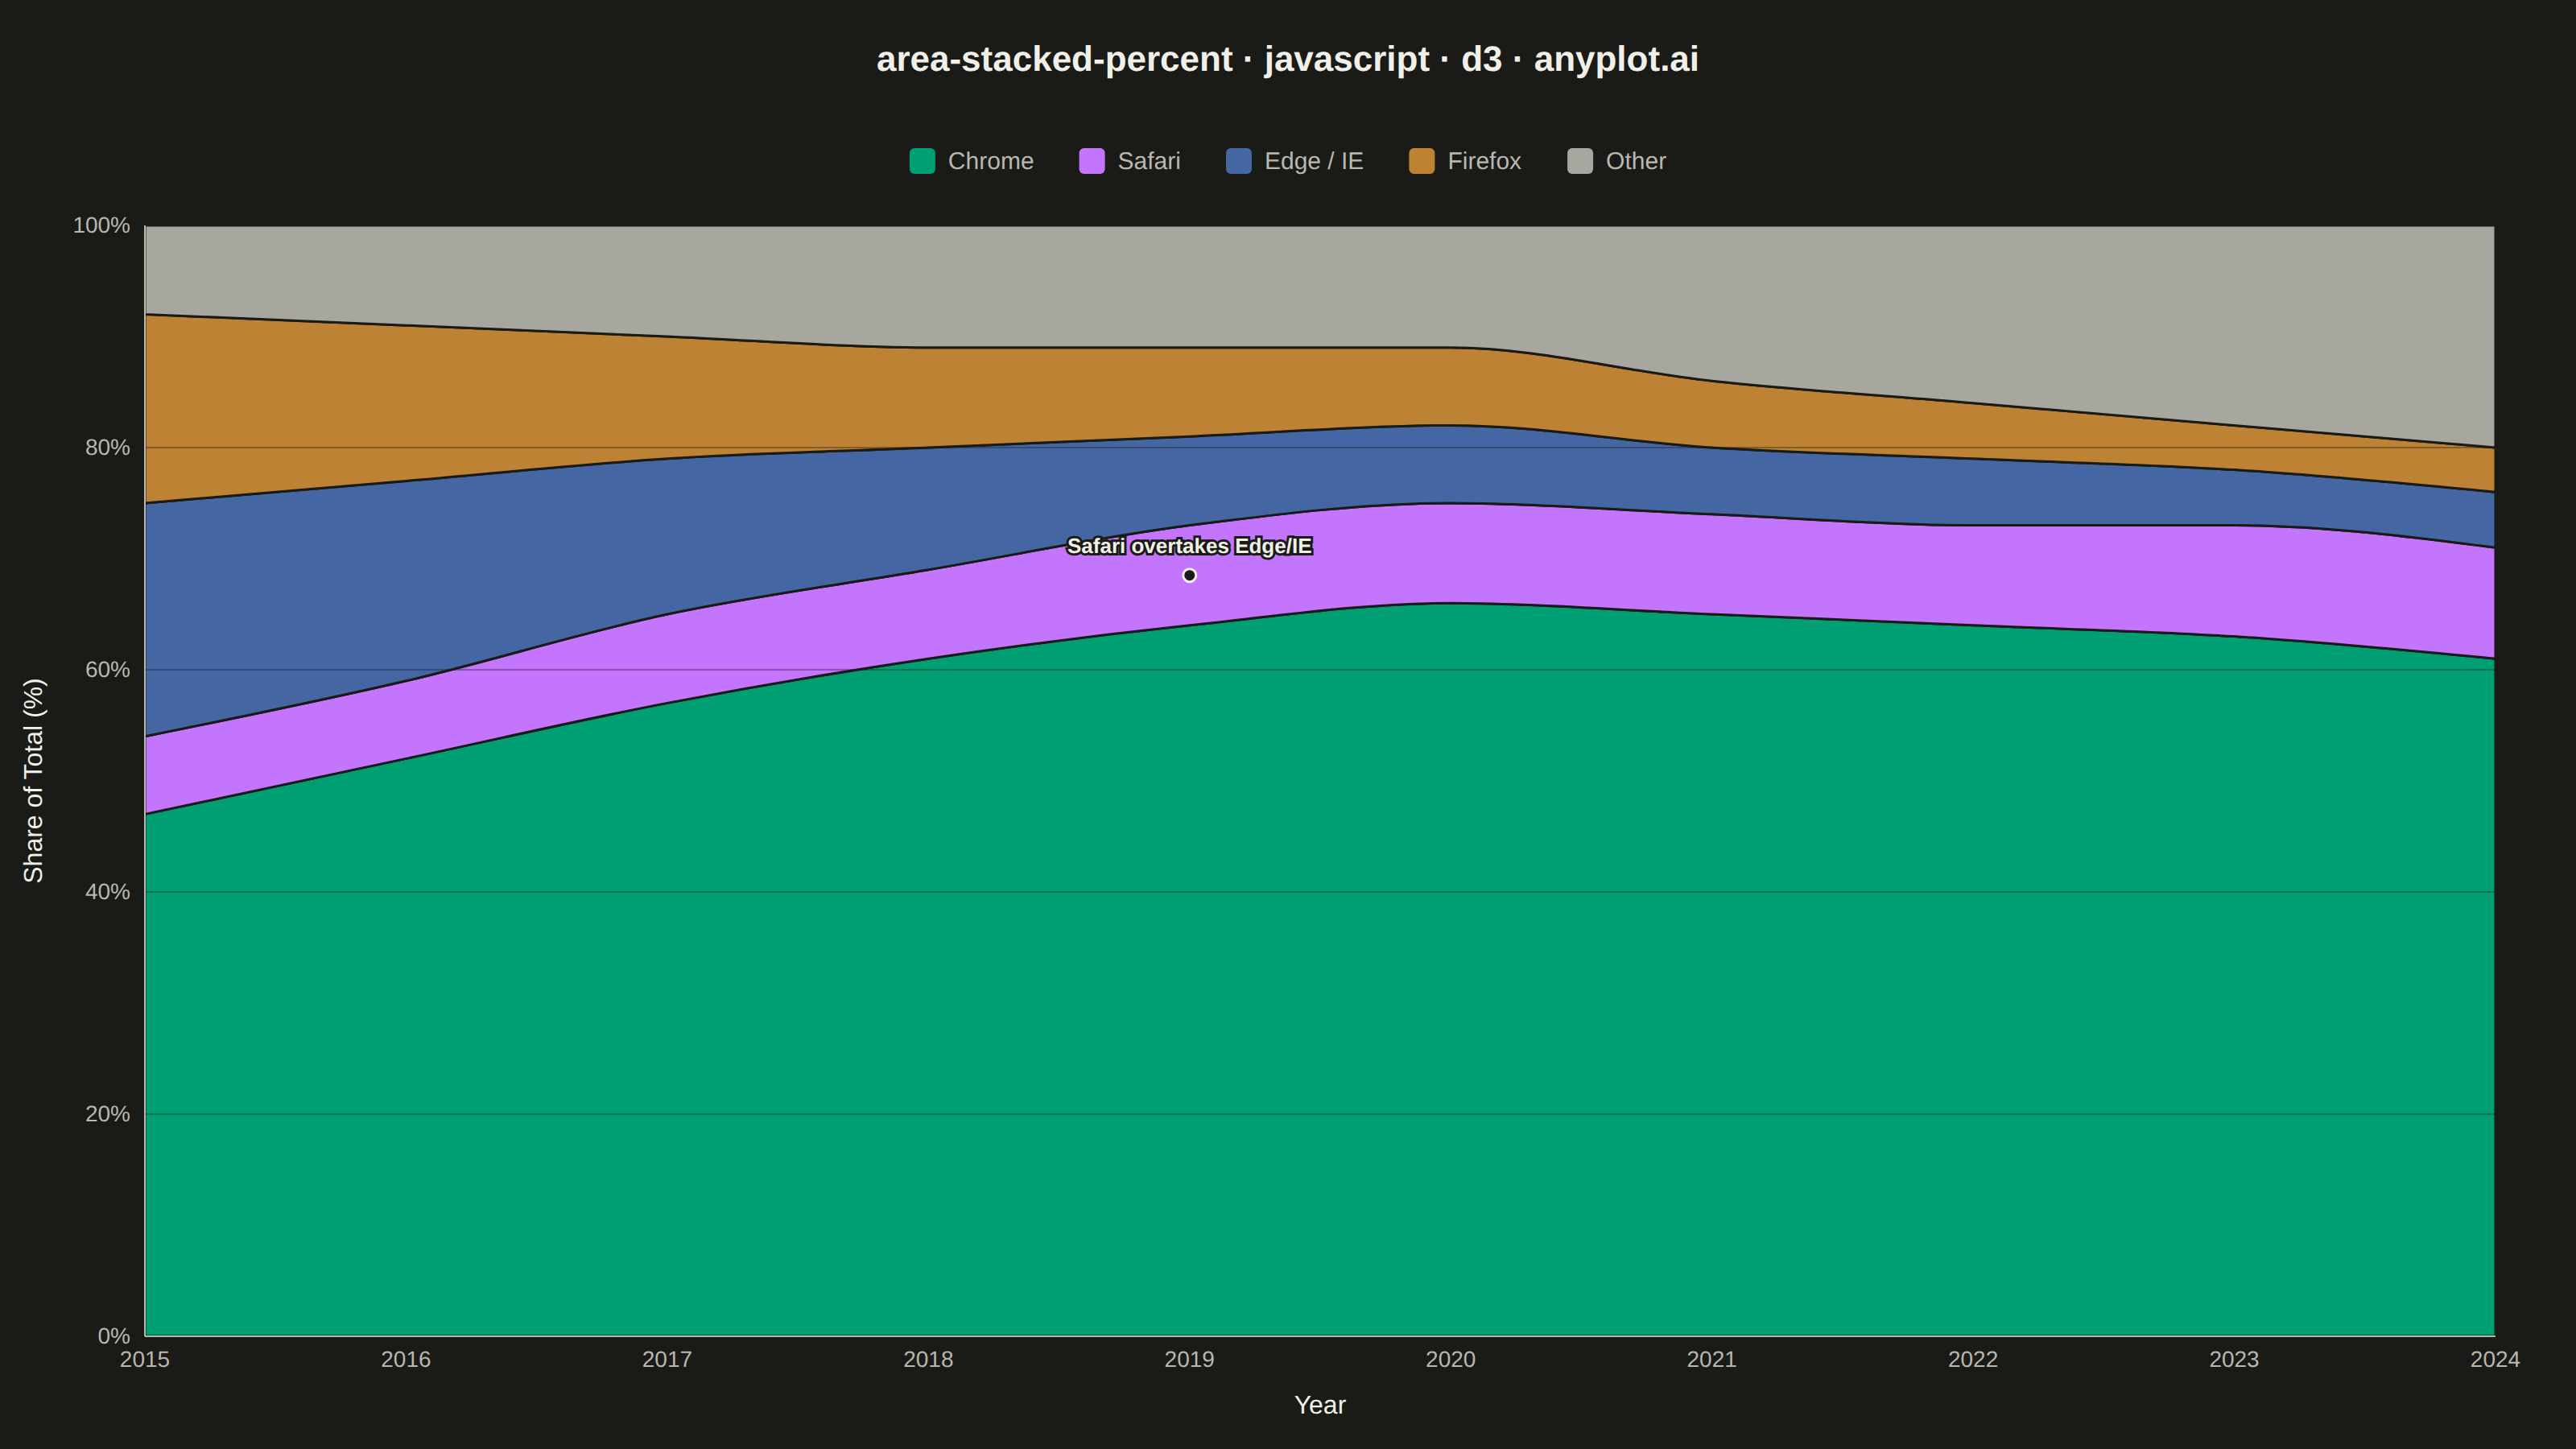
A stacked area chart normalized to 100%, where each area represents the percentage contribution of a category to the total. The combined height always equals 100%, showing proportional changes over time.
// anyplot.ai
// area-stacked-percent: 100% Stacked Area Chart
// Library: d3 7.9.0 | JavaScript 22.23.2
// Quality: 93/100 | Created: 2026-09-02

const t = window.ANYPLOT_TOKENS;
const inkMuted = t.theme === "light" ? "#6B6A63" : "#A8A79F";
const { width, height } = window.ANYPLOT_SIZE;
const margin = { top: 140, right: 50, bottom: 70, left: 90 };
const iw = width - margin.left - margin.right;
const ih = height - margin.top - margin.bottom;

// --- Data (in-memory, deterministic) ----------------------------------------
// Illustrative global desktop browser market share, 2015-2024 (yearly).
const SERIES = [
  { key: "chrome", label: "Chrome" },
  { key: "safari", label: "Safari" },
  { key: "edge", label: "Edge / IE" },
  { key: "firefox", label: "Firefox" },
  { key: "other", label: "Other" },
];

const data = [
  { year: 2015, chrome: 47, safari: 7, edge: 21, firefox: 17, other: 8 },
  { year: 2016, chrome: 52, safari: 7, edge: 18, firefox: 14, other: 9 },
  { year: 2017, chrome: 57, safari: 8, edge: 14, firefox: 11, other: 10 },
  { year: 2018, chrome: 61, safari: 8, edge: 11, firefox: 9, other: 11 },
  { year: 2019, chrome: 64, safari: 9, edge: 8, firefox: 8, other: 11 },
  { year: 2020, chrome: 66, safari: 9, edge: 7, firefox: 7, other: 11 },
  { year: 2021, chrome: 65, safari: 9, edge: 6, firefox: 6, other: 14 },
  { year: 2022, chrome: 64, safari: 9, edge: 6, firefox: 5, other: 16 },
  { year: 2023, chrome: 63, safari: 10, edge: 5, firefox: 4, other: 18 },
  { year: 2024, chrome: 61, safari: 10, edge: 5, firefox: 4, other: 20 },
];

const years = data.map((d) => d.year);

// "Other" reads as the semantic muted anchor; the named series keep canonical order.
const colorFor = (key) => {
  if (key === "other") return inkMuted;
  const index = SERIES.findIndex((s) => s.key === key);
  return t.palette[index];
};

// --- SVG mount ---------------------------------------------------------------
const svg = d3.select("#container").append("svg").attr("width", width).attr("height", height);
const g = svg.append("g").attr("transform", `translate(${margin.left},${margin.top})`);

// --- Scales --------------------------------------------------------------
const x = d3.scaleLinear().domain(d3.extent(years)).range([0, iw]);
const y = d3.scaleLinear().domain([0, 1]).range([ih, 0]);

// --- Stack (normalized to 100%) -----------------------------------------
const stack = d3.stack().keys(SERIES.map((s) => s.key)).offset(d3.stackOffsetExpand);
const layers = stack(data);

// --- Areas -----------------------------------------------------------------
const area = d3
  .area()
  .x((d) => x(d.data.year))
  .y0((d) => y(d[0]))
  .y1((d) => y(d[1]))
  .curve(d3.curveMonotoneX);

g.selectAll("path.layer")
  .data(layers)
  .join("path")
  .attr("class", "layer")
  .attr("fill", (d) => colorFor(d.key))
  .attr("stroke", t.pageBg)
  .attr("stroke-width", 1.5)
  .attr("d", area);

// --- Gridlines (y-axis only, drawn above the opaque stack at low opacity) --
g.append("g")
  .selectAll("line")
  .data(y.ticks(4))
  .join("line")
  .attr("x1", 0)
  .attr("x2", iw)
  .attr("y1", (d) => y(d))
  .attr("y2", (d) => y(d))
  .attr("stroke", t.pageBg)
  .attr("stroke-width", 1)
  .attr("opacity", 0.35);

// --- Crossover annotation (Safari overtakes Edge/IE) -----------------------
const crossoverYear = 2019;
const crossoverRow = data.find((d) => d.year === crossoverYear);
const crossoverLayer = layers.find((l) => l.key === "safari");
const crossoverIndex = data.indexOf(crossoverRow);
const crossoverY = y((crossoverLayer[crossoverIndex][0] + crossoverLayer[crossoverIndex][1]) / 2);

g.append("circle")
  .attr("cx", x(crossoverYear))
  .attr("cy", crossoverY)
  .attr("r", 4)
  .attr("fill", t.pageBg)
  .attr("stroke", t.ink)
  .attr("stroke-width", 1.5);

for (const [stroke, fill] of [
  [t.pageBg, "none"],
  ["none", t.ink],
]) {
  g.append("text")
    .attr("x", x(crossoverYear))
    .attr("y", crossoverY - 14)
    .attr("text-anchor", "middle")
    .attr("stroke", stroke)
    .attr("stroke-width", 3)
    .attr("fill", fill)
    .style("font-size", "13px")
    .style("font-weight", "600")
    .text("Safari overtakes Edge/IE");
}

// --- Axes --------------------------------------------------------------
const xAxis = g
  .append("g")
  .attr("transform", `translate(0,${ih})`)
  .call(d3.axisBottom(x).tickValues(years).tickFormat(d3.format("d")).tickSizeOuter(0));

const yAxis = g.append("g").call(d3.axisLeft(y).ticks(4).tickFormat(d3.format(".0%")).tickSizeOuter(0));

for (const ax of [xAxis, yAxis]) {
  ax.selectAll("text").attr("fill", t.inkSoft).style("font-size", "14px");
  ax.selectAll("line").attr("stroke", t.inkSoft);
  ax.select(".domain").attr("stroke", t.inkSoft);
}
xAxis.selectAll("line").remove();
yAxis.selectAll("line").remove();

g.append("text")
  .attr("transform", "rotate(-90)")
  .attr("x", -ih / 2)
  .attr("y", -64)
  .attr("text-anchor", "middle")
  .attr("fill", t.ink)
  .style("font-size", "16px")
  .text("Share of Total (%)");

g.append("text")
  .attr("x", iw / 2)
  .attr("y", ih + 48)
  .attr("text-anchor", "middle")
  .attr("fill", t.ink)
  .style("font-size", "16px")
  .text("Year");

// --- Legend (measured in-browser, then centered) ----------------------------
const legendG = svg.append("g");
const swatch = 16;
const swatchGap = 8;
const itemGap = 28;
let cursorX = 0;
const items = [];

for (const s of SERIES) {
  const item = legendG.append("g");
  item
    .append("rect")
    .attr("width", swatch)
    .attr("height", swatch)
    .attr("rx", 3)
    .attr("fill", colorFor(s.key));
  const label = item
    .append("text")
    .attr("x", swatch + swatchGap)
    .attr("y", swatch - 3)
    .attr("fill", t.inkSoft)
    .style("font-size", "15px")
    .text(s.label);
  const itemWidth = swatch + swatchGap + label.node().getBBox().width;
  items.push({ item, x: cursorX });
  cursorX += itemWidth + itemGap;
}

const legendWidth = cursorX - itemGap;
const legendStartX = (width - legendWidth) / 2;
for (const { item, x: itemX } of items) {
  item.attr("transform", `translate(${legendStartX + itemX},${92})`);
}

// --- Title -------------------------------------------------------------
svg
  .append("text")
  .attr("x", width / 2)
  .attr("y", 44)
  .attr("text-anchor", "middle")
  .attr("fill", t.ink)
  .style("font-size", "22px")
  .style("font-weight", "600")
  .text("area-stacked-percent · javascript · d3 · anyplot.ai");
Runnable source as JSON, for any HTTP client: https://api.anyplot.ai/specs/area-stacked-percent/d3/code. Any spec id and library id listed in llms-full.txt fit the same URL shape; every URL below is complete and callable.
{
  "spec_id": "area-stacked-percent",
  "language": "javascript",
  "library": "d3",
  "page": "https://anyplot.ai/area-stacked-percent/javascript/d3",
  "hub": "https://anyplot.ai/area-stacked-percent",
  "code_json": "https://api.anyplot.ai/specs/area-stacked-percent/d3/code",
  "spec_json": "https://api.anyplot.ai/specs/area-stacked-percent",
  "render_light_png": "https://storage.googleapis.com/anyplot-images/plots/area-stacked-percent/javascript/d3/plot-light.png",
  "render_dark_png": "https://storage.googleapis.com/anyplot-images/plots/area-stacked-percent/javascript/d3/plot-dark.png",
  "interactive_light_html": "https://storage.googleapis.com/anyplot-images/plots/area-stacked-percent/javascript/d3/plot-light.html",
  "interactive_dark_html": "https://storage.googleapis.com/anyplot-images/plots/area-stacked-percent/javascript/d3/plot-dark.html",
  "quality_score": 93.0,
  "license": "MIT",
  "guide": "https://anyplot.ai/llms.txt"
}
Part of 100% Stacked Area Chart on anyplot.ai.