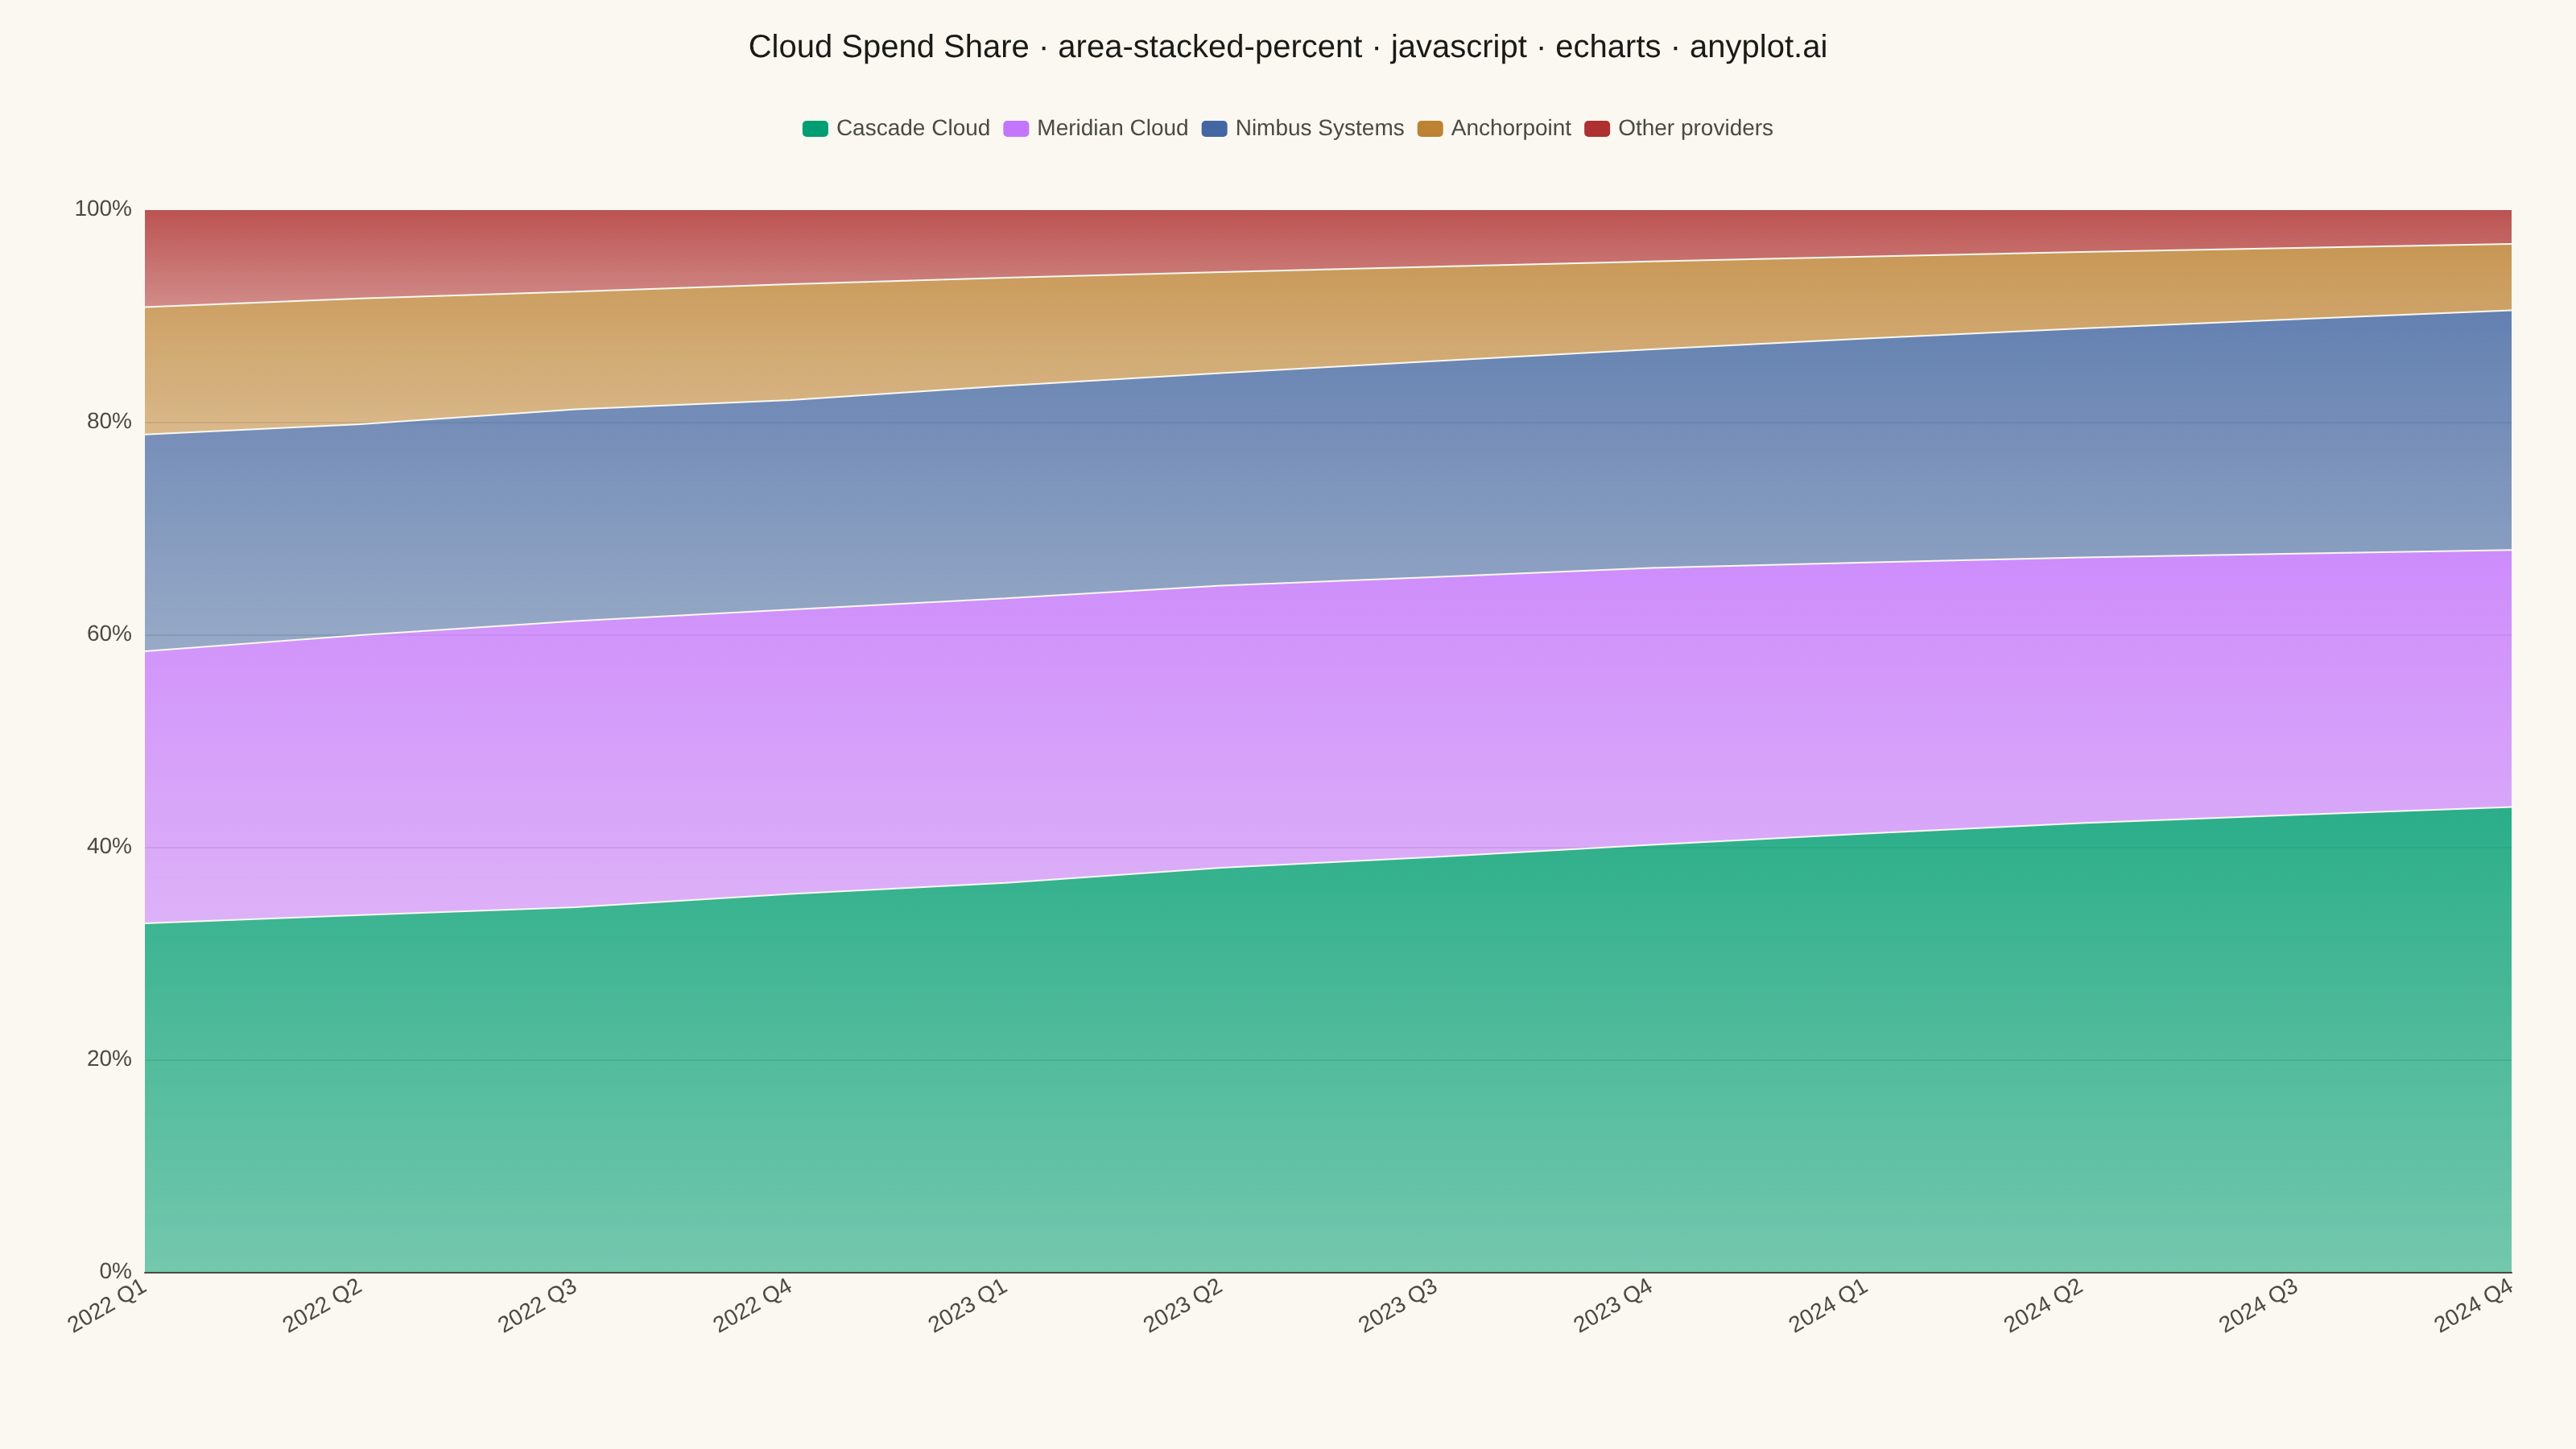
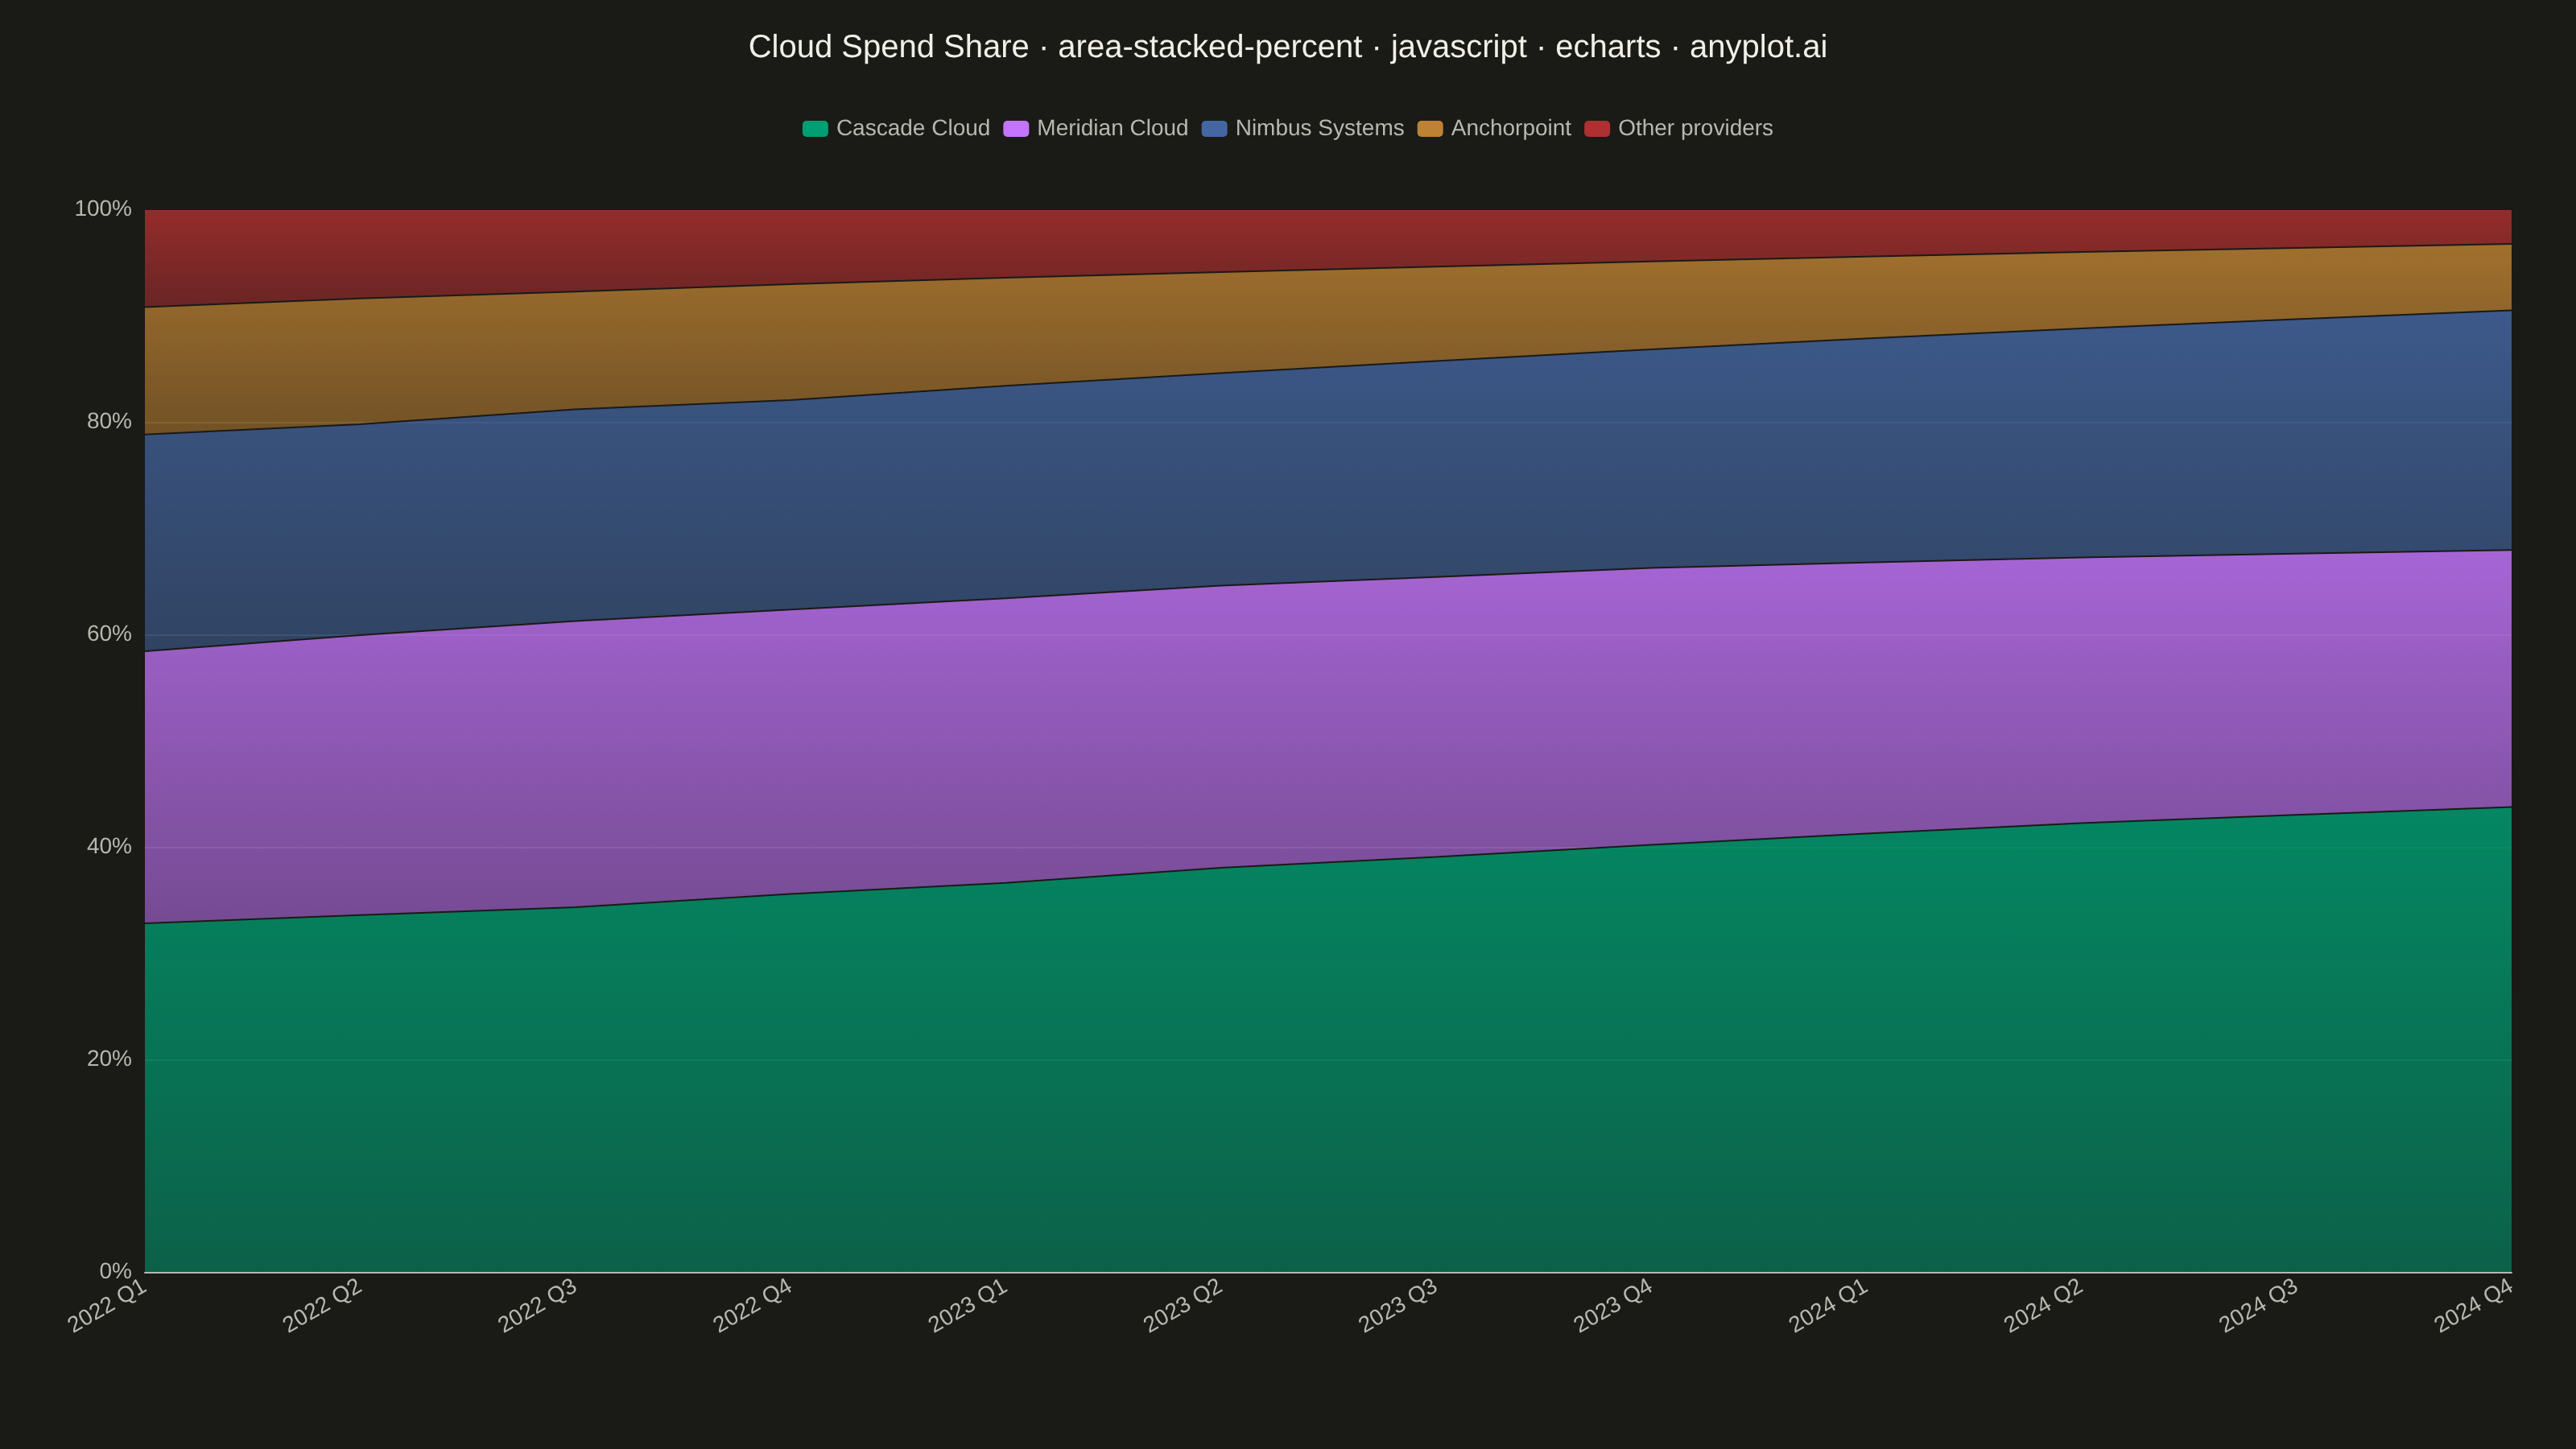
The same plot in 14 other libraries — JavaScript: Chart.js, D3.js, Highcharts, MUI X Charts; Python: Altair, Bokeh, lets-plot, Matplotlib, Plotly, plotnine, Pygal, Seaborn; R: ggplot2; Julia: Makie.jl. Compare all 15 side by side: 100% Stacked Area Chart in Python, R, Julia and JavaScript.
A stacked area chart normalized to 100%, where each area represents the percentage contribution of a category to the total. The combined height always equals 100%, showing proportional changes over time.
// anyplot.ai
// area-stacked-percent: 100% Stacked Area Chart
// Library: echarts 6.1.0 | JavaScript 22.23.2
// Quality: 91/100 | Created: 2026-09-02

const t = window.ANYPLOT_TOKENS;

// --- Data (in-memory, deterministic) ----------------------------------------
// Cloud infrastructure market share by provider, quarterly, in $M spend.
const quarters = [
  "2022 Q1", "2022 Q2", "2022 Q3", "2022 Q4",
  "2023 Q1", "2023 Q2", "2023 Q3", "2023 Q4",
  "2024 Q1", "2024 Q2", "2024 Q3", "2024 Q4",
];
const rawSpend = {
  "Cascade Cloud": [820, 880, 930, 1010, 1080, 1160, 1230, 1310, 1390, 1470, 1540, 1610],
  "Meridian Cloud": [640, 690, 730, 760, 790, 810, 830, 850, 860, 870, 880, 890],
  "Nimbus Systems": [510, 520, 540, 560, 590, 610, 640, 670, 710, 750, 790, 830],
  "Anchorpoint": [300, 310, 300, 310, 300, 290, 280, 270, 260, 250, 240, 230],
  "Other providers": [230, 220, 210, 200, 190, 180, 170, 160, 150, 140, 130, 120],
};
const providers = Object.keys(rawSpend);

const totals = quarters.map((_, i) =>
  providers.reduce((sum, name) => sum + rawSpend[name][i], 0)
);
const sharePct = {};
providers.forEach((name) => {
  sharePct[name] = rawSpend[name].map((v, i) => (100 * v) / totals[i]);
});

// Give each band a little depth: a vertical gradient fill (richer near the
// band's own boundary, softer toward the stack) instead of a flat opacity.
function hexToRgba(hex, alpha) {
  const n = parseInt(hex.slice(1), 16);
  return `rgba(${(n >> 16) & 255}, ${(n >> 8) & 255}, ${n & 255}, ${alpha})`;
}
function bandGradient(hex) {
  return new echarts.graphic.LinearGradient(0, 0, 0, 1, [
    { offset: 0, color: hexToRgba(hex, 0.92) },
    { offset: 1, color: hexToRgba(hex, 0.6) },
  ]);
}

// --- Init --------------------------------------------------------------------
const chart = echarts.init(document.getElementById("container"));

// --- Option --------------------------------------------------------------------
chart.setOption({
  animation: false,
  color: t.palette,
  backgroundColor: "transparent",
  title: {
    text: "Cloud Spend Share · area-stacked-percent · javascript · echarts · anyplot.ai",
    left: "center",
    textStyle: { color: t.ink, fontSize: 20, fontWeight: 500 },
  },
  grid: { left: 90, right: 40, top: 130, bottom: 110 },
  legend: {
    top: 68,
    left: "center",
    icon: "roundRect",
    itemWidth: 16,
    itemHeight: 10,
    textStyle: { color: t.inkSoft, fontSize: 14 },
  },
  tooltip: { trigger: "axis" },
  xAxis: {
    type: "category",
    data: quarters,
    boundaryGap: false,
    axisLabel: { color: t.inkSoft, fontSize: 14, rotate: 30 },
    axisLine: { lineStyle: { color: t.inkSoft } },
    axisTick: { show: false },
    splitLine: { show: false },
  },
  yAxis: {
    type: "value",
    min: 0,
    max: 100,
    interval: 20,
    axisLabel: { color: t.inkSoft, fontSize: 14, formatter: "{value}%" },
    axisLine: { show: false },
    axisTick: { show: false },
    splitLine: { lineStyle: { color: t.grid } },
  },
  series: providers.map((name, i) => ({
    name,
    type: "line",
    stack: "share",
    areaStyle: { color: bandGradient(t.palette[i]), opacity: 0.9 },
    lineStyle: { width: 1, color: t.pageBg },
    showSymbol: false,
    emphasis: { focus: "series" },
    data: sharePct[name],
  })),
});
Runnable source as JSON, for any HTTP client: https://api.anyplot.ai/specs/area-stacked-percent/echarts/code. Any spec id and library id listed in llms-full.txt fit the same URL shape; every URL below is complete and callable.
{
  "spec_id": "area-stacked-percent",
  "language": "javascript",
  "library": "echarts",
  "page": "https://anyplot.ai/area-stacked-percent/javascript/echarts",
  "hub": "https://anyplot.ai/area-stacked-percent",
  "code_json": "https://api.anyplot.ai/specs/area-stacked-percent/echarts/code",
  "spec_json": "https://api.anyplot.ai/specs/area-stacked-percent",
  "render_light_png": "https://storage.googleapis.com/anyplot-images/plots/area-stacked-percent/javascript/echarts/plot-light.png",
  "render_dark_png": "https://storage.googleapis.com/anyplot-images/plots/area-stacked-percent/javascript/echarts/plot-dark.png",
  "interactive_light_html": "https://storage.googleapis.com/anyplot-images/plots/area-stacked-percent/javascript/echarts/plot-light.html",
  "interactive_dark_html": "https://storage.googleapis.com/anyplot-images/plots/area-stacked-percent/javascript/echarts/plot-dark.html",
  "quality_score": 91.0,
  "license": "MIT",
  "guide": "https://anyplot.ai/llms.txt"
}
Part of 100% Stacked Area Chart on anyplot.ai.