The same plot in 14 other libraries — JavaScript: Chart.js, D3.js, Highcharts, MUI X Charts; Python: Altair, Bokeh, lets-plot, Matplotlib, Plotly, plotnine, Pygal, Seaborn; R: ggplot2; Julia: Makie.jl. Compare all 15 side by side: Bland-Altman Agreement Plot in Python, R, Julia and JavaScript.
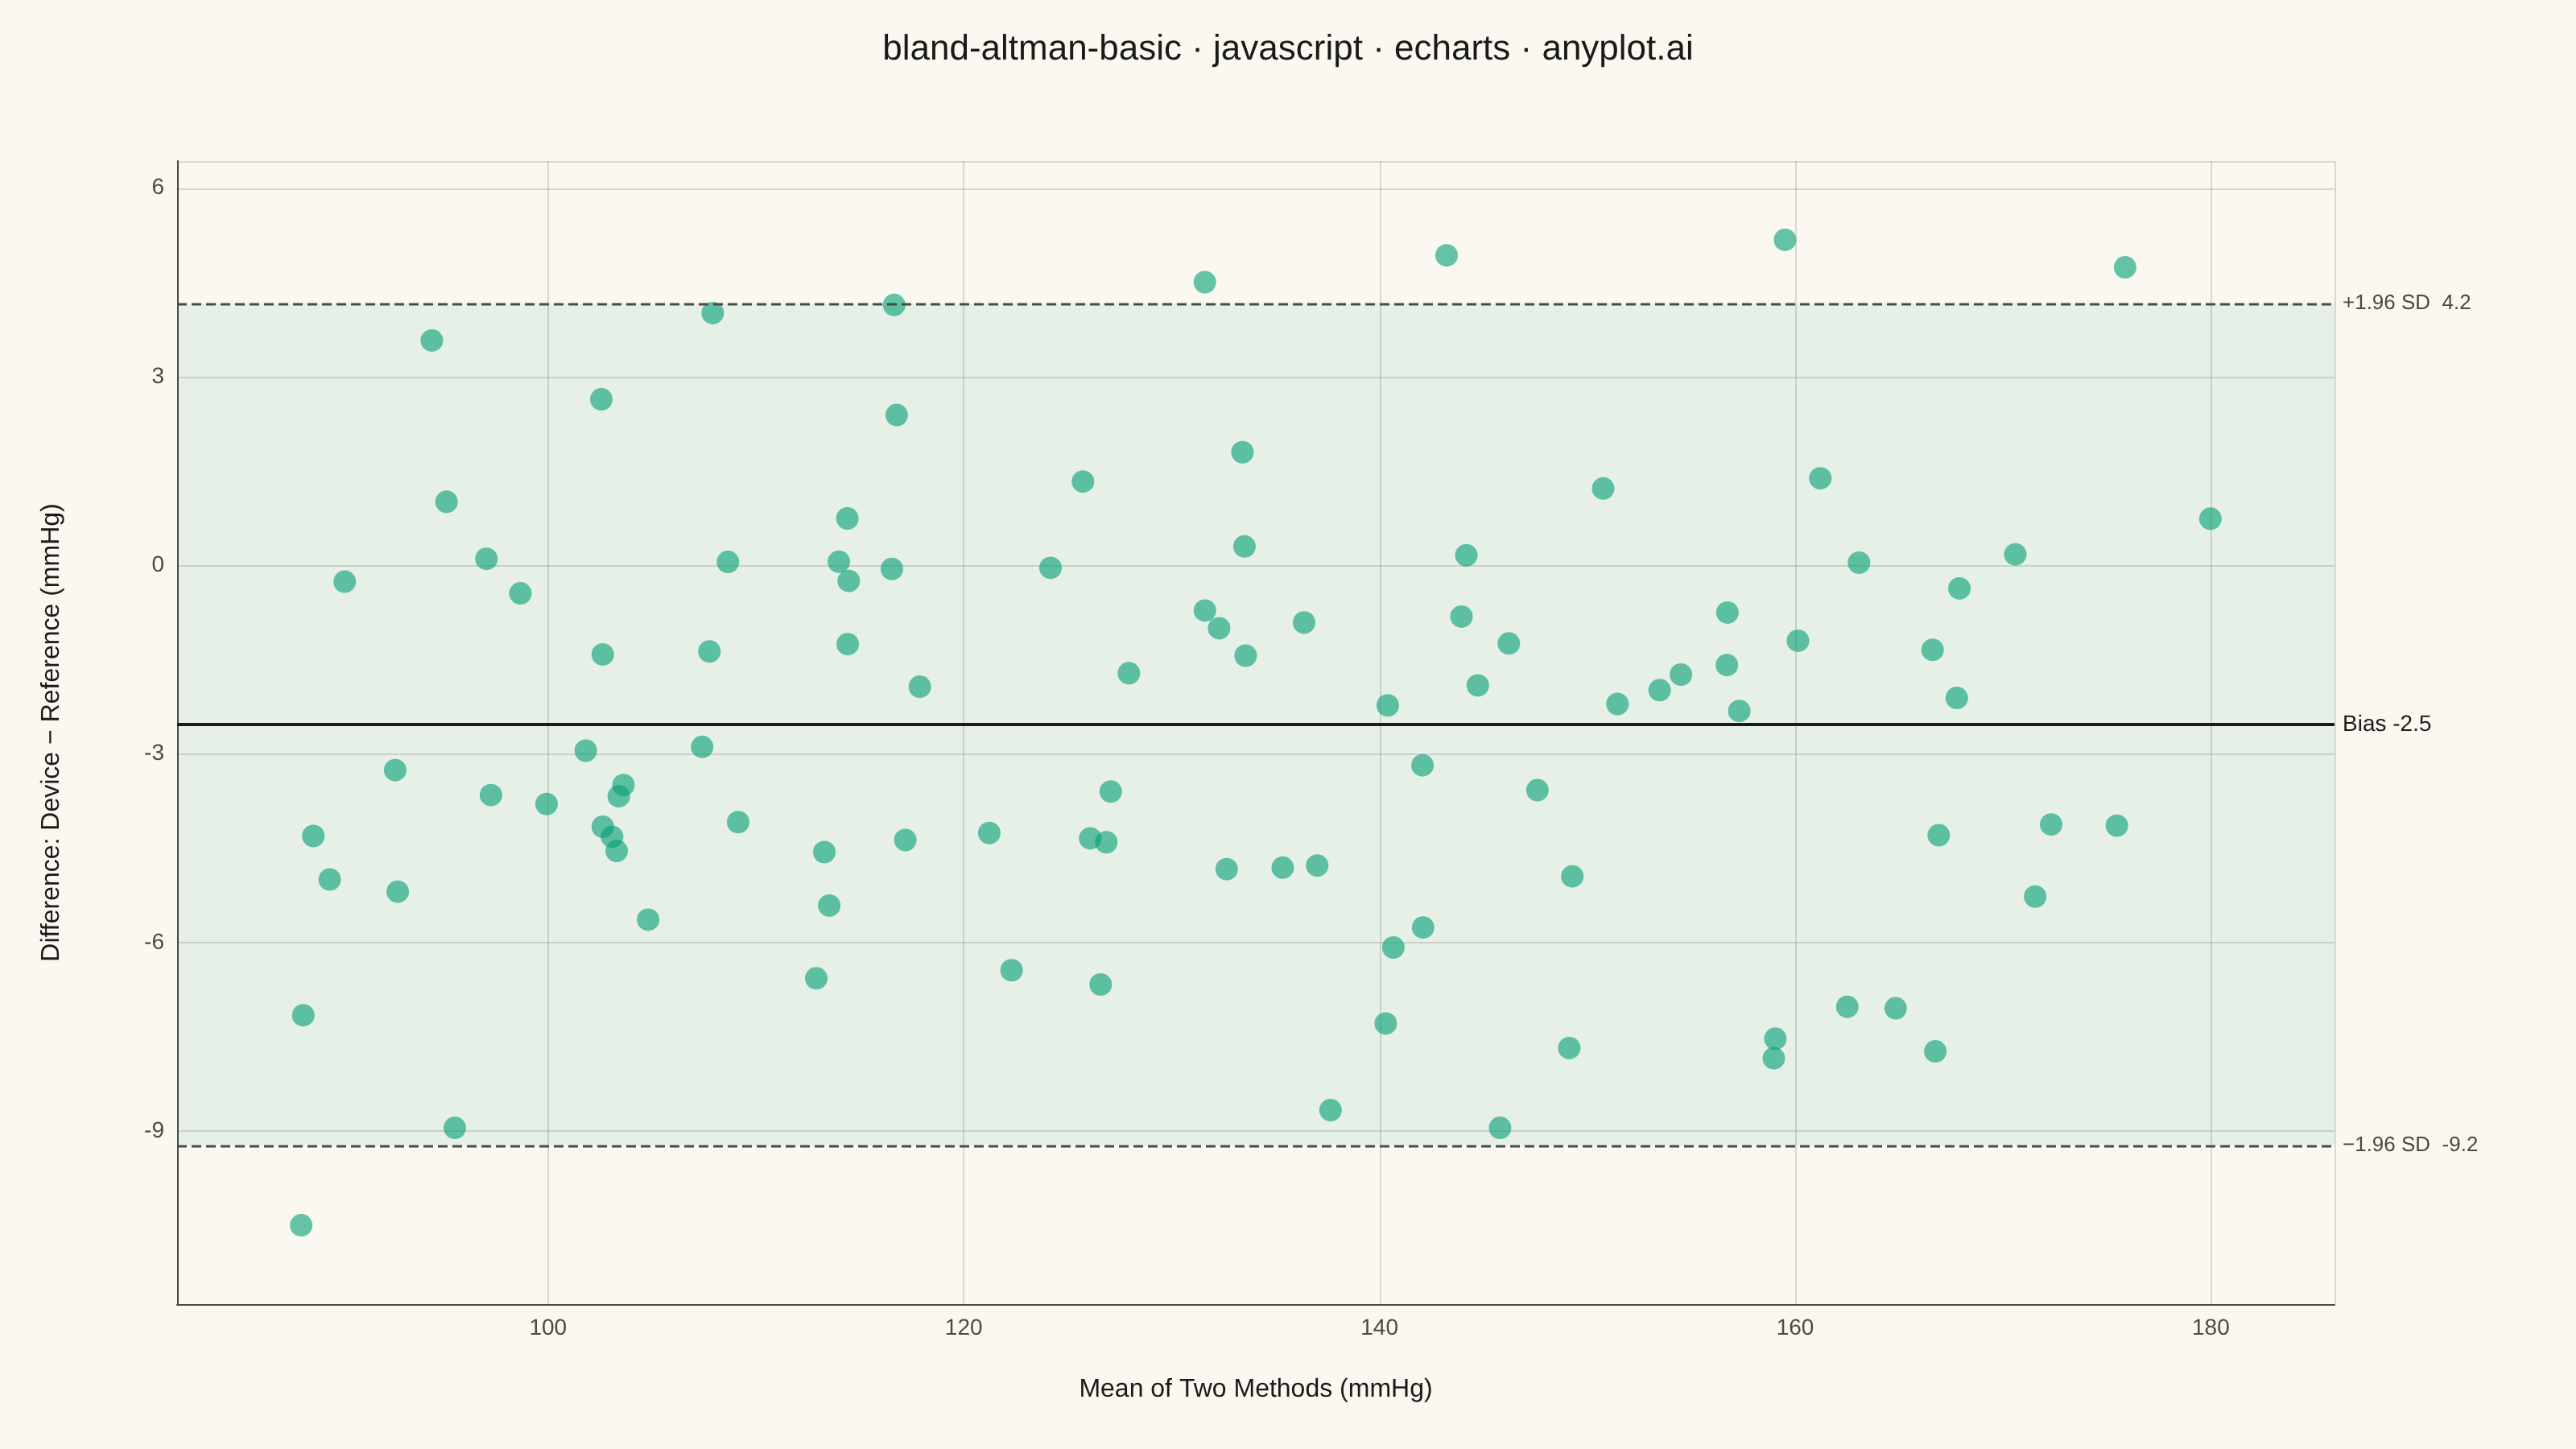
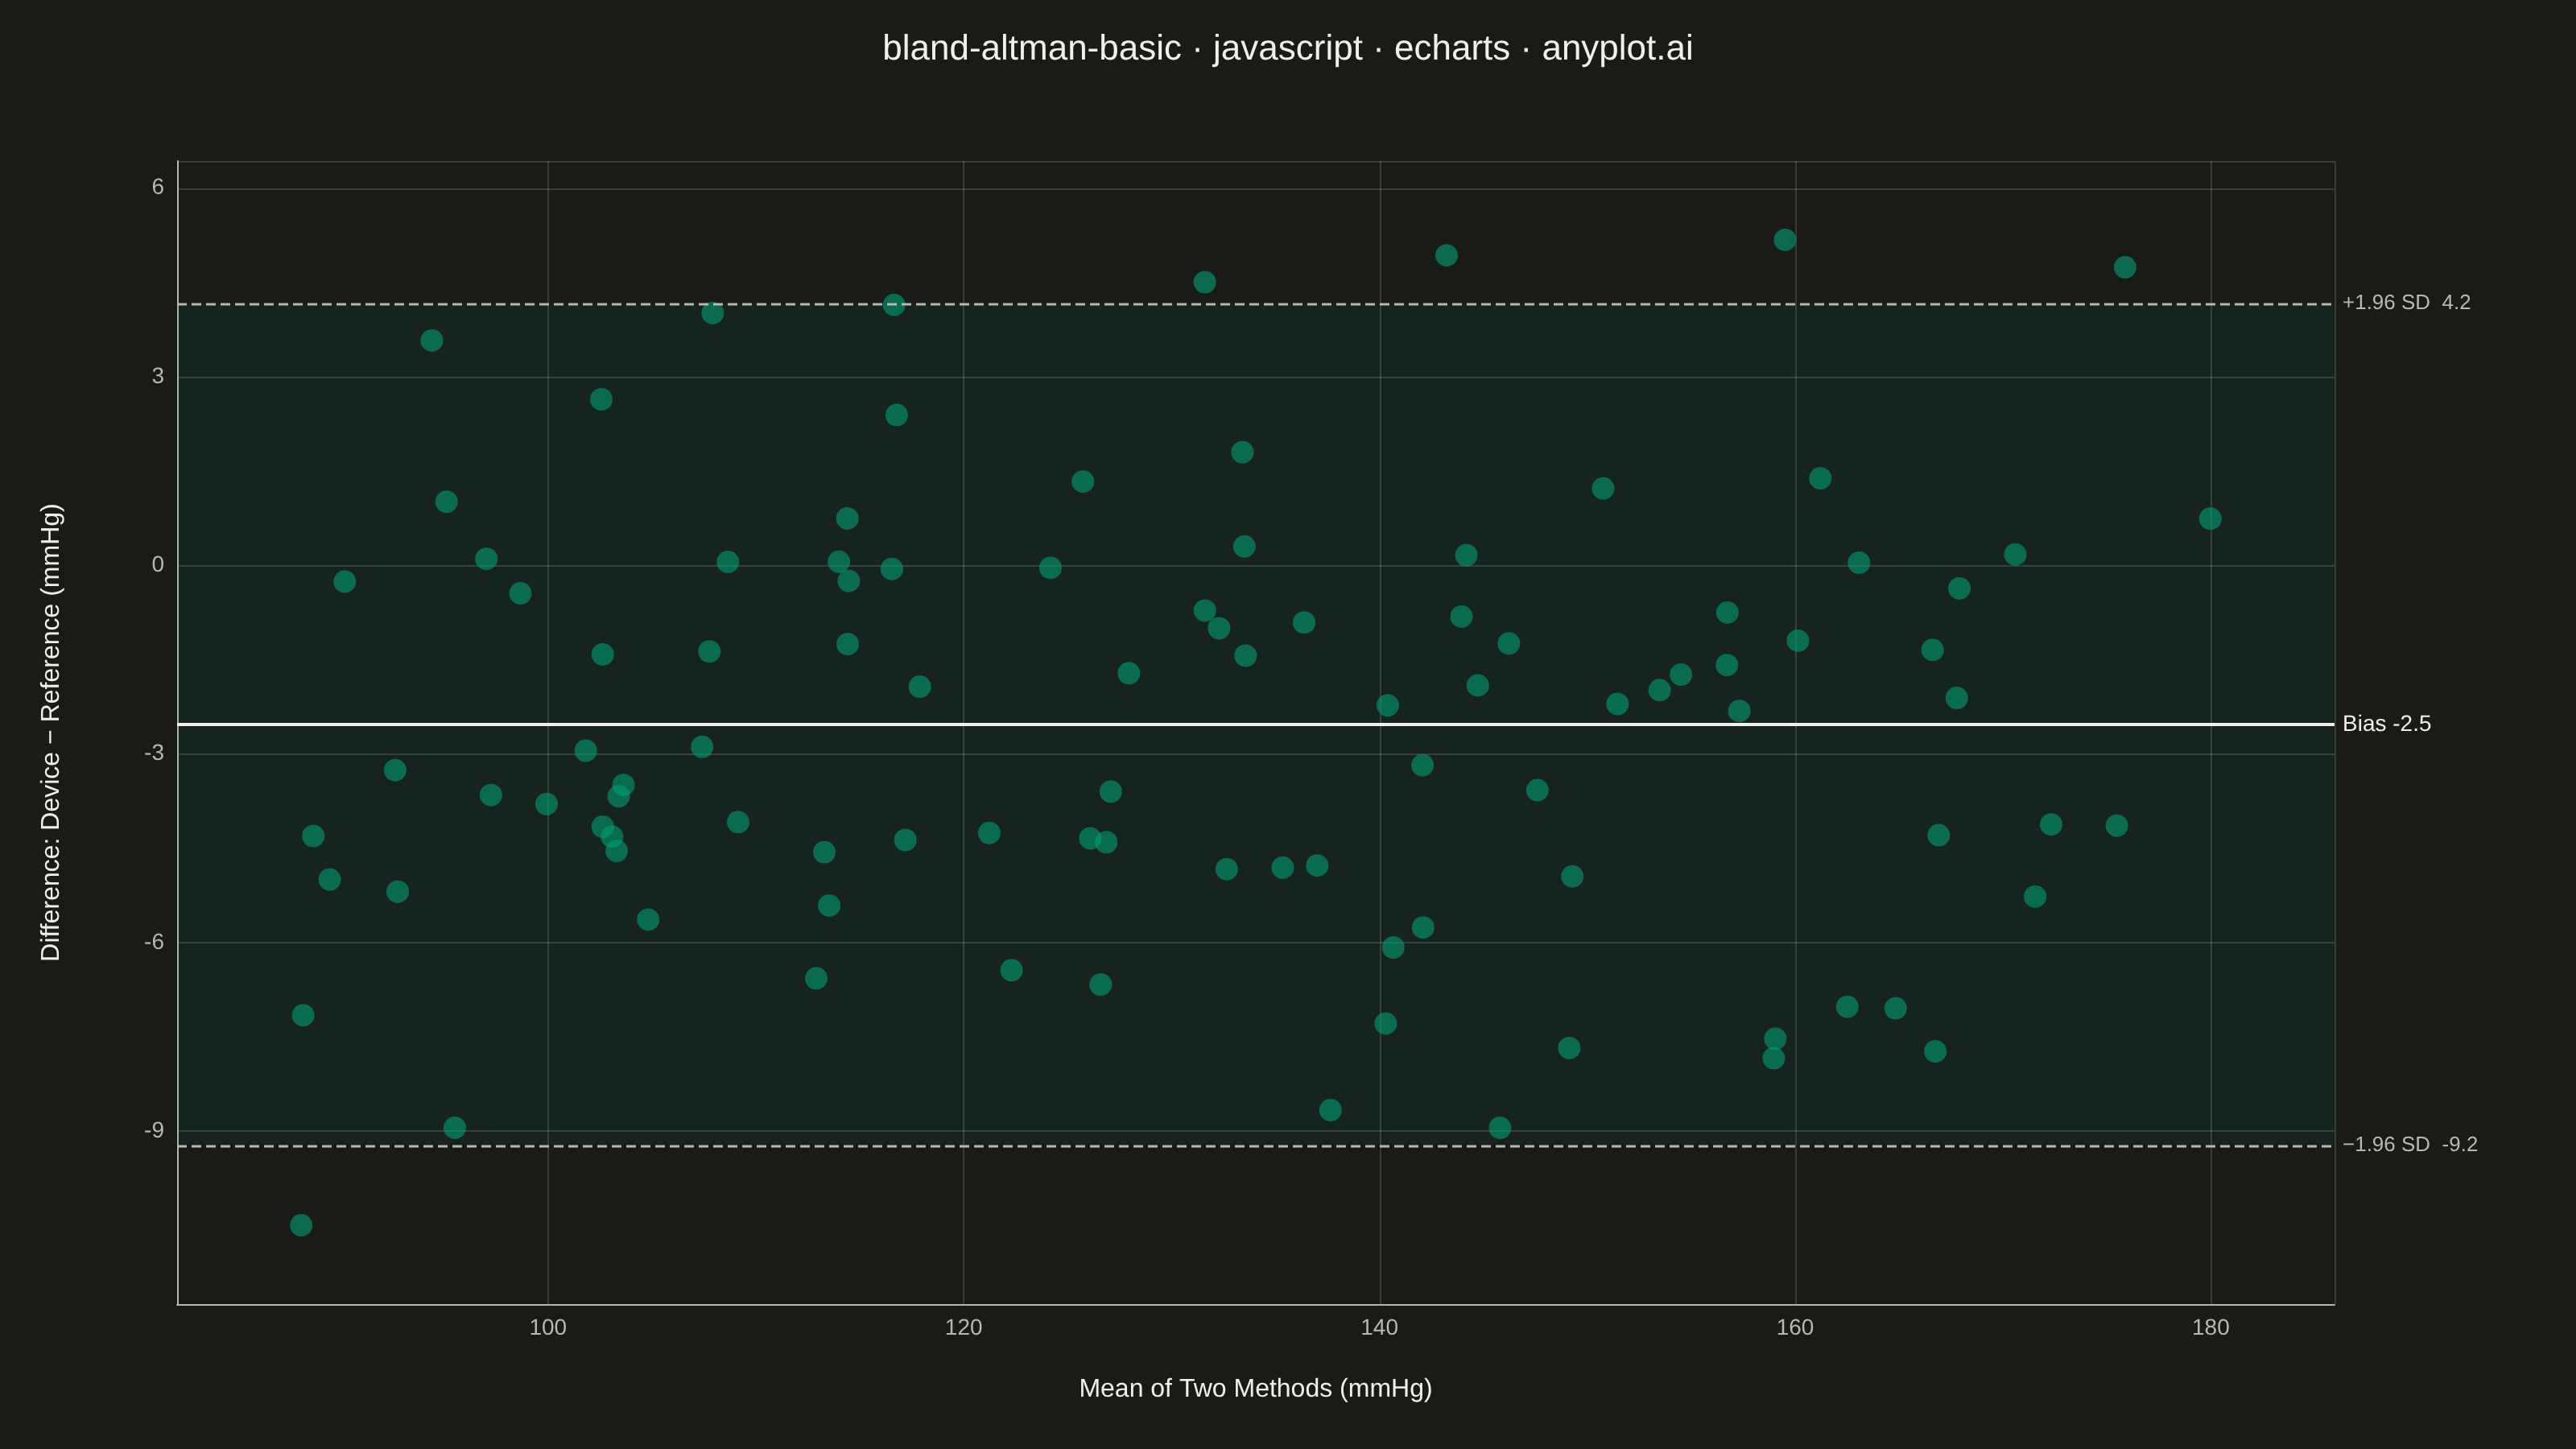
A Bland-Altman plot (also known as a difference plot or Tukey mean-difference plot) visualizes the agreement between two measurement methods by plotting the difference against the average of paired observations. It displays the mean difference (bias) as a horizontal line and limits of agreement (mean ± 1.96 SD) to assess whether the methods are interchangeable within acceptable tolerances.
// anyplot.ai
// bland-altman-basic: Bland-Altman Agreement Plot
// Library: echarts 6.1.0 | JavaScript 22.23.1
// Quality: 90/100 | Created: 2026-08-11

const t = window.ANYPLOT_TOKENS;

// --- Data (in-memory, deterministic LCG) ------------------------------------
// mulberry32 PRNG — the browser has no seeded Math.random()
function mulberry32(seed) {
  return function () {
    seed |= 0;
    seed = (seed + 0x6d2b79f5) | 0;
    let x = Math.imul(seed ^ (seed >>> 15), 1 | seed);
    x = (x + Math.imul(x ^ (x >>> 7), 61 | x)) ^ x;
    return ((x ^ (x >>> 14)) >>> 0) / 4294967296;
  };
}
const rand = mulberry32(42);
function gaussian() {
  const u1 = rand() || 1e-9;
  const u2 = rand();
  return Math.sqrt(-2 * Math.log(u1)) * Math.cos(2 * Math.PI * u2);
}

// Systolic blood pressure (mmHg): reference mercury sphygmomanometer vs a new
// automated device, paired readings from the same subjects.
const n = 100;
const referenceBp = [];
const deviceBp = [];
for (let i = 0; i < n; i++) {
  const reference = 90 + rand() * 90;
  const device = reference - 2.5 + gaussian() * 3.5;
  referenceBp.push(reference);
  deviceBp.push(device);
}

const points = referenceBp.map((reference, i) => {
  const device = deviceBp[i];
  const mean = (device + reference) / 2;
  const diff = device - reference;
  return [mean, diff];
});

const diffs = points.map((p) => p[1]);
const bias = diffs.reduce((a, b) => a + b, 0) / diffs.length;
const variance =
  diffs.reduce((a, b) => a + (b - bias) ** 2, 0) / (diffs.length - 1);
const sd = Math.sqrt(variance);
const upperLoA = bias + 1.96 * sd;
const lowerLoA = bias - 1.96 * sd;

// Irregular (non-round-number) axis padding so the auto-computed tick grid
// never lands exactly on the plot boundary — a round min/max there produces
// a splitLine coincident with the edge, which reads as a false box border.
const means = points.map((p) => p[0]);
const xPad = (Math.max(...means) - Math.min(...means)) * 0.065;
const xMin = Math.min(...means) - xPad;
const xMax = Math.max(...means) + xPad;
const yPad = (Math.max(...diffs) - Math.min(...diffs)) * 0.08;
const yMin = Math.min(...diffs) - yPad;
const yMax = Math.max(...diffs) + yPad;

// --- Init ---------------------------------------------------------------
const chart = echarts.init(document.getElementById("container"));

// --- Option ---------------------------------------------------------------
chart.setOption({
  animation: false,
  color: t.palette,
  backgroundColor: "transparent",
  title: {
    text: "bland-altman-basic · javascript · echarts · anyplot.ai",
    left: "center",
    textStyle: { color: t.ink, fontSize: 22, fontWeight: 500 },
  },
  grid: { left: 110, right: 150, top: 100, bottom: 90 },
  tooltip: {
    trigger: "item",
    backgroundColor: t.elevatedBg,
    borderColor: t.grid,
    textStyle: { color: t.ink },
    formatter: (params) =>
      Array.isArray(params.value)
        ? `Mean: ${params.value[0].toFixed(1)} mmHg<br/>Difference: ${params.value[1].toFixed(1)} mmHg`
        : params.name,
  },
  xAxis: {
    type: "value",
    min: xMin,
    max: xMax,
    name: "Mean of Two Methods (mmHg)",
    nameLocation: "middle",
    nameGap: 45,
    nameTextStyle: { color: t.ink, fontSize: 16 },
    axisLabel: {
      color: t.inkSoft,
      fontSize: 14,
      showMinLabel: false,
      showMaxLabel: false,
    },
    axisLine: { onZero: false, lineStyle: { color: t.inkSoft } },
    axisTick: { show: false },
    splitLine: { lineStyle: { color: t.grid } },
  },
  yAxis: {
    type: "value",
    min: yMin,
    max: yMax,
    name: "Difference: Device − Reference (mmHg)",
    nameLocation: "middle",
    nameGap: 70,
    nameTextStyle: { color: t.ink, fontSize: 16 },
    axisLabel: {
      color: t.inkSoft,
      fontSize: 14,
      showMinLabel: false,
      showMaxLabel: false,
    },
    axisLine: { onZero: false, lineStyle: { color: t.inkSoft } },
    axisTick: { show: false },
    splitLine: { lineStyle: { color: t.grid } },
  },
  series: [
    {
      type: "scatter",
      data: points,
      symbolSize: 14,
      itemStyle: { color: t.palette[0], opacity: 0.6 },
      markArea: {
        silent: true,
        itemStyle: { color: t.palette[0], opacity: 0.08 },
        data: [[{ yAxis: lowerLoA }, { yAxis: upperLoA }]],
      },
      markLine: {
        symbol: "none",
        silent: true,
        animation: false,
        lineStyle: { width: 2 },
        label: { fontSize: 14, position: "end" },
        data: [
          {
            yAxis: bias,
            lineStyle: { color: t.ink, type: "solid" },
            label: { color: t.ink, formatter: `Bias ${bias.toFixed(1)}` },
          },
          {
            yAxis: upperLoA,
            lineStyle: { color: t.inkSoft, type: "dashed", width: 1.5 },
            label: {
              color: t.inkSoft,
              fontSize: 13,
              formatter: `+1.96 SD  ${upperLoA.toFixed(1)}`,
            },
          },
          {
            yAxis: lowerLoA,
            lineStyle: { color: t.inkSoft, type: "dashed", width: 1.5 },
            label: {
              color: t.inkSoft,
              fontSize: 13,
              formatter: `−1.96 SD  ${lowerLoA.toFixed(1)}`,
            },
          },
        ],
      },
    },
  ],
});
Runnable source as JSON, for any HTTP client: https://api.anyplot.ai/specs/bland-altman-basic/echarts/code. Any spec id and library id listed in llms-full.txt fit the same URL shape; every URL below is complete and callable.
{
  "spec_id": "bland-altman-basic",
  "language": "javascript",
  "library": "echarts",
  "page": "https://anyplot.ai/bland-altman-basic/javascript/echarts",
  "hub": "https://anyplot.ai/bland-altman-basic",
  "code_json": "https://api.anyplot.ai/specs/bland-altman-basic/echarts/code",
  "spec_json": "https://api.anyplot.ai/specs/bland-altman-basic",
  "render_light_png": "https://storage.googleapis.com/anyplot-images/plots/bland-altman-basic/javascript/echarts/plot-light.png",
  "render_dark_png": "https://storage.googleapis.com/anyplot-images/plots/bland-altman-basic/javascript/echarts/plot-dark.png",
  "interactive_light_html": "https://storage.googleapis.com/anyplot-images/plots/bland-altman-basic/javascript/echarts/plot-light.html",
  "interactive_dark_html": "https://storage.googleapis.com/anyplot-images/plots/bland-altman-basic/javascript/echarts/plot-dark.html",
  "quality_score": 90.0,
  "license": "MIT",
  "guide": "https://anyplot.ai/llms.txt"
}
Part of Bland-Altman Agreement Plot on anyplot.ai.