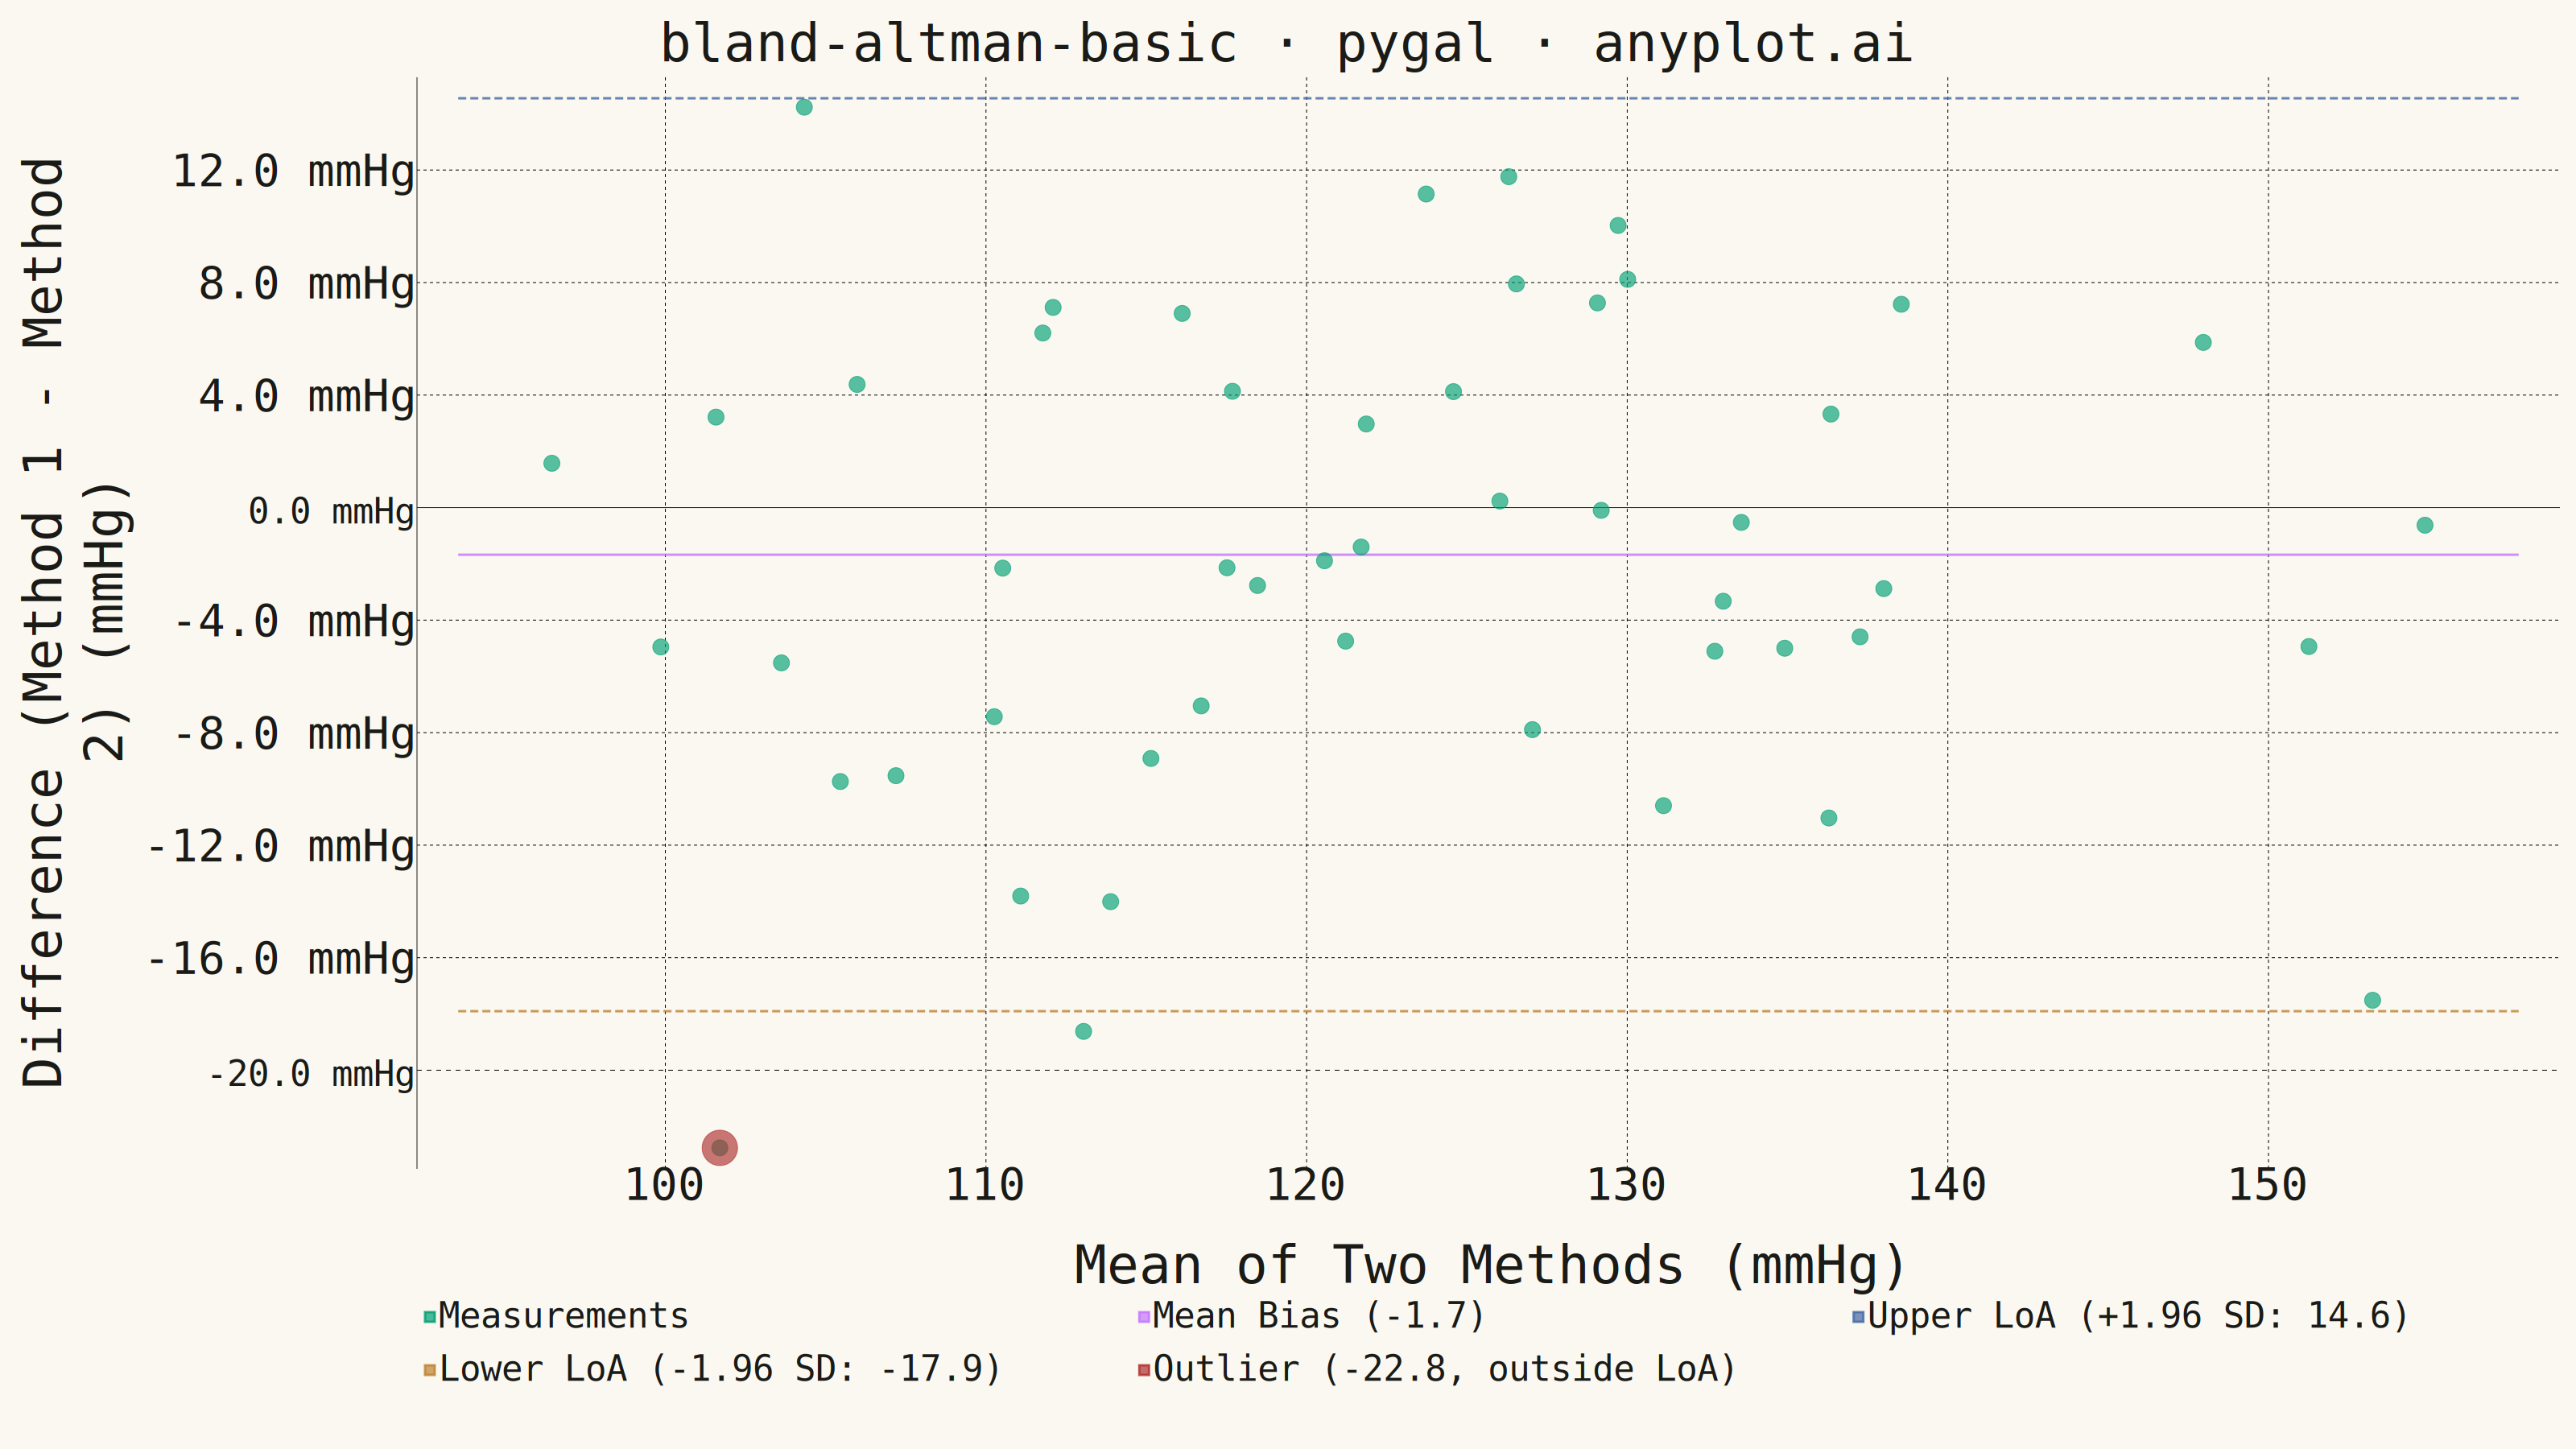
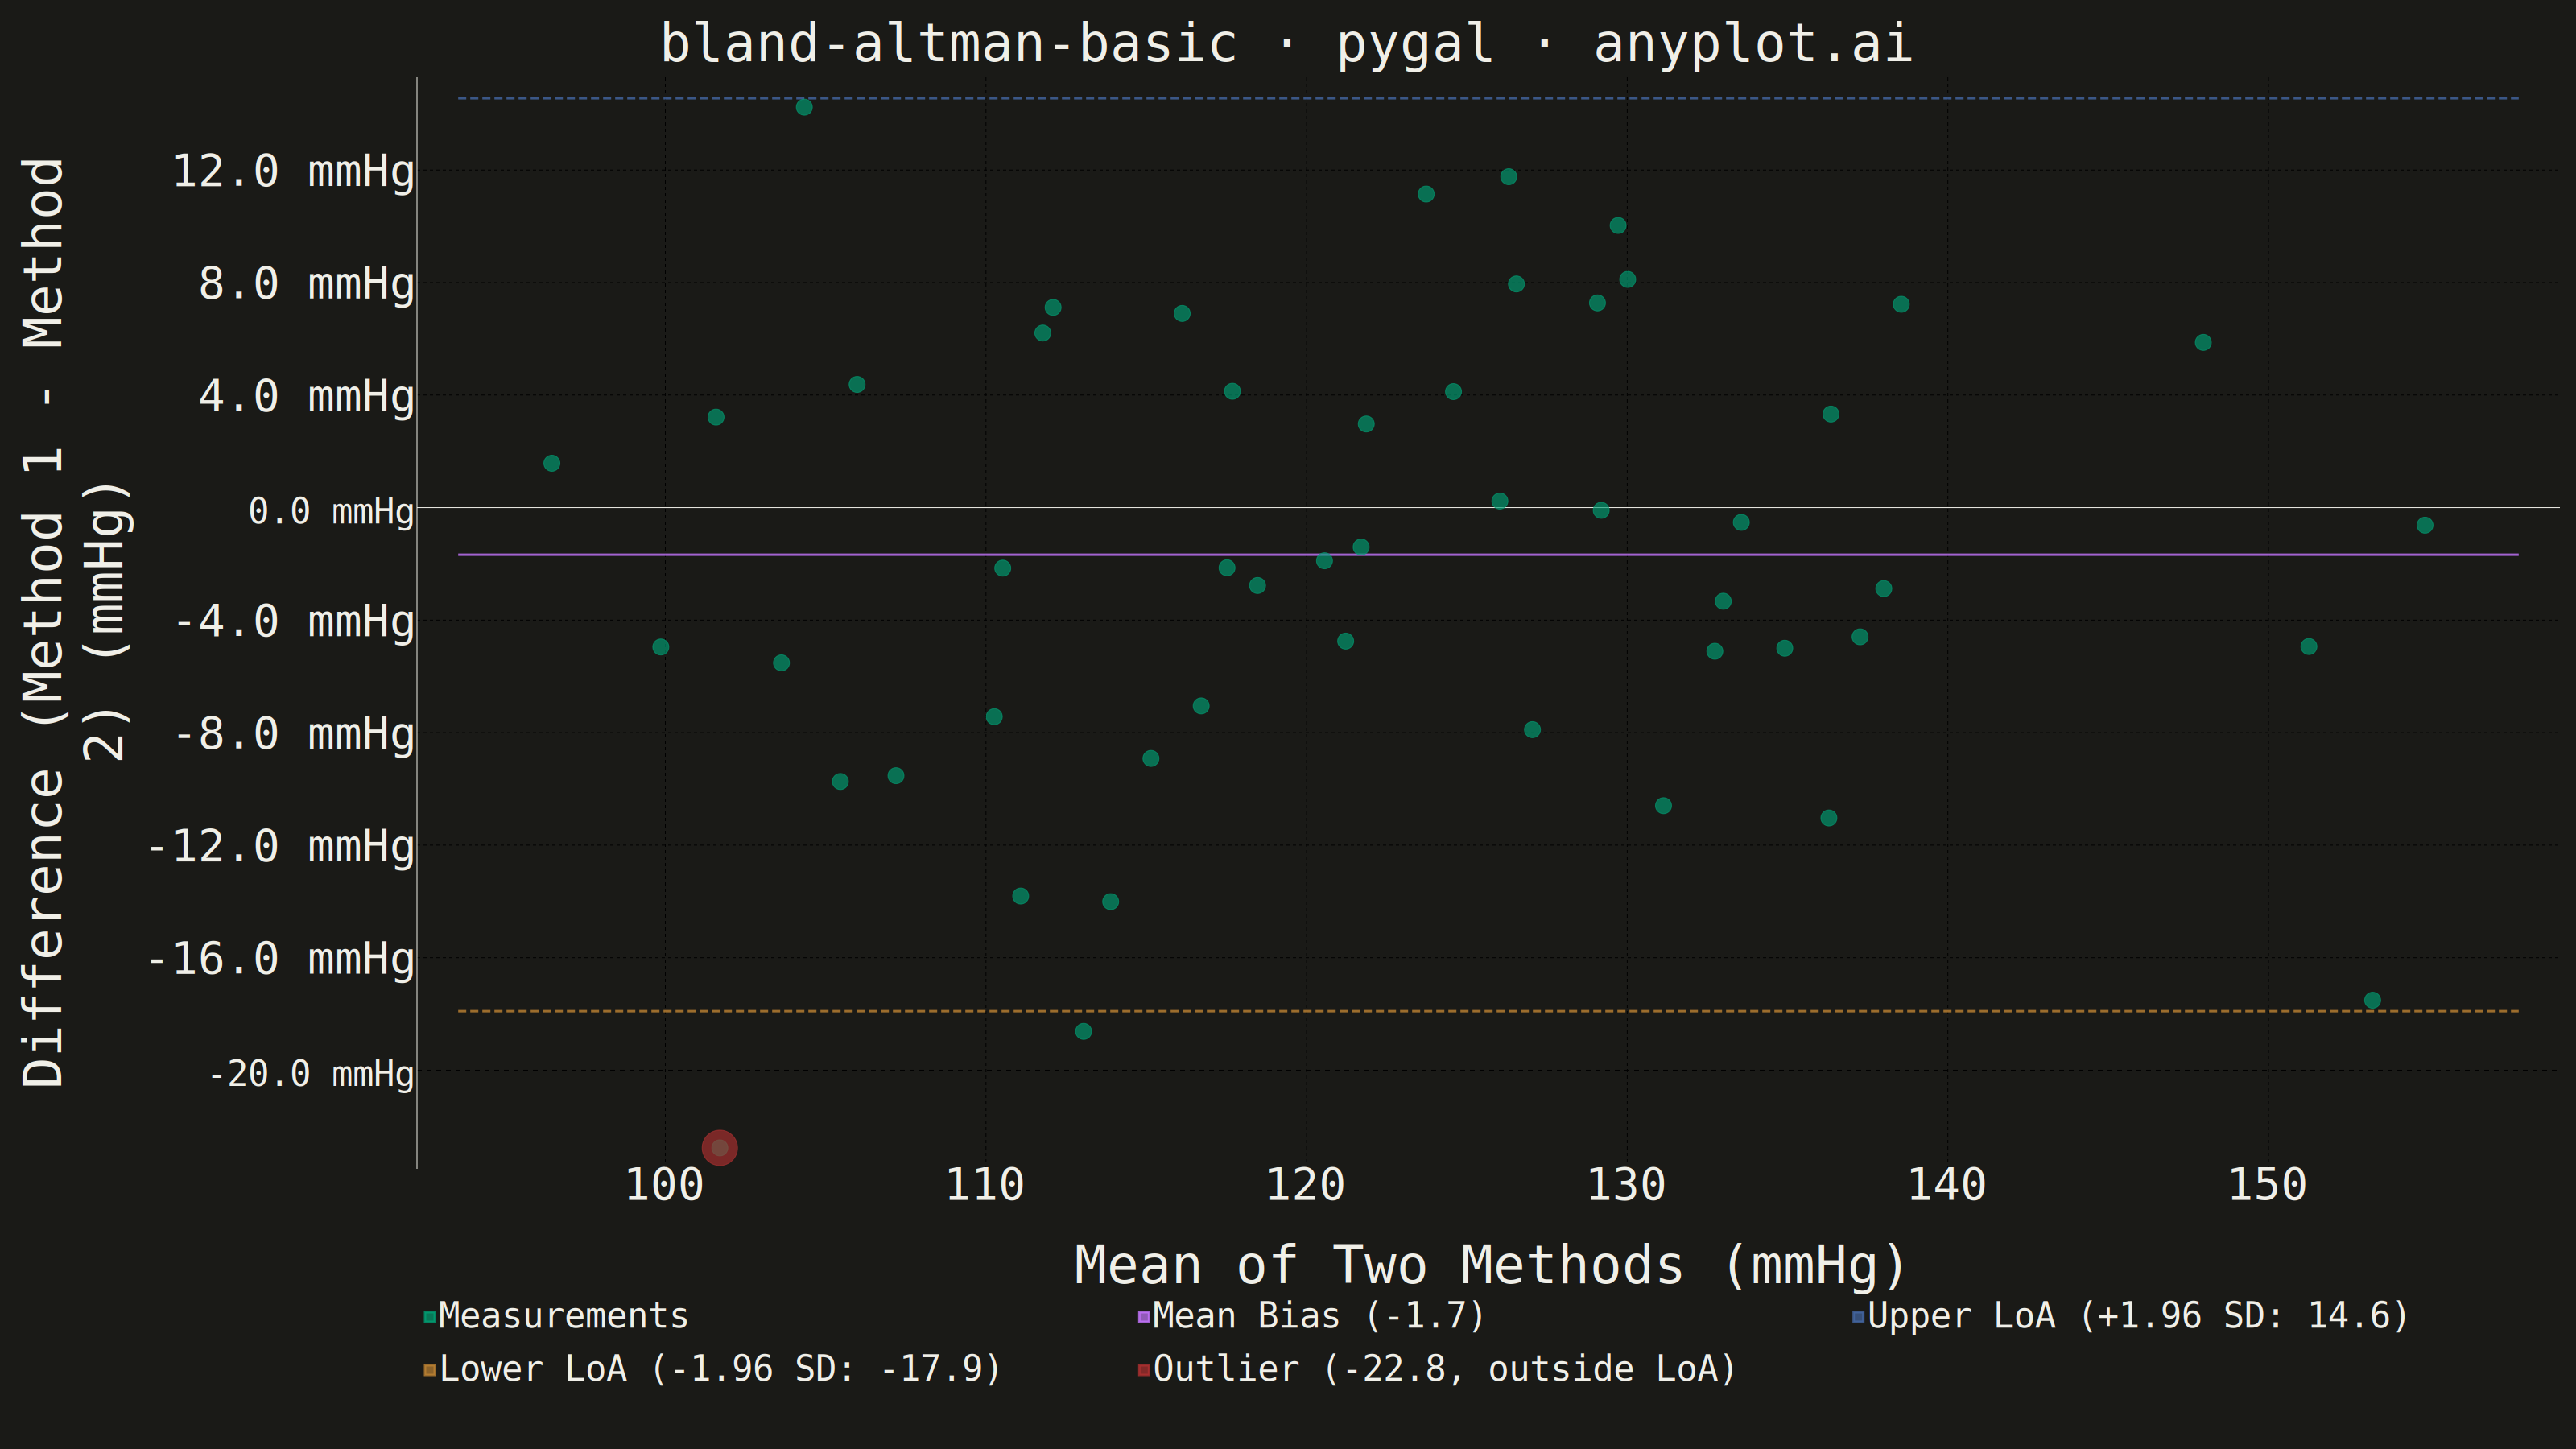
A Bland-Altman plot (also known as a difference plot or Tukey mean-difference plot) visualizes the agreement between two measurement methods by plotting the difference against the average of paired observations. It displays the mean difference (bias) as a horizontal line and limits of agreement (mean ± 1.96 SD) to assess whether the methods are interchangeable within acceptable tolerances.
""" anyplot.ai
bland-altman-basic: Bland-Altman Agreement Plot
Library: pygal 3.1.3 | Python 3.13.14
Quality: 91/100 | Updated: 2026-08-11
"""

import os

import numpy as np
import pygal
from pygal.style import Style


# Theme tokens (from prompts/default-style-guide.md)
THEME = os.getenv("ANYPLOT_THEME", "light")
PAGE_BG = "#FAF8F1" if THEME == "light" else "#1A1A17"
INK = "#1A1A17" if THEME == "light" else "#F0EFE8"
INK_MUTED = "#6B6A63" if THEME == "light" else "#A8A79F"

# Imprint palette (first series = brand green #009E73). The outlier highlight
# continues the canonical Imprint sequence.
IMPRINT = ("#009E73", "#C475FD", "#4467A3", "#BD8233", "#AE3030")

# Data - Blood pressure readings from two different sphygmomanometers
np.random.seed(42)
n_subjects = 50

# Simulate paired blood pressure measurements (systolic, mmHg)
true_bp = np.random.normal(125, 15, n_subjects)
method1 = true_bp + np.random.normal(0, 5, n_subjects)
method2 = true_bp + np.random.normal(2, 6, n_subjects)

# Bland-Altman calculations
mean_values = (method1 + method2) / 2
differences = method1 - method2

mean_diff = np.mean(differences)
std_diff = np.std(differences, ddof=1)
upper_loa = mean_diff + 1.96 * std_diff
lower_loa = mean_diff - 1.96 * std_diff

# Point furthest from the bias line - called out separately below
outlier_idx = int(np.argmax(np.abs(differences - mean_diff)))
outlier_x = float(mean_values[outlier_idx])
outlier_y = float(differences[outlier_idx])
outlier_outside_loa = outlier_y > upper_loa or outlier_y < lower_loa

# Custom style with theme-adaptive colors (canonical pygal sizing, see
# prompts/library/pygal.md "Sizing + Theme for 3200x1800 px")
custom_style = Style(
    background=PAGE_BG,
    plot_background=PAGE_BG,
    foreground=INK,
    foreground_strong=INK,
    foreground_subtle=INK_MUTED,
    colors=IMPRINT,
    title_font_size=66,
    label_font_size=56,
    major_label_font_size=44,
    legend_font_size=44,
    value_font_size=36,
    dot_opacity=0.65,  # spec: scatter points at moderate transparency to reveal overlap
    stroke_width=3,
)

# Create XY chart for Bland-Altman scatter
chart = pygal.XY(
    width=3200,
    height=1800,
    style=custom_style,
    title="bland-altman-basic · pygal · anyplot.ai",
    x_title="Mean of Two Methods (mmHg)",
    y_title="Difference (Method 1 - Method 2) (mmHg)",
    show_legend=True,
    legend_at_bottom=True,
    dots_size=10,
    stroke=False,
    show_x_guides=True,
    show_y_guides=True,
    value_formatter=lambda v: f"{v:.1f} mmHg",
)

# Prepare scatter data points with opacity for overlapping observations
scatter_data = [{"value": (float(mean_values[i]), float(differences[i]))} for i in range(n_subjects)]

# Add scatter points (main series in brand green)
chart.add("Measurements", scatter_data)

# Add horizontal lines for mean and limits of agreement
x_min, x_max = min(mean_values), max(mean_values)
margin = (x_max - x_min) * 0.05
x_range = [x_min - margin, x_max + margin]

# Mean line (bias)
chart.add(
    f"Mean Bias ({mean_diff:.1f})",
    [(x_range[0], mean_diff), (x_range[1], mean_diff)],
    stroke=True,
    dots_size=0,
    stroke_style={"width": 3},
)

# Upper limit of agreement
chart.add(
    f"Upper LoA (+1.96 SD: {upper_loa:.1f})",
    [(x_range[0], upper_loa), (x_range[1], upper_loa)],
    stroke=True,
    dots_size=0,
    stroke_style={"width": 2, "dasharray": "10, 5"},
)

# Lower limit of agreement
chart.add(
    f"Lower LoA (-1.96 SD: {lower_loa:.1f})",
    [(x_range[0], lower_loa), (x_range[1], lower_loa)],
    stroke=True,
    dots_size=0,
    stroke_style={"width": 2, "dasharray": "10, 5"},
)

# Outlier callout - the single observation furthest from the bias line,
# replotted larger and in a distinct color so it reads as the plot's focal
# point without altering the underlying "Measurements" series.
chart.add(
    f"Outlier ({outlier_y:+.1f}{', outside LoA' if outlier_outside_loa else ''})",
    [{"value": (outlier_x, outlier_y)}],
    dots_size=22,
    stroke=False,
)

# Save outputs
chart.render_to_png(f"plot-{THEME}.png")
with open(f"plot-{THEME}.html", "wb") as f:
    f.write(chart.render())
Runnable source as JSON, for any HTTP client: https://api.anyplot.ai/specs/bland-altman-basic/pygal/code. Any spec id and library id listed in llms-full.txt fit the same URL shape; every URL below is complete and callable.
{
  "spec_id": "bland-altman-basic",
  "language": "python",
  "library": "pygal",
  "page": "https://anyplot.ai/bland-altman-basic/python/pygal",
  "hub": "https://anyplot.ai/bland-altman-basic",
  "code_json": "https://api.anyplot.ai/specs/bland-altman-basic/pygal/code",
  "spec_json": "https://api.anyplot.ai/specs/bland-altman-basic",
  "render_light_png": "https://storage.googleapis.com/anyplot-images/plots/bland-altman-basic/python/pygal/plot-light.png",
  "render_dark_png": "https://storage.googleapis.com/anyplot-images/plots/bland-altman-basic/python/pygal/plot-dark.png",
  "interactive_light_html": "https://storage.googleapis.com/anyplot-images/plots/bland-altman-basic/python/pygal/plot-light.html",
  "interactive_dark_html": "https://storage.googleapis.com/anyplot-images/plots/bland-altman-basic/python/pygal/plot-dark.html",
  "quality_score": 91.0,
  "license": "MIT",
  "guide": "https://anyplot.ai/llms.txt"
}
Part of Bland-Altman Agreement Plot on anyplot.ai.