The same plot in 14 other libraries — Python: Altair, Bokeh, lets-plot, Matplotlib, Plotly, Pygal, Seaborn; R: ggplot2; Julia: Makie.jl; JavaScript: Chart.js, D3.js, Apache ECharts, Highcharts, MUI X Charts. Compare all 15 side by side: Bland-Altman Agreement Plot in Python, R, Julia and JavaScript.
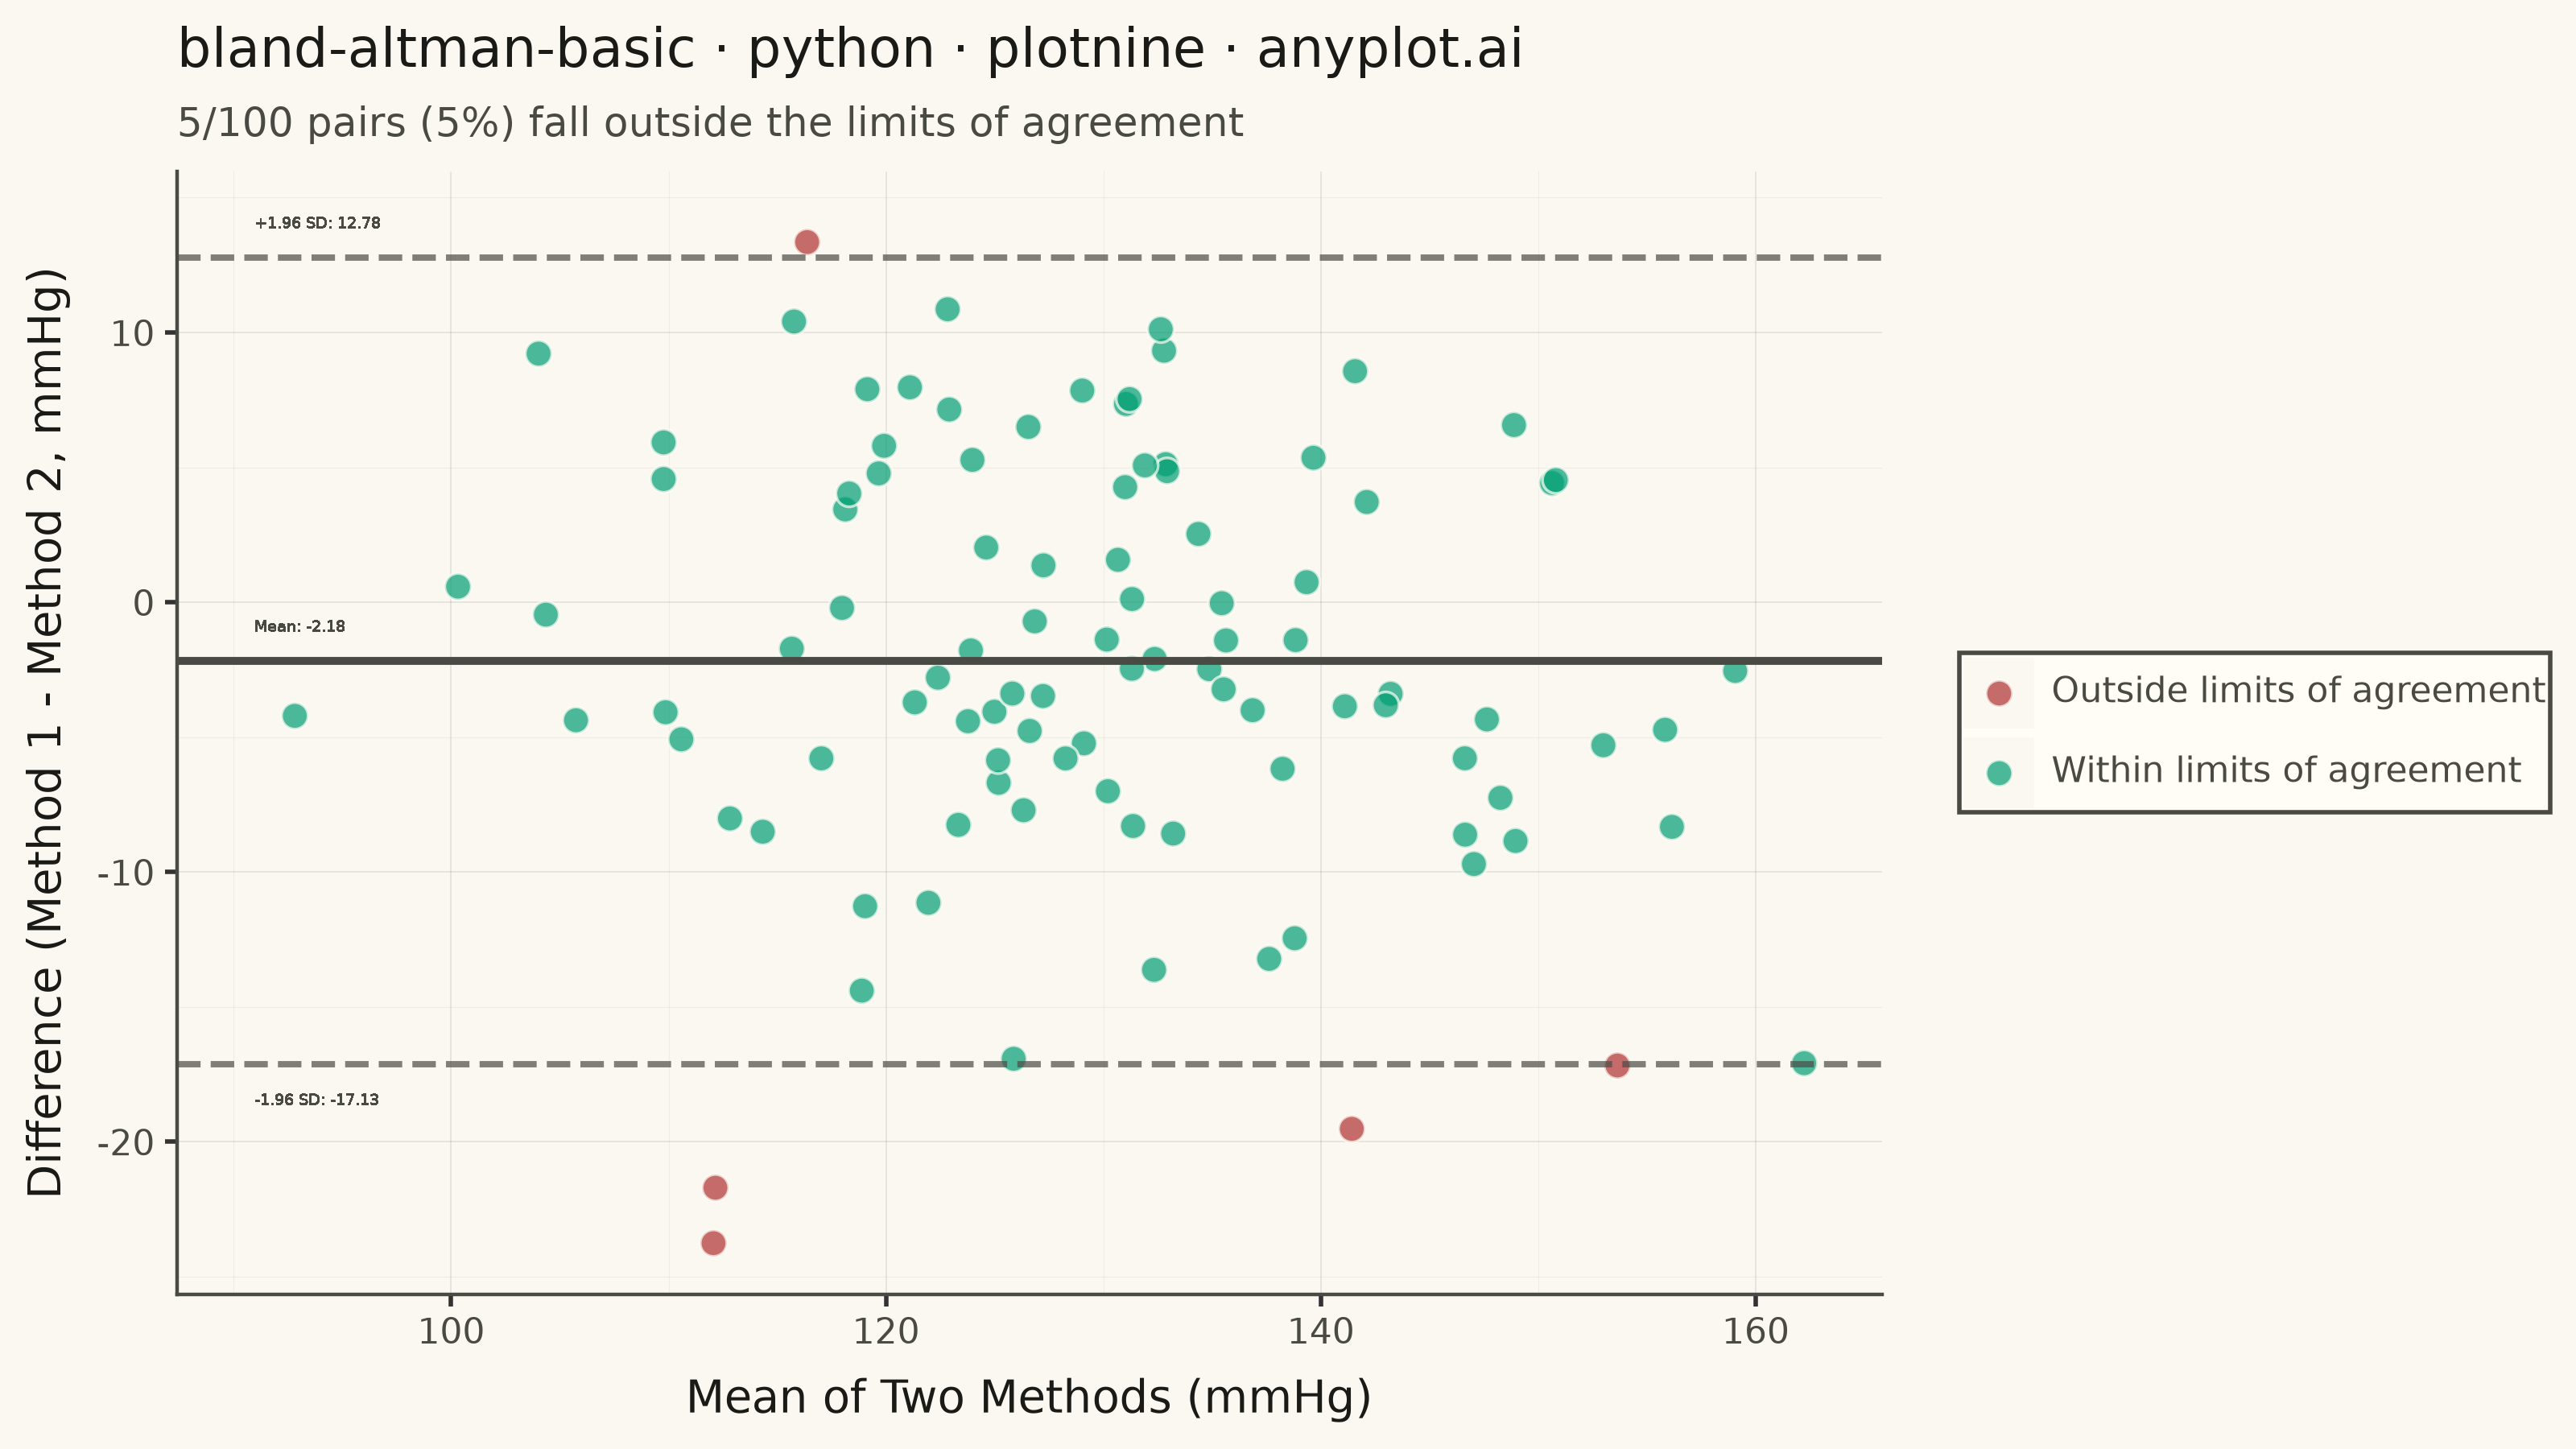
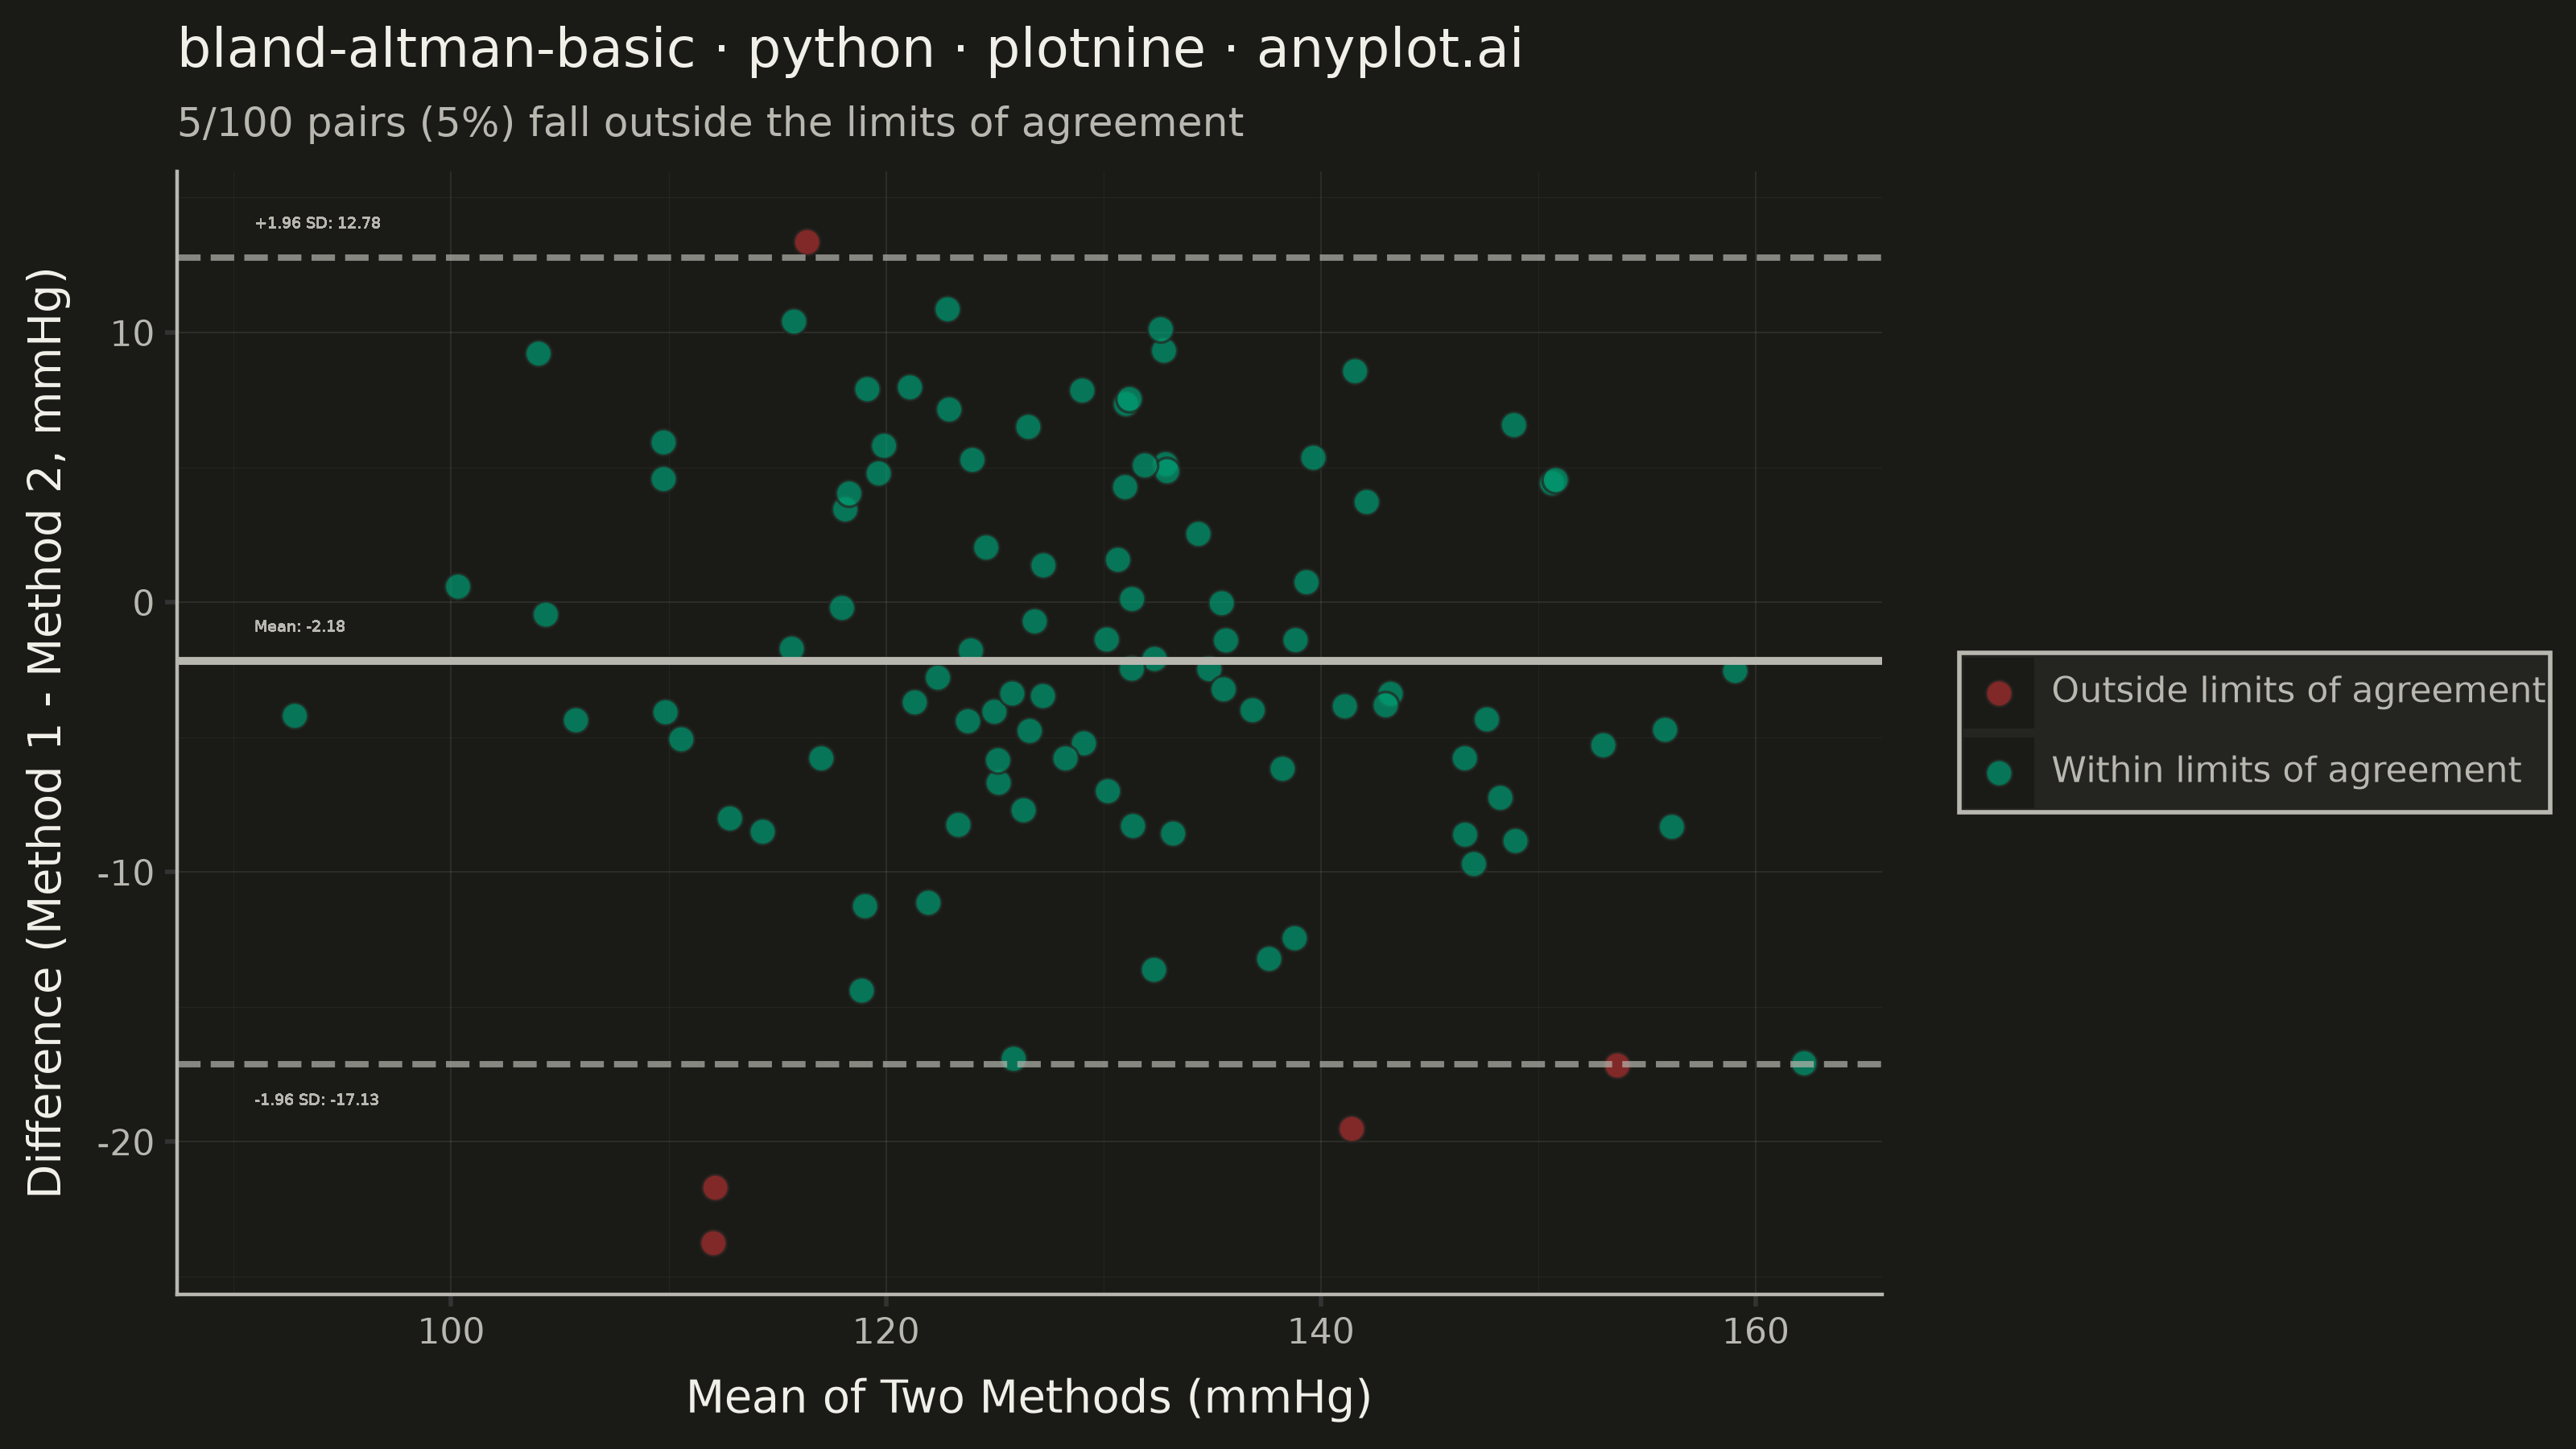
A Bland-Altman plot (also known as a difference plot or Tukey mean-difference plot) visualizes the agreement between two measurement methods by plotting the difference against the average of paired observations. It displays the mean difference (bias) as a horizontal line and limits of agreement (mean ± 1.96 SD) to assess whether the methods are interchangeable within acceptable tolerances.
""" anyplot.ai
bland-altman-basic: Bland-Altman Agreement Plot
Library: plotnine 0.15.7 | Python 3.13.14
Quality: 93/100 | Updated: 2026-08-11
"""

import os
import pathlib
import sys


script_dir = str(pathlib.Path(__file__).parent)
sys.path = [p for p in sys.path if os.path.abspath(p) != os.path.abspath(script_dir)]

import numpy as np
import pandas as pd
from plotnine import (
    aes,
    element_blank,
    element_line,
    element_rect,
    element_text,
    geom_hline,
    geom_point,
    geom_text,
    ggplot,
    ggsave,
    labs,
    scale_fill_manual,
    theme,
)


THEME = os.getenv("ANYPLOT_THEME", "light")
PAGE_BG = "#FAF8F1" if THEME == "light" else "#1A1A17"
ELEVATED_BG = "#FFFDF6" if THEME == "light" else "#242420"
INK = "#1A1A17" if THEME == "light" else "#F0EFE8"
INK_SOFT = "#4A4A44" if THEME == "light" else "#B8B7B0"
BRAND = "#009E73"
OUTLIER = "#AE3030"

# Data
np.random.seed(42)
n = 100
method1 = np.random.normal(loc=130, scale=15, size=n)
method2 = method1 + np.random.normal(loc=2, scale=8, size=n)

mean_values = (method1 + method2) / 2
differences = method1 - method2

mean_diff = np.mean(differences)
std_diff = np.std(differences, ddof=1)
upper_limit = mean_diff + 1.96 * std_diff
lower_limit = mean_diff - 1.96 * std_diff

outside_limits = (differences > upper_limit) | (differences < lower_limit)
agreement = np.where(outside_limits, "Outside limits of agreement", "Within limits of agreement")

df = pd.DataFrame({"mean": mean_values, "difference": differences, "agreement": agreement})

label_x = np.min(df["mean"]) * 0.98
n_outside = int(outside_limits.sum())
pct_outside = 100 * n_outside / n

# Plot — Imprint palette: brand green for in-range pairs, matte red (semantic
# "error / outside tolerance" anchor) for pairs outside the 95% limits of agreement
anyplot_theme = theme(
    plot_background=element_rect(fill=PAGE_BG, color=PAGE_BG),
    panel_background=element_rect(fill=PAGE_BG),
    panel_grid_major=element_line(color=INK, size=0.3, alpha=0.10),
    panel_grid_minor=element_line(color=INK, size=0.2, alpha=0.05),
    panel_border=element_blank(),
    axis_line_x=element_line(color=INK_SOFT, size=0.8),
    axis_line_y=element_line(color=INK_SOFT, size=0.8),
    axis_title=element_text(size=10, color=INK),
    axis_text=element_text(size=8, color=INK_SOFT),
    plot_title=element_text(size=12, color=INK),
    plot_subtitle=element_text(size=9, color=INK_SOFT),
    legend_background=element_rect(fill=ELEVATED_BG, color=INK_SOFT),
    legend_text=element_text(size=8, color=INK_SOFT),
    legend_title=element_blank(),
    legend_position="right",
    figure_size=(8, 4.5),
)

plot = (
    ggplot(df, aes(x="mean", y="difference"))
    + geom_point(aes(fill="agreement"), color=ELEVATED_BG, stroke=0.35, size=3.0, alpha=0.7)
    + geom_hline(yintercept=mean_diff, color=INK_SOFT, linetype="solid", size=1)
    + geom_hline(yintercept=upper_limit, color=INK_SOFT, linetype="dashed", size=0.8, alpha=0.7)
    + geom_hline(yintercept=lower_limit, color=INK_SOFT, linetype="dashed", size=0.8, alpha=0.7)
    + geom_text(
        aes(x=label_x, y=mean_diff), label=f"Mean: {mean_diff:.2f}", size=3.5, color=INK_SOFT, ha="left", nudge_y=1.3
    )
    + geom_text(
        aes(x=label_x, y=upper_limit),
        label=f"+1.96 SD: {upper_limit:.2f}",
        size=3.5,
        color=INK_SOFT,
        ha="left",
        nudge_y=1.3,
    )
    + geom_text(
        aes(x=label_x, y=lower_limit),
        label=f"-1.96 SD: {lower_limit:.2f}",
        size=3.5,
        color=INK_SOFT,
        ha="left",
        nudge_y=-1.3,
    )
    + scale_fill_manual(values={"Within limits of agreement": BRAND, "Outside limits of agreement": OUTLIER})
    + labs(
        x="Mean of Two Methods (mmHg)",
        y="Difference (Method 1 - Method 2, mmHg)",
        title="bland-altman-basic · python · plotnine · anyplot.ai",
        subtitle=f"{n_outside}/{n} pairs ({pct_outside:.0f}%) fall outside the limits of agreement",
    )
    + anyplot_theme
)

output_path = os.path.join(os.path.dirname(__file__), f"plot-{THEME}.png")
ggsave(plot, filename=output_path, dpi=400, width=8, height=4.5)
Runnable source as JSON, for any HTTP client: https://api.anyplot.ai/specs/bland-altman-basic/plotnine/code. Any spec id and library id listed in llms-full.txt fit the same URL shape; every URL below is complete and callable.
{
  "spec_id": "bland-altman-basic",
  "language": "python",
  "library": "plotnine",
  "page": "https://anyplot.ai/bland-altman-basic/python/plotnine",
  "hub": "https://anyplot.ai/bland-altman-basic",
  "code_json": "https://api.anyplot.ai/specs/bland-altman-basic/plotnine/code",
  "spec_json": "https://api.anyplot.ai/specs/bland-altman-basic",
  "render_light_png": "https://storage.googleapis.com/anyplot-images/plots/bland-altman-basic/python/plotnine/plot-light.png",
  "render_dark_png": "https://storage.googleapis.com/anyplot-images/plots/bland-altman-basic/python/plotnine/plot-dark.png",
  "quality_score": 93.0,
  "license": "MIT",
  "guide": "https://anyplot.ai/llms.txt"
}
Part of Bland-Altman Agreement Plot on anyplot.ai.