The same plot in 14 other libraries — Python: Altair, Bokeh, lets-plot, Matplotlib, Plotly, plotnine, Pygal; R: ggplot2; Julia: Makie.jl; JavaScript: Chart.js, D3.js, Apache ECharts, Highcharts, MUI X Charts. Compare all 15 side by side: Circle Packing Chart in Python, R, Julia and JavaScript.
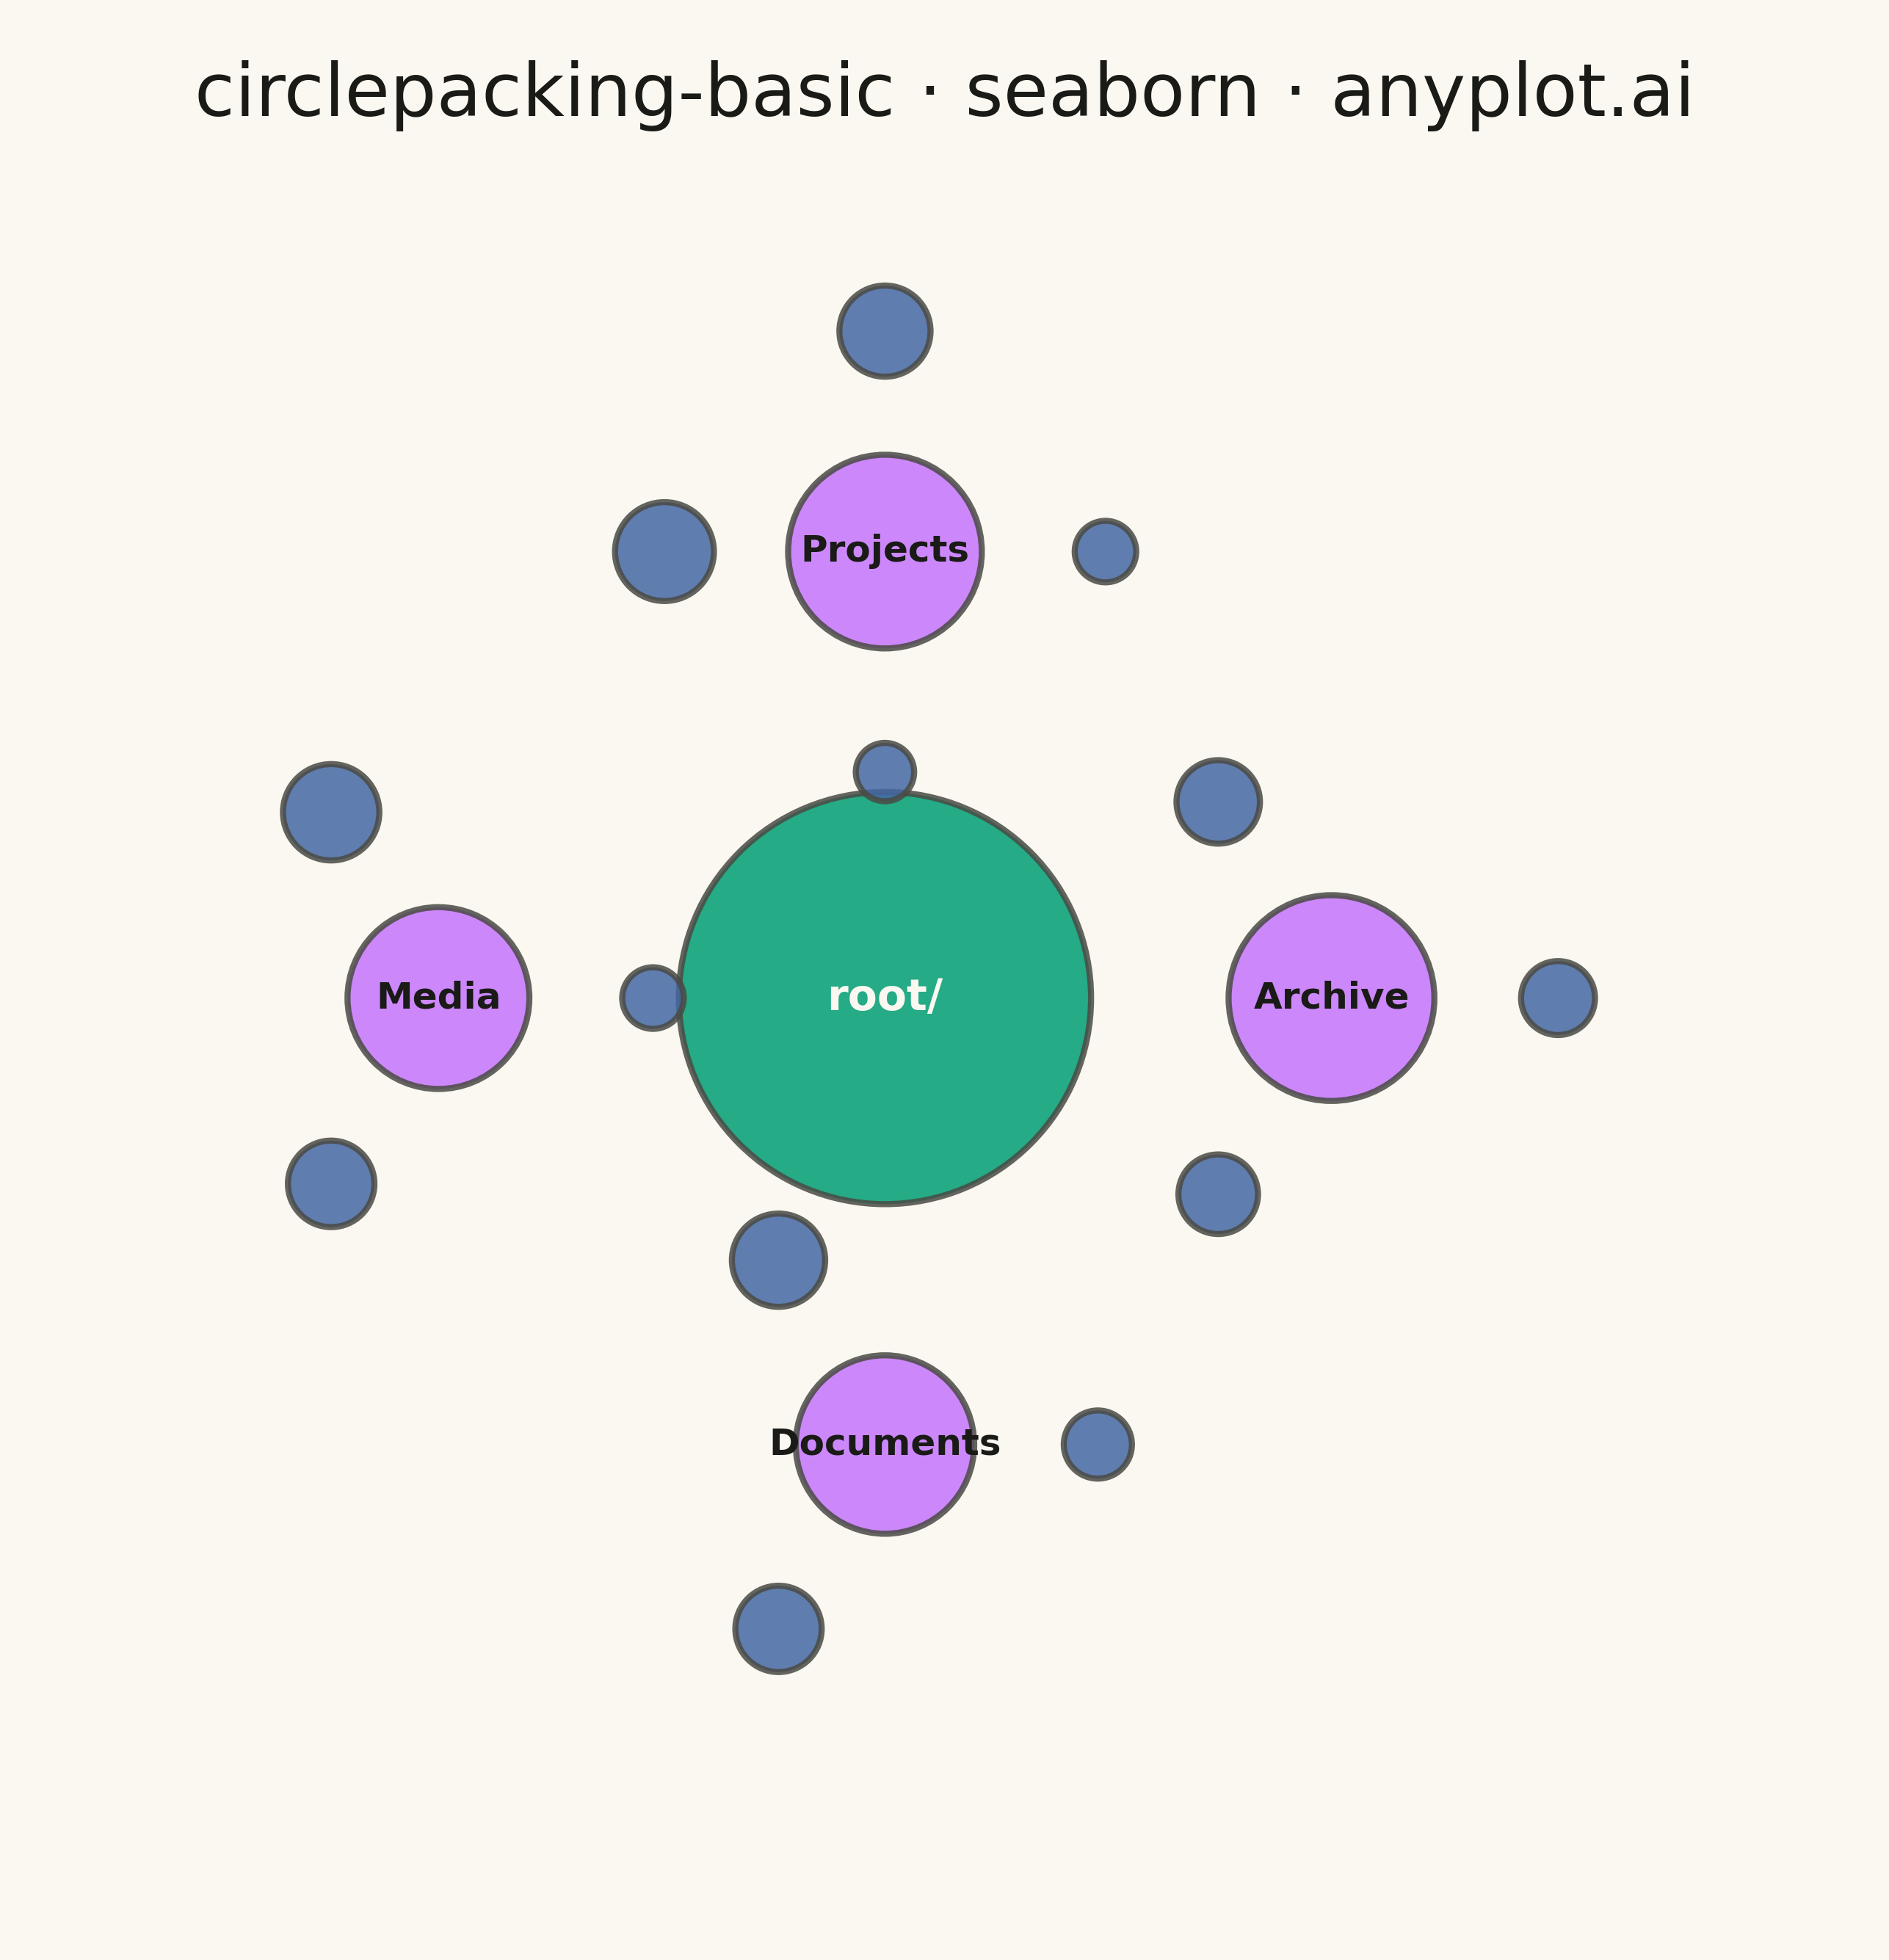
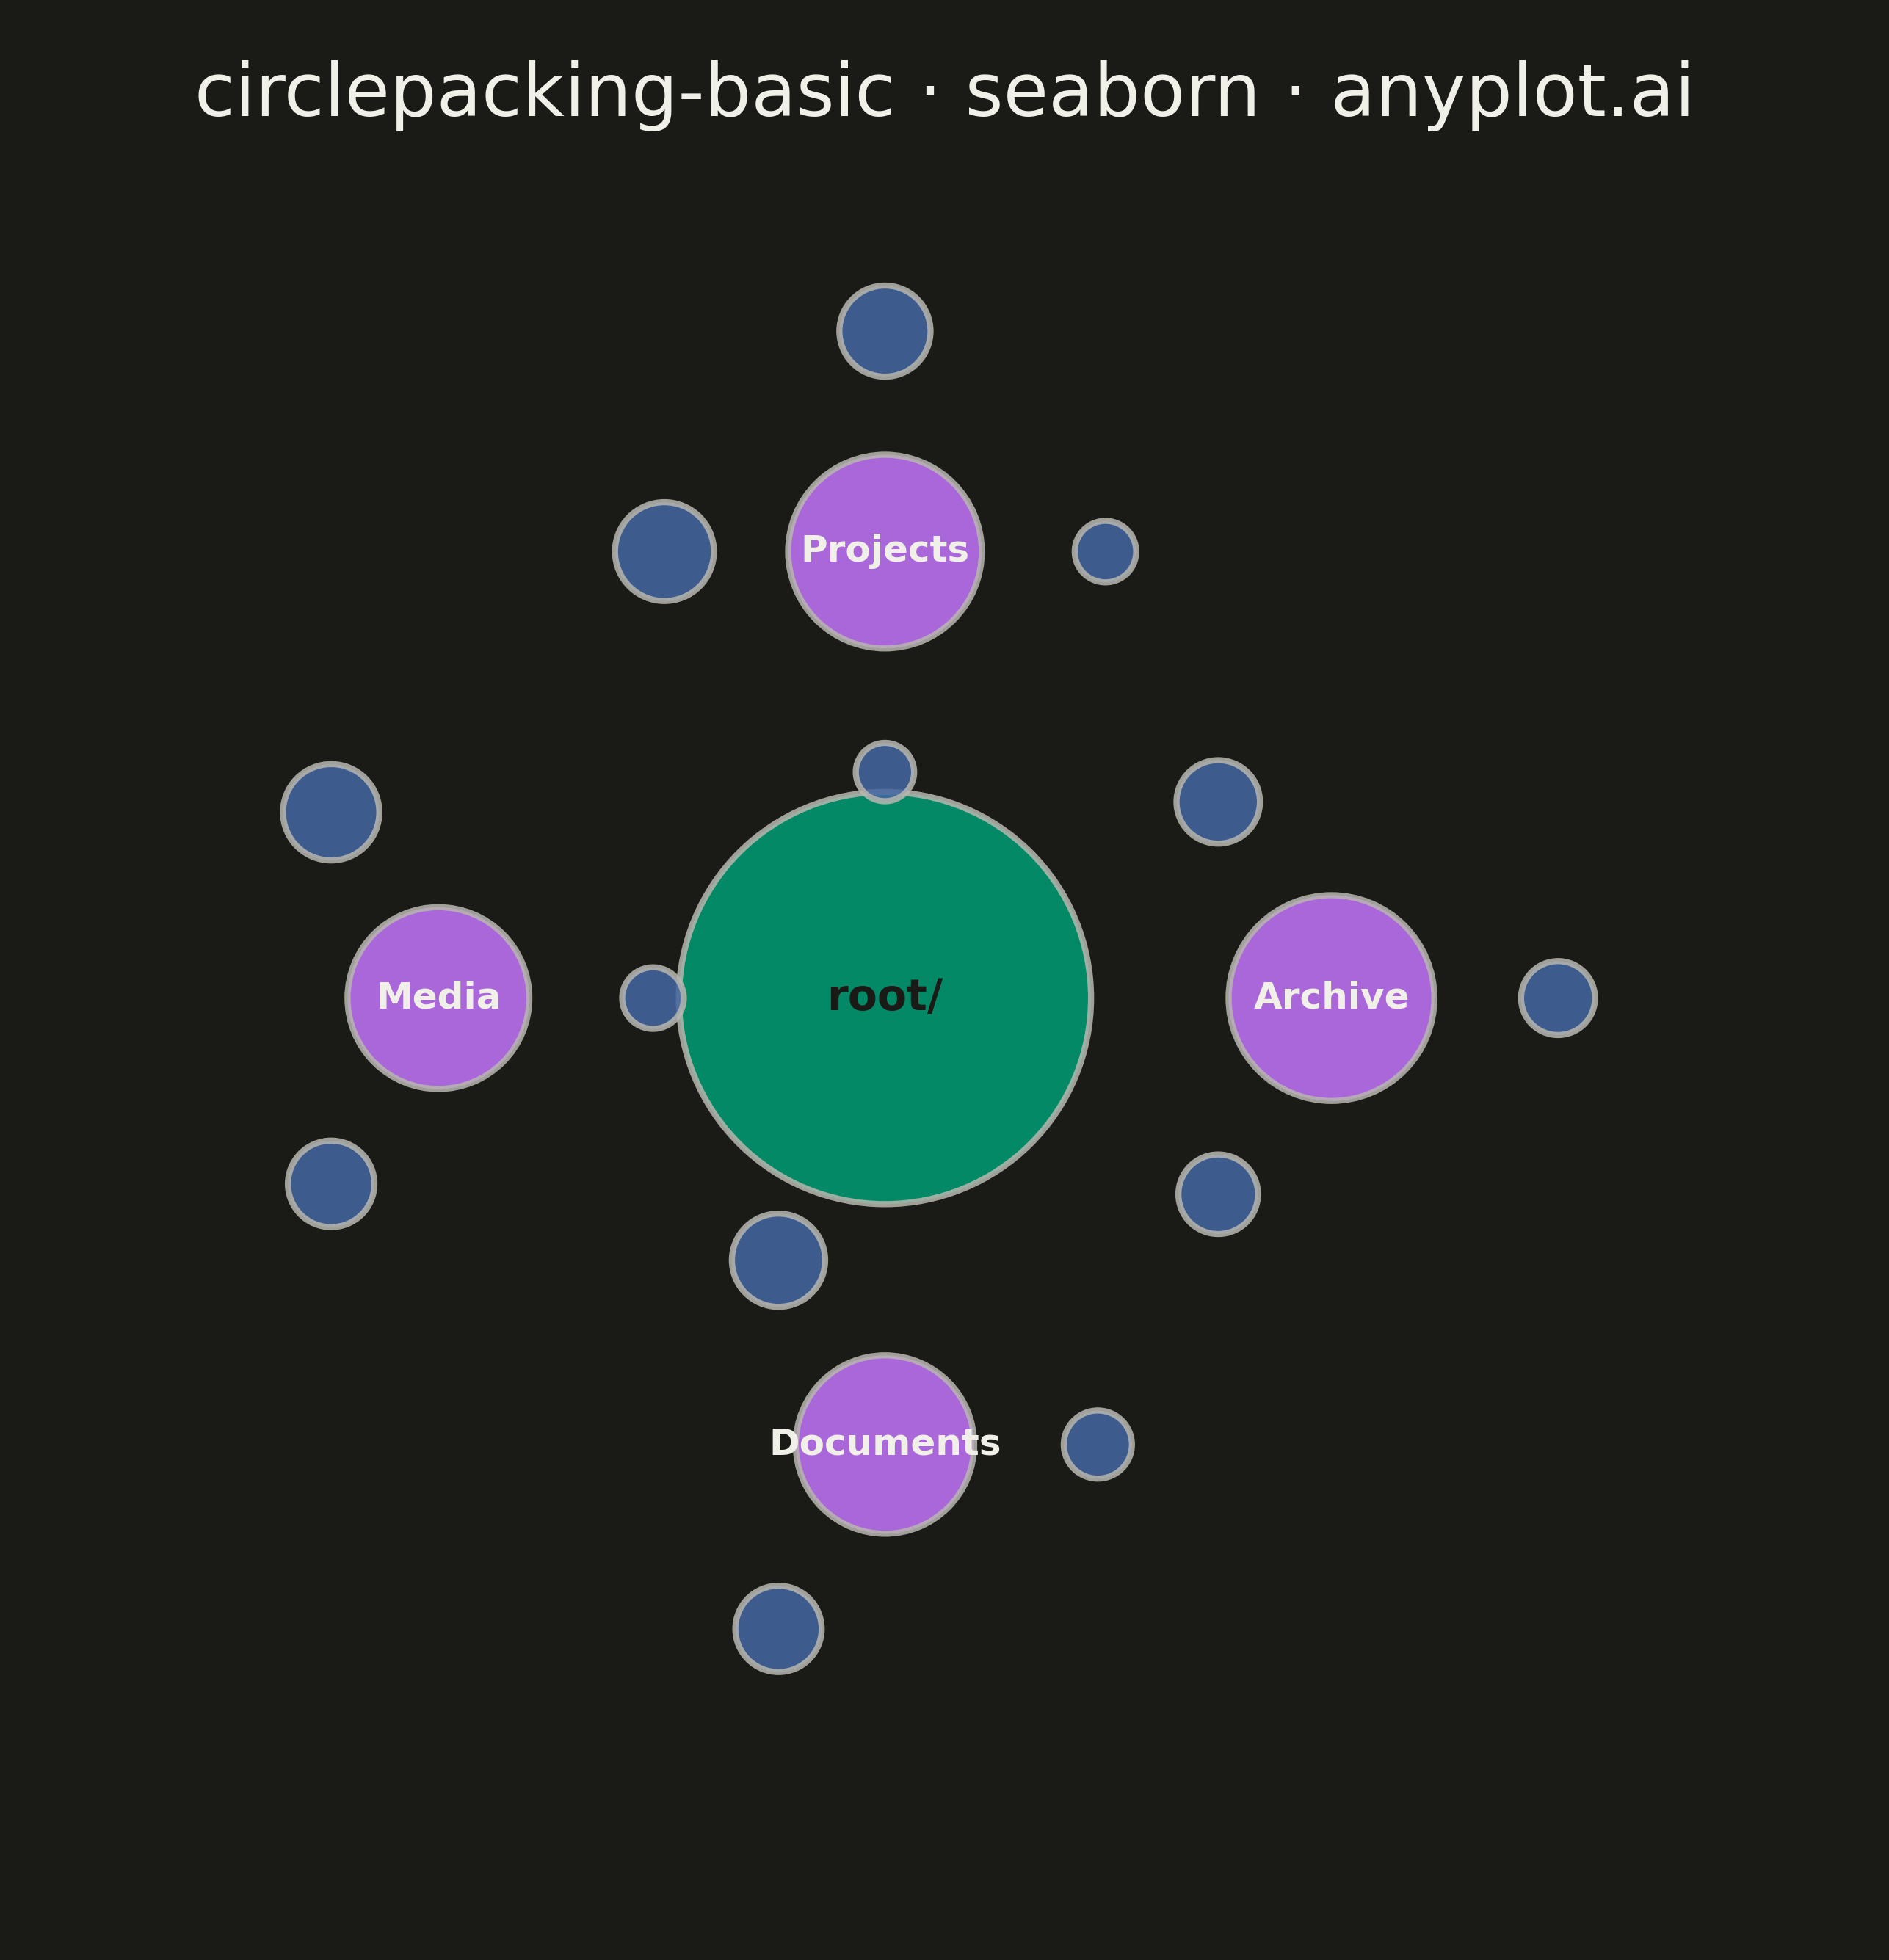
A circle packing chart displays hierarchical data as nested circles, where each circle contains smaller circles representing its children. Circle size is proportional to node value, and circles are packed efficiently without overlap. This visualization excels at revealing hierarchical structures while simultaneously showing quantitative relationships through area encoding.
""" anyplot.ai
circlepacking-basic: Circle Packing Chart
Library: seaborn 0.13.2 | Python 3.13.13
Quality: 93/100 | Created: 2026-05-11
"""

import os

import matplotlib.pyplot as plt
import numpy as np
import pandas as pd
from matplotlib.patches import Circle


THEME = os.getenv("ANYPLOT_THEME", "light")
PAGE_BG = "#FAF8F1" if THEME == "light" else "#1A1A17"
ELEVATED_BG = "#FFFDF6" if THEME == "light" else "#242420"
INK = "#1A1A17" if THEME == "light" else "#F0EFE8"
INK_SOFT = "#4A4A44" if THEME == "light" else "#B8B7B0"

IMPRINT = ["#009E73", "#C475FD", "#4467A3", "#BD8233", "#AE3030", "#2ABCCD", "#954477"]

# Data: File system hierarchy
np.random.seed(42)
nodes = []

node_id = 0
nodes.append({"id": node_id, "parent": None, "value": 100, "label": "root/", "depth": 0})
node_id += 1

folders = ["Documents", "Media", "Projects", "Archive"]
for folder in folders:
    size = np.random.uniform(15, 25)
    nodes.append({"id": node_id, "parent": 0, "value": size, "label": folder, "depth": 1})
    parent_id = node_id
    node_id += 1

    for i in range(np.random.randint(3, 5)):
        file_size = np.random.uniform(2, 6)
        nodes.append({"id": node_id, "parent": parent_id, "value": file_size, "label": f"item_{i + 1}", "depth": 2})
        node_id += 1

df = pd.DataFrame(nodes)


def pack_circles(df):
    positions = {}

    # Root at center
    root = df[df["parent"].isna()].iloc[0]
    root_radius = np.sqrt(root["value"]) * 3
    positions[root["id"]] = (0, 0, root_radius)

    # Level 1 nodes (direct children of root)
    level_1 = df[df["parent"] == root["id"]].sort_values("value", ascending=False)
    angle_step = 2 * np.pi / len(level_1)
    distance_from_root = root_radius + 35

    for idx, (_, node) in enumerate(level_1.iterrows()):
        radius = np.sqrt(node["value"]) * 3
        angle = idx * angle_step
        x = distance_from_root * np.cos(angle)
        y = distance_from_root * np.sin(angle)
        positions[node["id"]] = (x, y, radius)

    # Level 2 nodes (grandchildren)
    for _, parent_node in level_1.iterrows():
        parent_id = parent_node["id"]
        parent_x, parent_y, parent_radius = positions[parent_id]

        children = df[df["parent"] == parent_id]
        if len(children) == 0:
            continue

        angle_step = 2 * np.pi / len(children)
        distance = parent_radius + 18

        for idx, (_, child_node) in enumerate(children.iterrows()):
            radius = np.sqrt(child_node["value"]) * 3
            angle = idx * angle_step
            x = parent_x + distance * np.cos(angle)
            y = parent_y + distance * np.sin(angle)
            positions[child_node["id"]] = (x, y, radius)

    return positions


positions = pack_circles(df)

# Plot
fig, ax = plt.subplots(figsize=(16, 9), facecolor=PAGE_BG)
ax.set_facecolor(PAGE_BG)

# Draw circles
for _, row in df.iterrows():
    x, y, radius = positions[row["id"]]
    depth = row["depth"]

    color = IMPRINT[depth % len(IMPRINT)]
    circle = Circle((x, y), radius, facecolor=color, edgecolor=INK_SOFT, linewidth=2, alpha=0.85)
    ax.add_patch(circle)

    # Label for larger circles
    if radius > 8:
        text_color = PAGE_BG if depth == 0 else INK
        ax.text(
            x,
            y,
            row["label"],
            ha="center",
            va="center",
            fontsize=14 if depth == 0 else 12,
            color=text_color,
            fontweight="bold",
        )

# Set limits
all_x = [pos[0] for pos in positions.values()]
all_y = [pos[1] for pos in positions.values()]
all_r = [pos[2] for pos in positions.values()]
xlim = (min(all_x) - max(all_r) - 15, max(all_x) + max(all_r) + 15)
ylim = (min(all_y) - max(all_r) - 15, max(all_y) + max(all_r) + 15)
ax.set_xlim(xlim)
ax.set_ylim(ylim)
ax.set_aspect("equal")

# Remove axes
ax.set_xticks([])
ax.set_yticks([])
for spine in ax.spines.values():
    spine.set_visible(False)

# Title
ax.text(
    0.5,
    0.98,
    "circlepacking-basic · seaborn · anyplot.ai",
    ha="center",
    va="top",
    transform=ax.transAxes,
    fontsize=24,
    fontweight="medium",
    color=INK,
)

plt.tight_layout()
plt.savefig(f"plot-{THEME}.png", dpi=300, bbox_inches="tight", facecolor=PAGE_BG)
plt.close()
Runnable source as JSON, for any HTTP client: https://api.anyplot.ai/specs/circlepacking-basic/seaborn/code. Any spec id and library id listed in llms-full.txt fit the same URL shape; every URL below is complete and callable.
{
  "spec_id": "circlepacking-basic",
  "language": "python",
  "library": "seaborn",
  "page": "https://anyplot.ai/circlepacking-basic/python/seaborn",
  "hub": "https://anyplot.ai/circlepacking-basic",
  "code_json": "https://api.anyplot.ai/specs/circlepacking-basic/seaborn/code",
  "spec_json": "https://api.anyplot.ai/specs/circlepacking-basic",
  "render_light_png": "https://storage.googleapis.com/anyplot-images/plots/circlepacking-basic/python/seaborn/plot-light.png",
  "render_dark_png": "https://storage.googleapis.com/anyplot-images/plots/circlepacking-basic/python/seaborn/plot-dark.png",
  "quality_score": 93.0,
  "license": "MIT",
  "guide": "https://anyplot.ai/llms.txt"
}
Part of Circle Packing Chart on anyplot.ai.