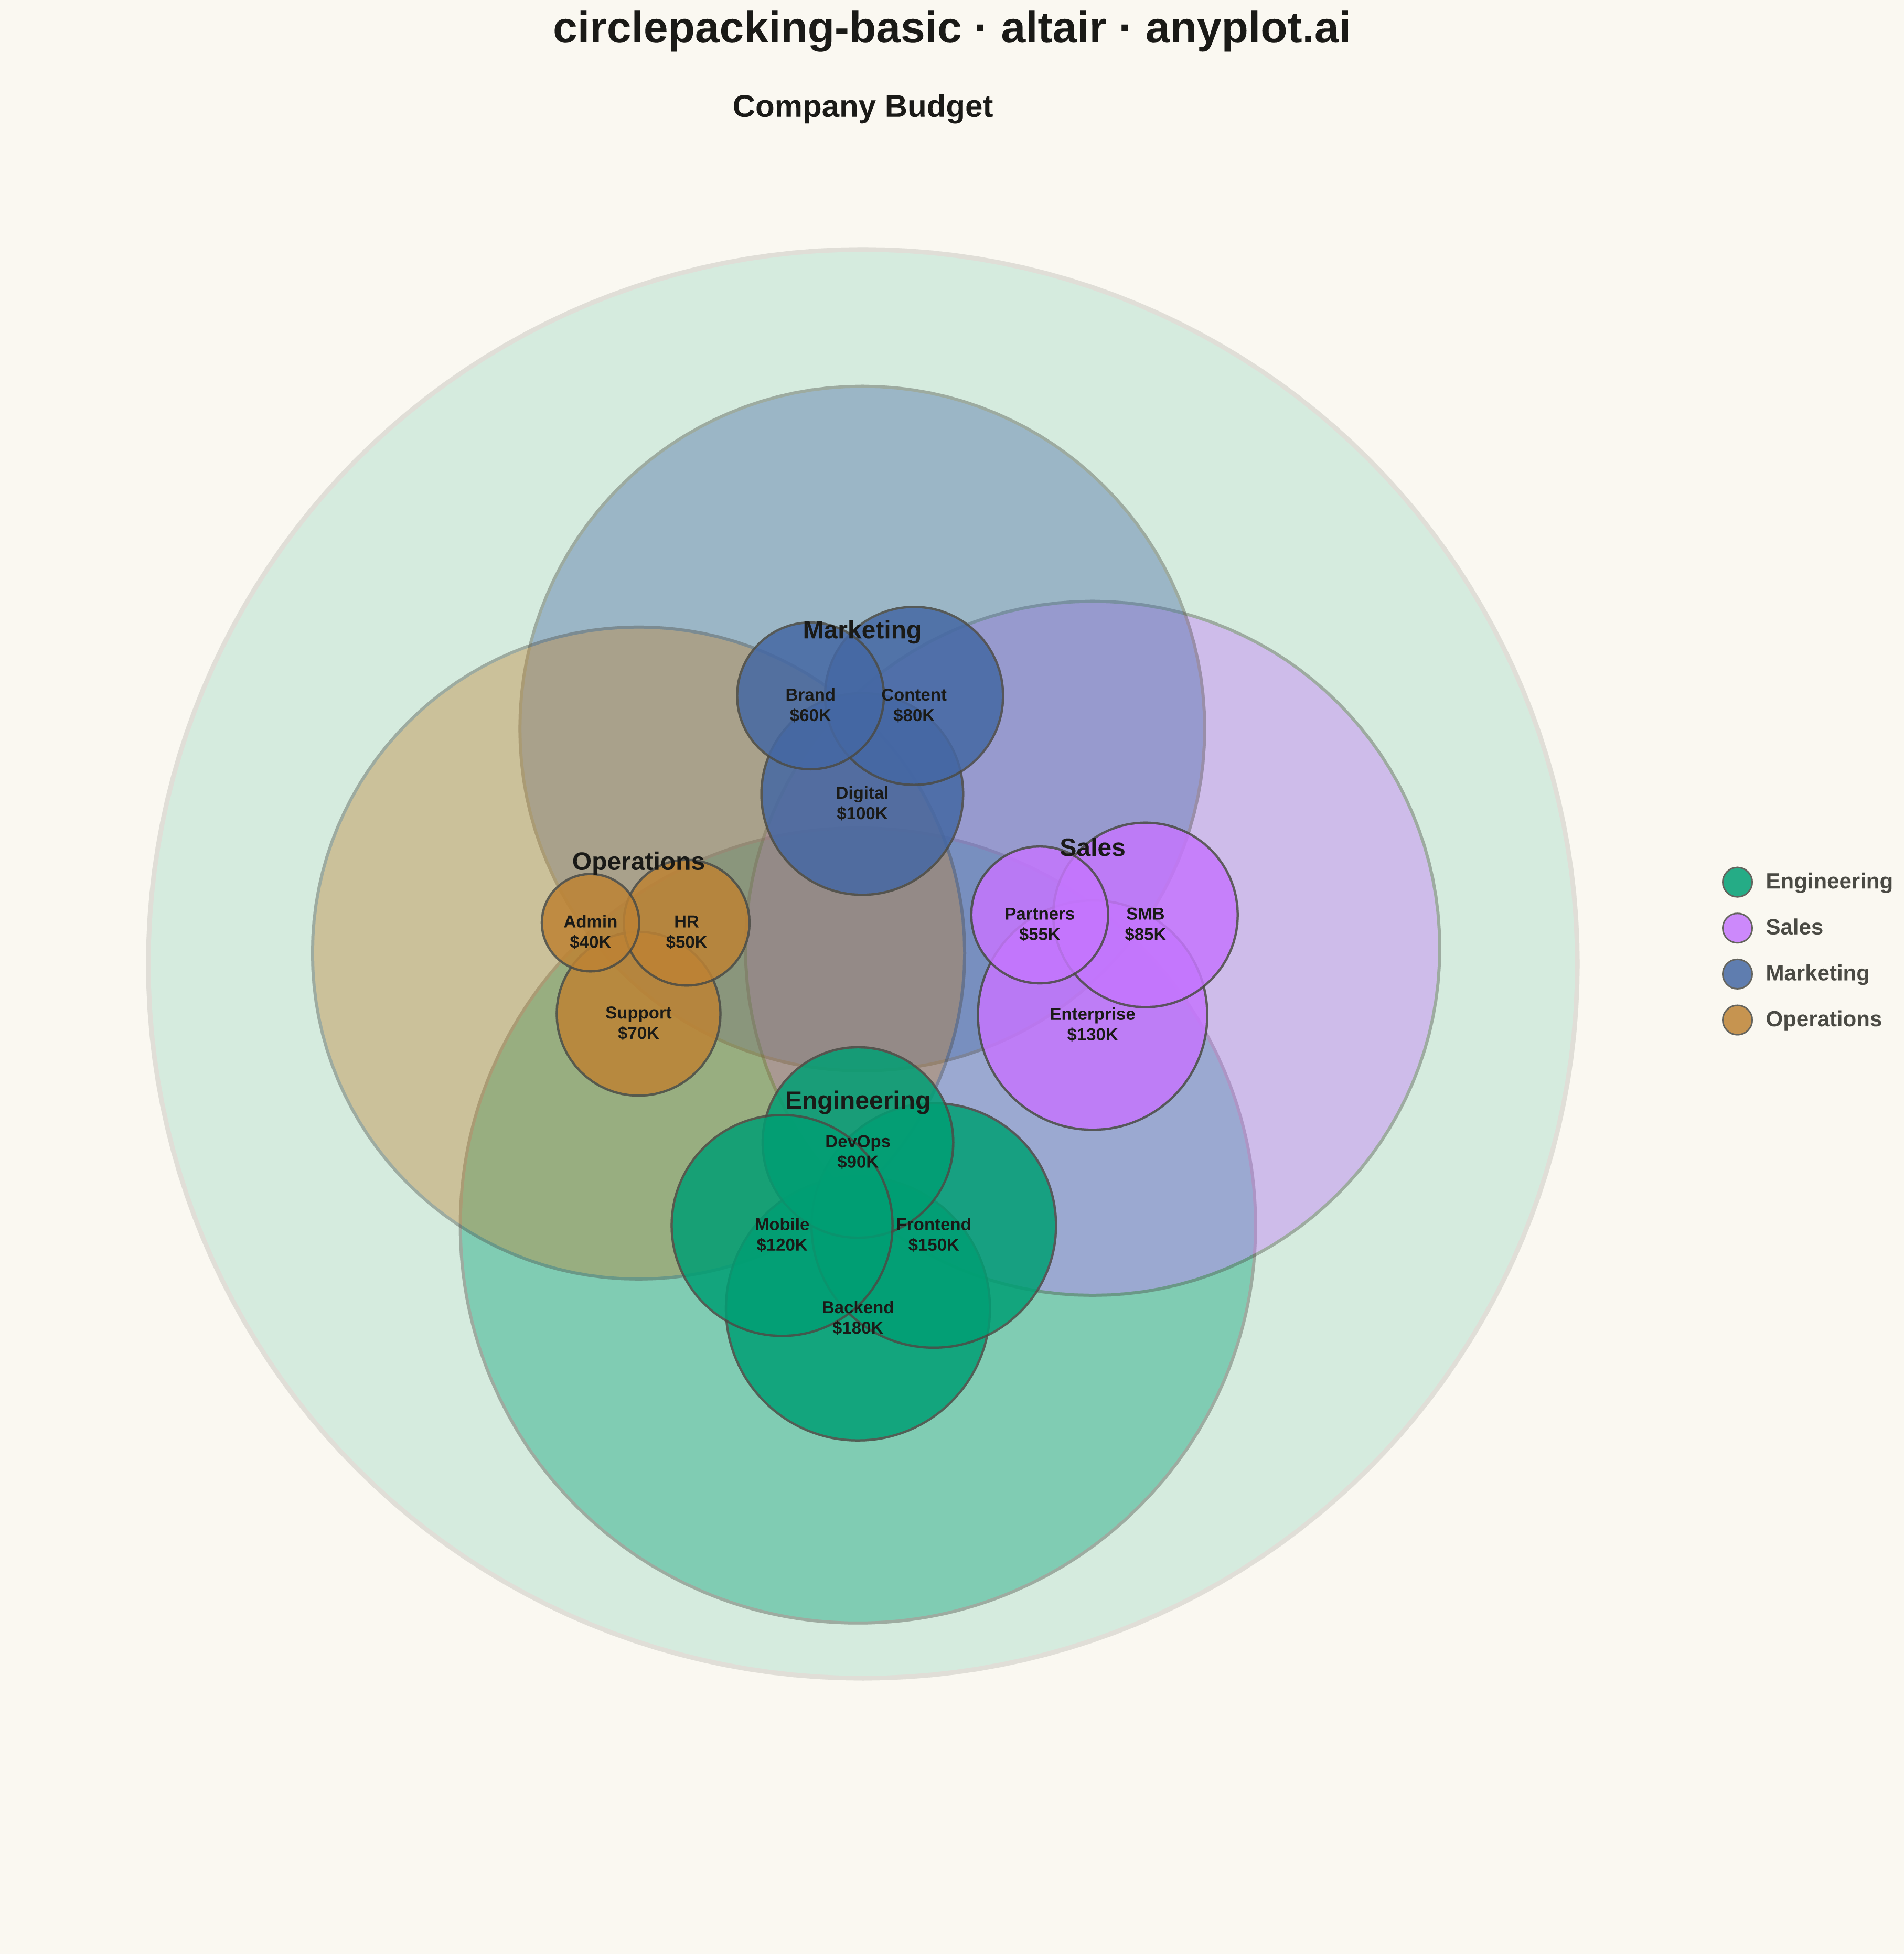
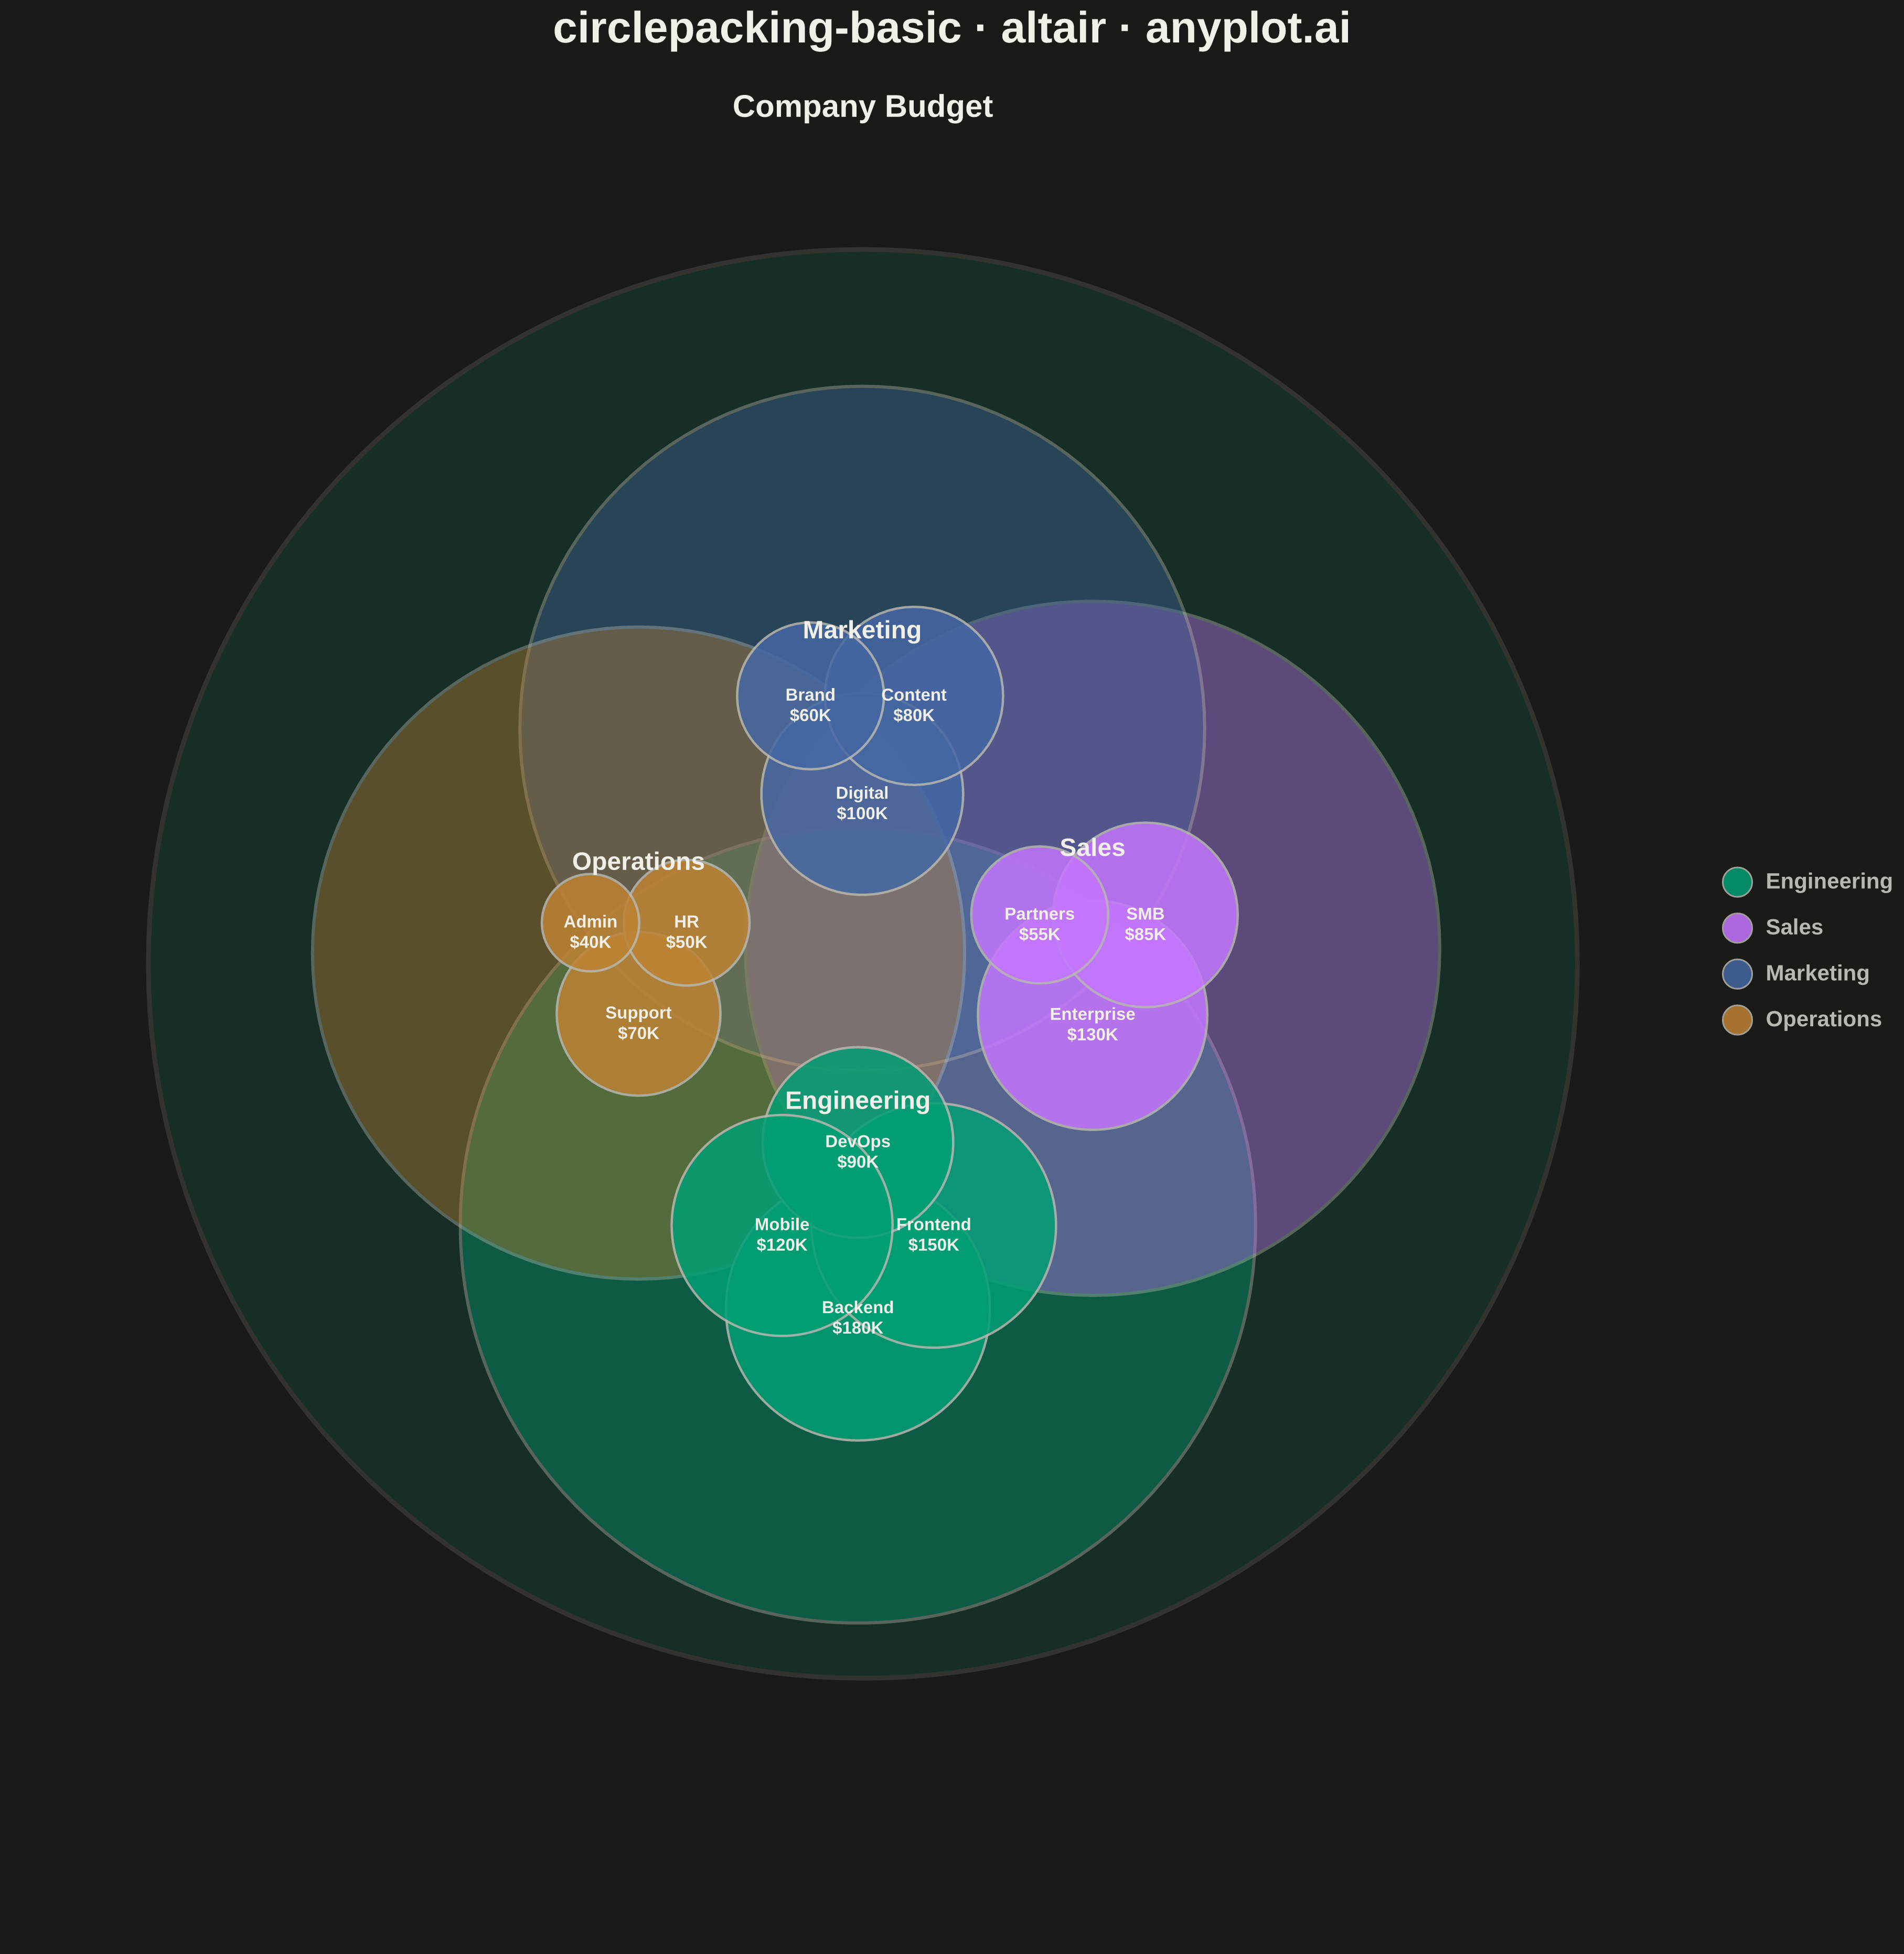
A circle packing chart displays hierarchical data as nested circles, where each circle contains smaller circles representing its children. Circle size is proportional to node value, and circles are packed efficiently without overlap. This visualization excels at revealing hierarchical structures while simultaneously showing quantitative relationships through area encoding.
""" anyplot.ai
circlepacking-basic: Circle Packing Chart
Library: altair 6.1.0 | Python 3.13.13
Quality: 95/100 | Updated: 2026-05-11
"""

import os
import sys


# Work around the naming conflict (local file named altair.py shadows the package)
# Temporarily remove current directory from path
cwd = os.getcwd()
if cwd in sys.path:
    sys.path.remove(cwd)
current_dir = os.path.dirname(os.path.abspath(__file__))
if current_dir in sys.path:
    sys.path.remove(current_dir)

import altair as alt
import numpy as np
import pandas as pd


# Theme tokens
THEME = os.getenv("ANYPLOT_THEME", "light")
PAGE_BG = "#FAF8F1" if THEME == "light" else "#1A1A17"
ELEVATED_BG = "#FFFDF6" if THEME == "light" else "#242420"
INK = "#1A1A17" if THEME == "light" else "#F0EFE8"
INK_SOFT = "#4A4A44" if THEME == "light" else "#B8B7B0"

# Data - Company budget allocation by department and team (values in $K)
np.random.seed(42)

# Leaf nodes (teams) with their budgets
teams = [
    # Engineering Department
    {"id": "eng-backend", "parent": "Engineering", "label": "Backend", "value": 180},
    {"id": "eng-frontend", "parent": "Engineering", "label": "Frontend", "value": 150},
    {"id": "eng-devops", "parent": "Engineering", "label": "DevOps", "value": 90},
    {"id": "eng-mobile", "parent": "Engineering", "label": "Mobile", "value": 120},
    # Marketing Department
    {"id": "mkt-digital", "parent": "Marketing", "label": "Digital", "value": 100},
    {"id": "mkt-content", "parent": "Marketing", "label": "Content", "value": 80},
    {"id": "mkt-brand", "parent": "Marketing", "label": "Brand", "value": 60},
    # Operations Department
    {"id": "ops-support", "parent": "Operations", "label": "Support", "value": 70},
    {"id": "ops-hr", "parent": "Operations", "label": "HR", "value": 50},
    {"id": "ops-admin", "parent": "Operations", "label": "Admin", "value": 40},
    # Sales Department
    {"id": "sales-enterprise", "parent": "Sales", "label": "Enterprise", "value": 130},
    {"id": "sales-smb", "parent": "Sales", "label": "SMB", "value": 85},
    {"id": "sales-partners", "parent": "Sales", "label": "Partners", "value": 55},
]

# Calculate department totals
dept_totals = {}
for t in teams:
    dept_totals[t["parent"]] = dept_totals.get(t["parent"], 0) + t["value"]

# Okabe-Ito palette for departments (theme-independent data colors)
okabe_ito = ["#009E73", "#C475FD", "#4467A3", "#BD8233", "#AE3030", "#2ABCCD"]
dept_colors = {
    "Engineering": okabe_ito[0],  # bluish green
    "Sales": okabe_ito[1],  # vermillion
    "Marketing": okabe_ito[2],  # blue
    "Operations": okabe_ito[3],  # reddish purple
}

# Scale value to radius (sqrt for area-proportional sizing)
max_value = max(t["value"] for t in teams)
min_radius = 25
max_radius = 55


def get_team_radius(value):
    """Calculate radius from value using sqrt for area-proportional sizing."""
    return min_radius + (max_radius - min_radius) * np.sqrt(value / max_value)


def pack_circles_in_parent(circles, parent_center, parent_radius):
    """
    Pack child circles inside a parent circle using force-directed placement.
    Returns list of (x, y) positions for each circle.
    """
    n = len(circles)
    if n == 0:
        return []

    radii = [c["radius"] for c in circles]

    # Start with circular arrangement
    positions = []
    if n == 1:
        positions = [(parent_center[0], parent_center[1])]
    else:
        arrangement_r = parent_radius * 0.4
        for i in range(n):
            angle = 2 * np.pi * i / n - np.pi / 2
            x = parent_center[0] + arrangement_r * np.cos(angle)
            y = parent_center[1] + arrangement_r * np.sin(angle)
            positions.append((x, y))

    # Force-directed relaxation to remove overlaps
    for _ in range(100):
        forces = [(0.0, 0.0) for _ in range(n)]

        # Repulsion between circles
        for i in range(n):
            for j in range(i + 1, n):
                dx = positions[i][0] - positions[j][0]
                dy = positions[i][1] - positions[j][1]
                dist = np.sqrt(dx * dx + dy * dy)
                min_dist = radii[i] + radii[j] + 3  # 3px gap

                if dist < min_dist and dist > 0:
                    overlap = min_dist - dist
                    fx = (dx / dist) * overlap * 0.5
                    fy = (dy / dist) * overlap * 0.5
                    forces[i] = (forces[i][0] + fx, forces[i][1] + fy)
                    forces[j] = (forces[j][0] - fx, forces[j][1] - fy)

        # Keep circles inside parent
        for i in range(n):
            dx = positions[i][0] - parent_center[0]
            dy = positions[i][1] - parent_center[1]
            dist_from_center = np.sqrt(dx * dx + dy * dy)
            max_dist = parent_radius - radii[i] - 5

            if dist_from_center > max_dist and dist_from_center > 0:
                scale = max_dist / dist_from_center
                positions[i] = (parent_center[0] + dx * scale, parent_center[1] + dy * scale)

        # Apply forces
        positions = [(positions[i][0] + forces[i][0], positions[i][1] + forces[i][1]) for i in range(n)]

    return positions


# Build circle packing structure
circles_data = []

# Calculate department radii based on team radii
dept_radii = {}
for dept in dept_totals.keys():
    dept_teams = [t for t in teams if t["parent"] == dept]
    team_radii = [get_team_radius(t["value"]) for t in dept_teams]
    # Department radius should contain all teams with padding
    total_team_area = sum(r * r * np.pi for r in team_radii)
    dept_radii[dept] = np.sqrt(total_team_area / np.pi) * 1.8 + 20

# Sort departments by radius (largest first for better packing)
sorted_depts = sorted(dept_radii.keys(), key=lambda d: dept_radii[d], reverse=True)

# Calculate root circle radius
total_dept_area = sum(r * r * np.pi for r in dept_radii.values())
root_radius = np.sqrt(total_dept_area / np.pi) * 1.6 + 30

# Position departments inside root circle
dept_circles = [{"name": dept, "radius": dept_radii[dept]} for dept in sorted_depts]
dept_positions = pack_circles_in_parent(dept_circles, (0, 0), root_radius)

# Add root circle (Company)
company_total = sum(t["value"] for t in teams)
circles_data.append(
    {
        "x": 0,
        "y": 0,
        "radius": root_radius,
        "label": "Company",
        "value": company_total,
        "depth": 0,
        "color": okabe_ito[0],  # Use brand color for root
        "department": "Company",
    }
)

# Add departments and their teams
for i, dept in enumerate(sorted_depts):
    dept_x, dept_y = dept_positions[i]
    dept_r = dept_radii[dept]
    dept_value = dept_totals[dept]

    # Add department circle
    circles_data.append(
        {
            "x": dept_x,
            "y": dept_y,
            "radius": dept_r,
            "label": dept,
            "value": dept_value,
            "depth": 1,
            "color": dept_colors[dept],
            "department": dept,
        }
    )

    # Position teams inside department
    dept_teams = [t for t in teams if t["parent"] == dept]
    team_circles = [{"name": t["label"], "radius": get_team_radius(t["value"])} for t in dept_teams]
    team_positions = pack_circles_in_parent(team_circles, (dept_x, dept_y), dept_r)

    for j, t in enumerate(dept_teams):
        tx, ty = team_positions[j]
        team_r = get_team_radius(t["value"])
        circles_data.append(
            {
                "x": tx,
                "y": ty,
                "radius": team_r,
                "label": t["label"],
                "value": t["value"],
                "depth": 2,
                "color": dept_colors[dept],
                "department": dept,
            }
        )

# Create DataFrame
df = pd.DataFrame(circles_data)

# Create display text
df["display_value"] = df["value"].apply(lambda v: f"${v}K")
df["display_text"] = df.apply(
    lambda r: f"{r['label']}\n{r['display_value']}" if r["depth"] == 2 else r["label"], axis=1
)

# Separate by depth for layered rendering
df_root = df[df["depth"] == 0].copy()
df_depts = df[df["depth"] == 1].copy()
df_teams = df[df["depth"] == 2].copy()

# Calculate dynamic scales based on actual data
x_min, x_max = df["x"].min() - df["radius"].max(), df["x"].max() + df["radius"].max()
y_min, y_max = df["y"].min() - df["radius"].max(), df["y"].max() + df["radius"].max()

# Add padding for legend on the right
padding = 50
x_domain = [x_min - padding, x_max + padding + 180]  # Extra space for legend
y_domain = [y_min - padding, y_max + padding]

# Size scale (radius squared for area encoding)
size_domain = [df["radius"].min(), df["radius"].max()]
size_range = [df["radius"].min() ** 2 * 2.5, df["radius"].max() ** 2 * 2.5]

# Shared scales
x_scale = alt.Scale(domain=list(x_domain))
y_scale = alt.Scale(domain=list(y_domain))
size_scale = alt.Scale(domain=size_domain, range=size_range)

# Root circle layer (outermost - Company)
root_layer = (
    alt.Chart(df_root)
    .mark_circle(opacity=0.15, stroke=INK_SOFT, strokeWidth=3)
    .encode(
        x=alt.X("x:Q", axis=None, scale=x_scale),
        y=alt.Y("y:Q", axis=None, scale=y_scale),
        size=alt.Size("radius:Q", scale=size_scale, legend=None),
        color=alt.value(okabe_ito[0]),
        tooltip=[alt.Tooltip("label:N", title="Name"), alt.Tooltip("display_value:N", title="Budget")],
    )
)

# Root label
root_label = (
    alt.Chart(df_root)
    .mark_text(color=INK, fontWeight="bold", fontSize=20, dy=-root_radius + 30)
    .encode(
        x=alt.X("x:Q", axis=None, scale=x_scale),
        y=alt.Y("y:Q", axis=None, scale=y_scale),
        text=alt.value("Company Budget"),
    )
)

# Department circles layer
dept_layer = (
    alt.Chart(df_depts)
    .mark_circle(opacity=0.4, stroke=INK_SOFT, strokeWidth=2)
    .encode(
        x=alt.X("x:Q", axis=None, scale=x_scale),
        y=alt.Y("y:Q", axis=None, scale=y_scale),
        size=alt.Size("radius:Q", scale=size_scale, legend=None),
        color=alt.Color("color:N", scale=None),
        tooltip=[alt.Tooltip("label:N", title="Department"), alt.Tooltip("display_value:N", title="Budget")],
    )
)

# Team circles layer
team_layer = (
    alt.Chart(df_teams)
    .mark_circle(opacity=0.85, stroke=INK_SOFT, strokeWidth=1.5)
    .encode(
        x=alt.X("x:Q", axis=None, scale=x_scale),
        y=alt.Y("y:Q", axis=None, scale=y_scale),
        size=alt.Size("radius:Q", scale=size_scale, legend=None),
        color=alt.Color("color:N", scale=None),
        tooltip=[
            alt.Tooltip("label:N", title="Team"),
            alt.Tooltip("department:N", title="Department"),
            alt.Tooltip("display_value:N", title="Budget"),
        ],
    )
)

# Department labels - positioned at center-top of each department circle
df_depts_labels = df_depts.copy()
df_depts_labels["label_y"] = df_depts_labels["y"] + df_depts_labels["radius"] * 0.6

dept_label_layer = (
    alt.Chart(df_depts_labels)
    .mark_text(color=INK, fontWeight="bold", fontSize=16)
    .encode(x=alt.X("x:Q", axis=None, scale=x_scale), y=alt.Y("label_y:Q", axis=None, scale=y_scale), text="label:N")
)

# Team labels
team_label_layer = (
    alt.Chart(df_teams)
    .mark_text(color=INK, fontWeight="bold", fontSize=11, lineBreak="\n")
    .encode(x=alt.X("x:Q", axis=None, scale=x_scale), y=alt.Y("y:Q", axis=None, scale=y_scale), text="display_text:N")
)

# Legend positioned inside the visible area (right side)
legend_x = x_max + 60
legend_y_start = 80
legend_spacing = 45

legend_df = pd.DataFrame(
    [
        {"department": dept, "color": dept_colors[dept], "x": legend_x, "y": legend_y_start - i * legend_spacing}
        for i, dept in enumerate(["Engineering", "Sales", "Marketing", "Operations"])
    ]
)

# Legend circles
legend_circles = (
    alt.Chart(legend_df)
    .mark_circle(size=350, opacity=0.85, stroke=INK_SOFT, strokeWidth=1)
    .encode(
        x=alt.X("x:Q", axis=None, scale=x_scale),
        y=alt.Y("y:Q", axis=None, scale=y_scale),
        color=alt.Color("color:N", scale=None),
    )
)

# Legend text
legend_text = (
    alt.Chart(legend_df)
    .mark_text(align="left", dx=18, fontSize=14, fontWeight="bold", color=INK_SOFT)
    .encode(x=alt.X("x:Q", axis=None, scale=x_scale), y=alt.Y("y:Q", axis=None, scale=y_scale), text="department:N")
)

# Combine all layers
chart = (
    alt.layer(
        root_layer, root_label, dept_layer, team_layer, dept_label_layer, team_label_layer, legend_circles, legend_text
    )
    .properties(
        width=1200,
        height=1200,
        background=PAGE_BG,
        title=alt.Title(
            "circlepacking-basic · altair · anyplot.ai", fontSize=28, fontWeight="bold", anchor="middle", color=INK
        ),
    )
    .configure_view(strokeWidth=0, fill=PAGE_BG)
)

# Save outputs (3600x3600 px with scale_factor=3.0)
script_dir = os.path.dirname(os.path.abspath(__file__))
chart.save(os.path.join(script_dir, f"plot-{THEME}.png"), scale_factor=3.0)
chart.save(os.path.join(script_dir, f"plot-{THEME}.html"))
Runnable source as JSON, for any HTTP client: https://api.anyplot.ai/specs/circlepacking-basic/altair/code. Any spec id and library id listed in llms-full.txt fit the same URL shape; every URL below is complete and callable.
{
  "spec_id": "circlepacking-basic",
  "language": "python",
  "library": "altair",
  "page": "https://anyplot.ai/circlepacking-basic/python/altair",
  "hub": "https://anyplot.ai/circlepacking-basic",
  "code_json": "https://api.anyplot.ai/specs/circlepacking-basic/altair/code",
  "spec_json": "https://api.anyplot.ai/specs/circlepacking-basic",
  "render_light_png": "https://storage.googleapis.com/anyplot-images/plots/circlepacking-basic/python/altair/plot-light.png",
  "render_dark_png": "https://storage.googleapis.com/anyplot-images/plots/circlepacking-basic/python/altair/plot-dark.png",
  "interactive_light_html": "https://storage.googleapis.com/anyplot-images/plots/circlepacking-basic/python/altair/plot-light.html",
  "interactive_dark_html": "https://storage.googleapis.com/anyplot-images/plots/circlepacking-basic/python/altair/plot-dark.html",
  "quality_score": 95.0,
  "license": "MIT",
  "guide": "https://anyplot.ai/llms.txt"
}
Part of Circle Packing Chart on anyplot.ai.