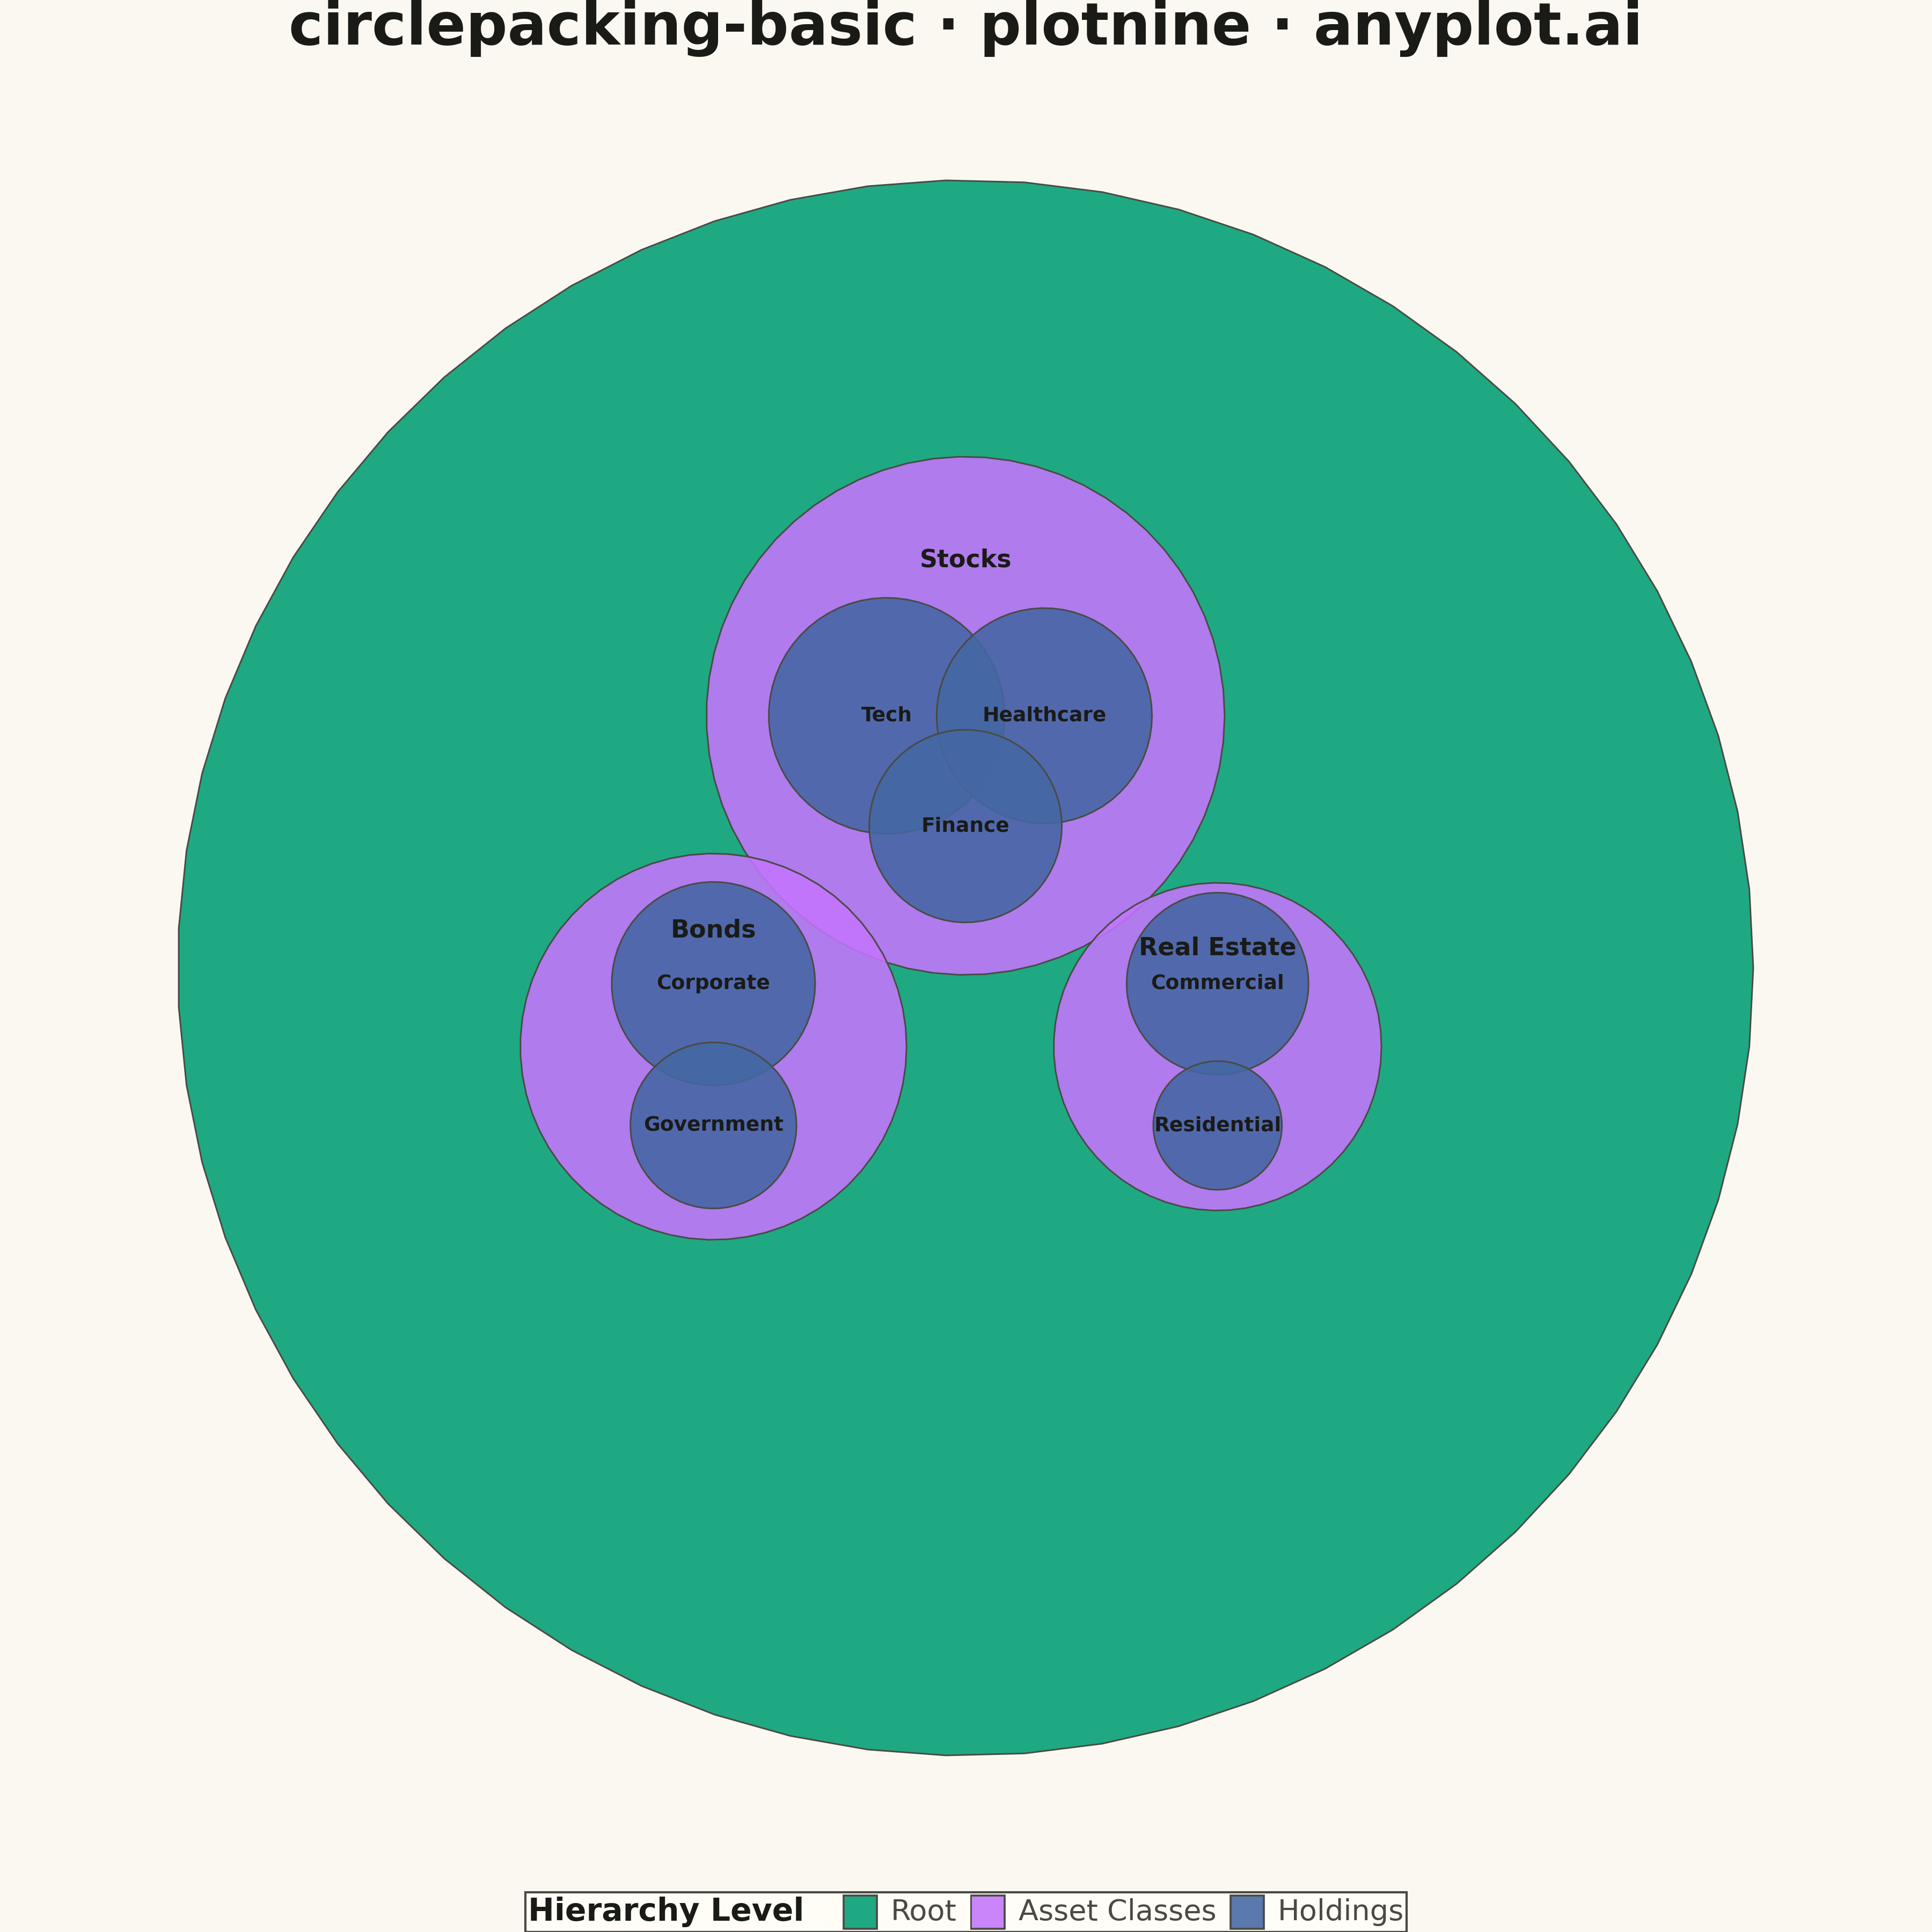
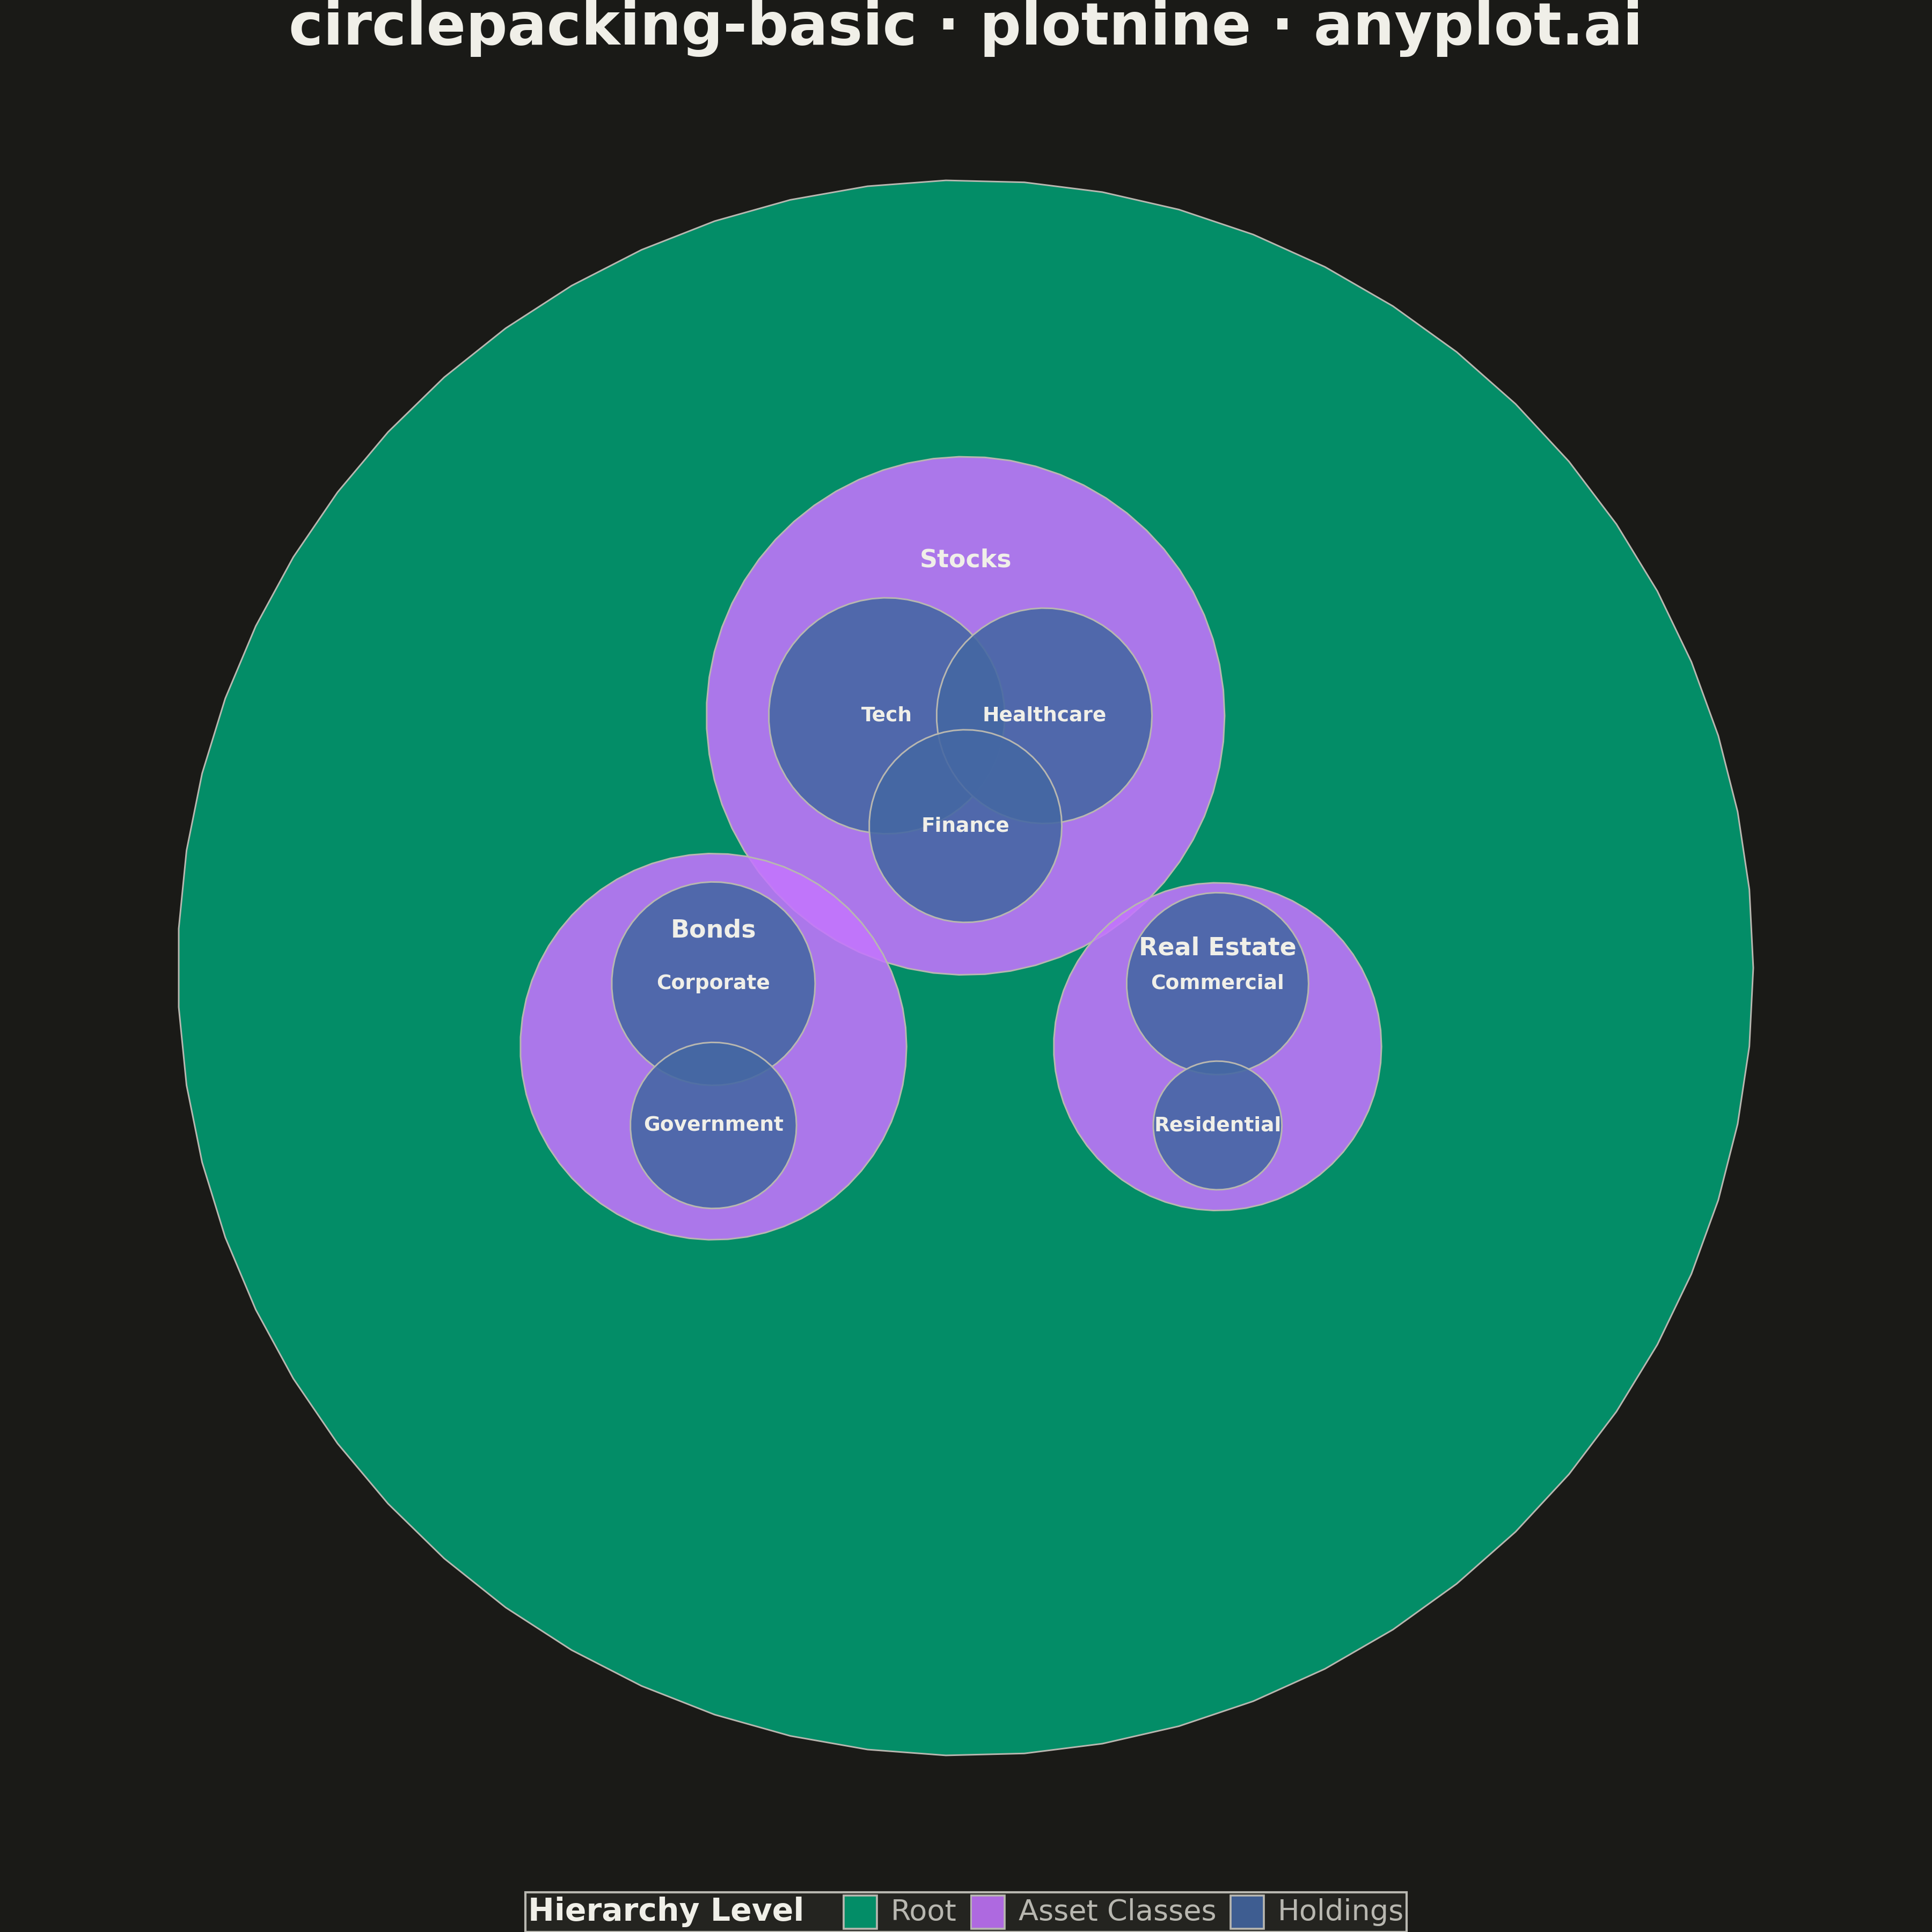
A circle packing chart displays hierarchical data as nested circles, where each circle contains smaller circles representing its children. Circle size is proportional to node value, and circles are packed efficiently without overlap. This visualization excels at revealing hierarchical structures while simultaneously showing quantitative relationships through area encoding.
""" anyplot.ai
circlepacking-basic: Circle Packing Chart
Library: plotnine 0.15.4 | Python 3.13.13
Quality: 92/100 | Updated: 2026-05-11
"""

import os

import numpy as np
import pandas as pd
from plotnine import (
    aes,
    coord_fixed,
    element_rect,
    element_text,
    geom_polygon,
    geom_text,
    ggplot,
    guide_legend,
    guides,
    labs,
    scale_fill_manual,
    scale_size_identity,
    theme,
    theme_void,
)


np.random.seed(42)

# Theme tokens
THEME = os.getenv("ANYPLOT_THEME", "light")
PAGE_BG = "#FAF8F1" if THEME == "light" else "#1A1A17"
ELEVATED_BG = "#FFFDF6" if THEME == "light" else "#242420"
INK = "#1A1A17" if THEME == "light" else "#F0EFE8"
INK_SOFT = "#4A4A44" if THEME == "light" else "#B8B7B0"

# Okabe-Ito palette - for hierarchy levels
IMPRINT = ["#009E73", "#C475FD", "#4467A3"]

# Investment portfolio hierarchy
# Format: (id, label, parent_id, value)
nodes = [
    ("root", "Portfolio", None, None),
    ("stocks", "Stocks", "root", 450000),
    ("bonds", "Bonds", "root", 250000),
    ("realestate", "Real Estate", "root", 180000),
    ("tech", "Tech", "stocks", 180000),
    ("healthcare", "Healthcare", "stocks", 150000),
    ("finance", "Finance", "stocks", 120000),
    ("corp", "Corporate", "bonds", 150000),
    ("govt", "Government", "bonds", 100000),
    ("commercial", "Commercial", "realestate", 120000),
    ("residential", "Residential", "realestate", 60000),
]

# Circle positions and radii
root_x, root_y, root_r = 0.0, 0.0, 1.0

# Asset class radii (area encoding: r ∝ sqrt(value))
asset_values = {"stocks": 450000, "bonds": 250000, "realestate": 180000}
asset_total = sum(asset_values.values())
asset_scale = 0.46

stocks_r = np.sqrt(asset_values["stocks"] / asset_total) * asset_scale
bonds_r = np.sqrt(asset_values["bonds"] / asset_total) * asset_scale
realestate_r = np.sqrt(asset_values["realestate"] / asset_total) * asset_scale

# Position asset classes in triangular arrangement
stocks_x, stocks_y = 0.0, 0.32
bonds_x, bonds_y = -0.32, -0.10
realestate_x, realestate_y = 0.32, -0.10

# Stock holdings
stock_holdings = {"tech": 180000, "healthcare": 150000, "finance": 120000}
stock_total = sum(stock_holdings.values())
stock_scale = stocks_r * 0.72

tech_r = np.sqrt(stock_holdings["tech"] / stock_total) * stock_scale
healthcare_r = np.sqrt(stock_holdings["healthcare"] / stock_total) * stock_scale
finance_r = np.sqrt(stock_holdings["finance"] / stock_total) * stock_scale

tech_x, tech_y = stocks_x - 0.10, stocks_y
healthcare_x, healthcare_y = stocks_x + 0.10, stocks_y
finance_x, finance_y = stocks_x + 0.0, stocks_y - 0.14

# Bond holdings
bond_holdings = {"corp": 150000, "govt": 100000}
bond_total = sum(bond_holdings.values())
bond_scale = bonds_r * 0.68

corp_r = np.sqrt(bond_holdings["corp"] / bond_total) * bond_scale
govt_r = np.sqrt(bond_holdings["govt"] / bond_total) * bond_scale

corp_x, corp_y = bonds_x + 0.0, bonds_y + 0.08
govt_x, govt_y = bonds_x + 0.0, bonds_y - 0.10

# Real estate holdings
realestate_holdings = {"commercial": 120000, "residential": 60000}
realestate_total = sum(realestate_holdings.values())
realestate_scale = realestate_r * 0.68

commercial_r = np.sqrt(realestate_holdings["commercial"] / realestate_total) * realestate_scale
residential_r = np.sqrt(realestate_holdings["residential"] / realestate_total) * realestate_scale

commercial_x, commercial_y = realestate_x + 0.0, realestate_y + 0.08
residential_x, residential_y = realestate_x + 0.0, realestate_y - 0.10

# All circles data: (id, label, cx, cy, r, depth)
circles_data = [
    ("root", "Portfolio", root_x, root_y, root_r, 0),
    ("stocks", "Stocks", stocks_x, stocks_y, stocks_r, 1),
    ("bonds", "Bonds", bonds_x, bonds_y, bonds_r, 1),
    ("realestate", "Real Estate", realestate_x, realestate_y, realestate_r, 1),
    ("tech", "Tech", tech_x, tech_y, tech_r, 2),
    ("healthcare", "Healthcare", healthcare_x, healthcare_y, healthcare_r, 2),
    ("finance", "Finance", finance_x, finance_y, finance_r, 2),
    ("corp", "Corporate", corp_x, corp_y, corp_r, 2),
    ("govt", "Government", govt_x, govt_y, govt_r, 2),
    ("commercial", "Commercial", commercial_x, commercial_y, commercial_r, 2),
    ("residential", "Residential", residential_x, residential_y, residential_r, 2),
]

# Sort by depth for proper layering
circles_data = sorted(circles_data, key=lambda c: c[5])

# Build polygon dataframe for drawing circles
polygon_rows = []
n_points = 64

for circle_id, _label, cx, cy, r, depth in circles_data:
    angles = np.linspace(0, 2 * np.pi, n_points)
    xs = cx + r * np.cos(angles)
    ys = cy + r * np.sin(angles)
    for j, (x, y) in enumerate(zip(xs, ys, strict=True)):
        polygon_rows.append({"circle_id": circle_id, "x": x, "y": y, "order": j, "depth": depth})

df_circles = pd.DataFrame(polygon_rows)

# Build labels dataframe
label_rows = []
for _circle_id, label, cx, cy, r, depth in circles_data:
    if depth == 0:
        continue
    if depth == 1:
        label_y = cy + r * 0.60
        text_size = 11
    else:
        label_y = cy
        text_size = 9
    label_rows.append({"x": cx, "y": label_y, "label": label, "text_size": text_size, "depth": depth})

df_labels = pd.DataFrame(label_rows)

# Create the plot
plot = (
    ggplot()
    + geom_polygon(
        df_circles, aes(x="x", y="y", group="circle_id", fill="factor(depth)"), color=INK_SOFT, size=0.4, alpha=0.88
    )
    + geom_text(
        df_labels, aes(x="x", y="y", label="label", size="text_size"), color=INK, fontweight="bold", show_legend=False
    )
    + scale_fill_manual(values=IMPRINT, labels=["Root", "Asset Classes", "Holdings"], name="Hierarchy Level")
    + scale_size_identity()
    + coord_fixed(ratio=1)
    + labs(title="circlepacking-basic · plotnine · anyplot.ai")
    + theme_void()
    + theme(
        plot_background=element_rect(fill=PAGE_BG, color=PAGE_BG),
        panel_background=element_rect(fill=PAGE_BG, color=PAGE_BG),
        figure_size=(12, 12),
        plot_title=element_text(size=26, ha="center", weight="bold", color=INK, margin={"b": 20}),
        legend_background=element_rect(fill=ELEVATED_BG, color=INK_SOFT),
        legend_text=element_text(size=13, color=INK_SOFT),
        legend_title=element_text(size=14, weight="bold", color=INK),
        legend_position="bottom",
        legend_direction="horizontal",
    )
    + guides(fill=guide_legend(override_aes={"size": 0.5}))
)

plot.save(f"plot-{THEME}.png", dpi=300, width=12, height=12, verbose=False)
Runnable source as JSON, for any HTTP client: https://api.anyplot.ai/specs/circlepacking-basic/plotnine/code. Any spec id and library id listed in llms-full.txt fit the same URL shape; every URL below is complete and callable.
{
  "spec_id": "circlepacking-basic",
  "language": "python",
  "library": "plotnine",
  "page": "https://anyplot.ai/circlepacking-basic/python/plotnine",
  "hub": "https://anyplot.ai/circlepacking-basic",
  "code_json": "https://api.anyplot.ai/specs/circlepacking-basic/plotnine/code",
  "spec_json": "https://api.anyplot.ai/specs/circlepacking-basic",
  "render_light_png": "https://storage.googleapis.com/anyplot-images/plots/circlepacking-basic/python/plotnine/plot-light.png",
  "render_dark_png": "https://storage.googleapis.com/anyplot-images/plots/circlepacking-basic/python/plotnine/plot-dark.png",
  "quality_score": 92.0,
  "license": "MIT",
  "guide": "https://anyplot.ai/llms.txt"
}
Part of Circle Packing Chart on anyplot.ai.