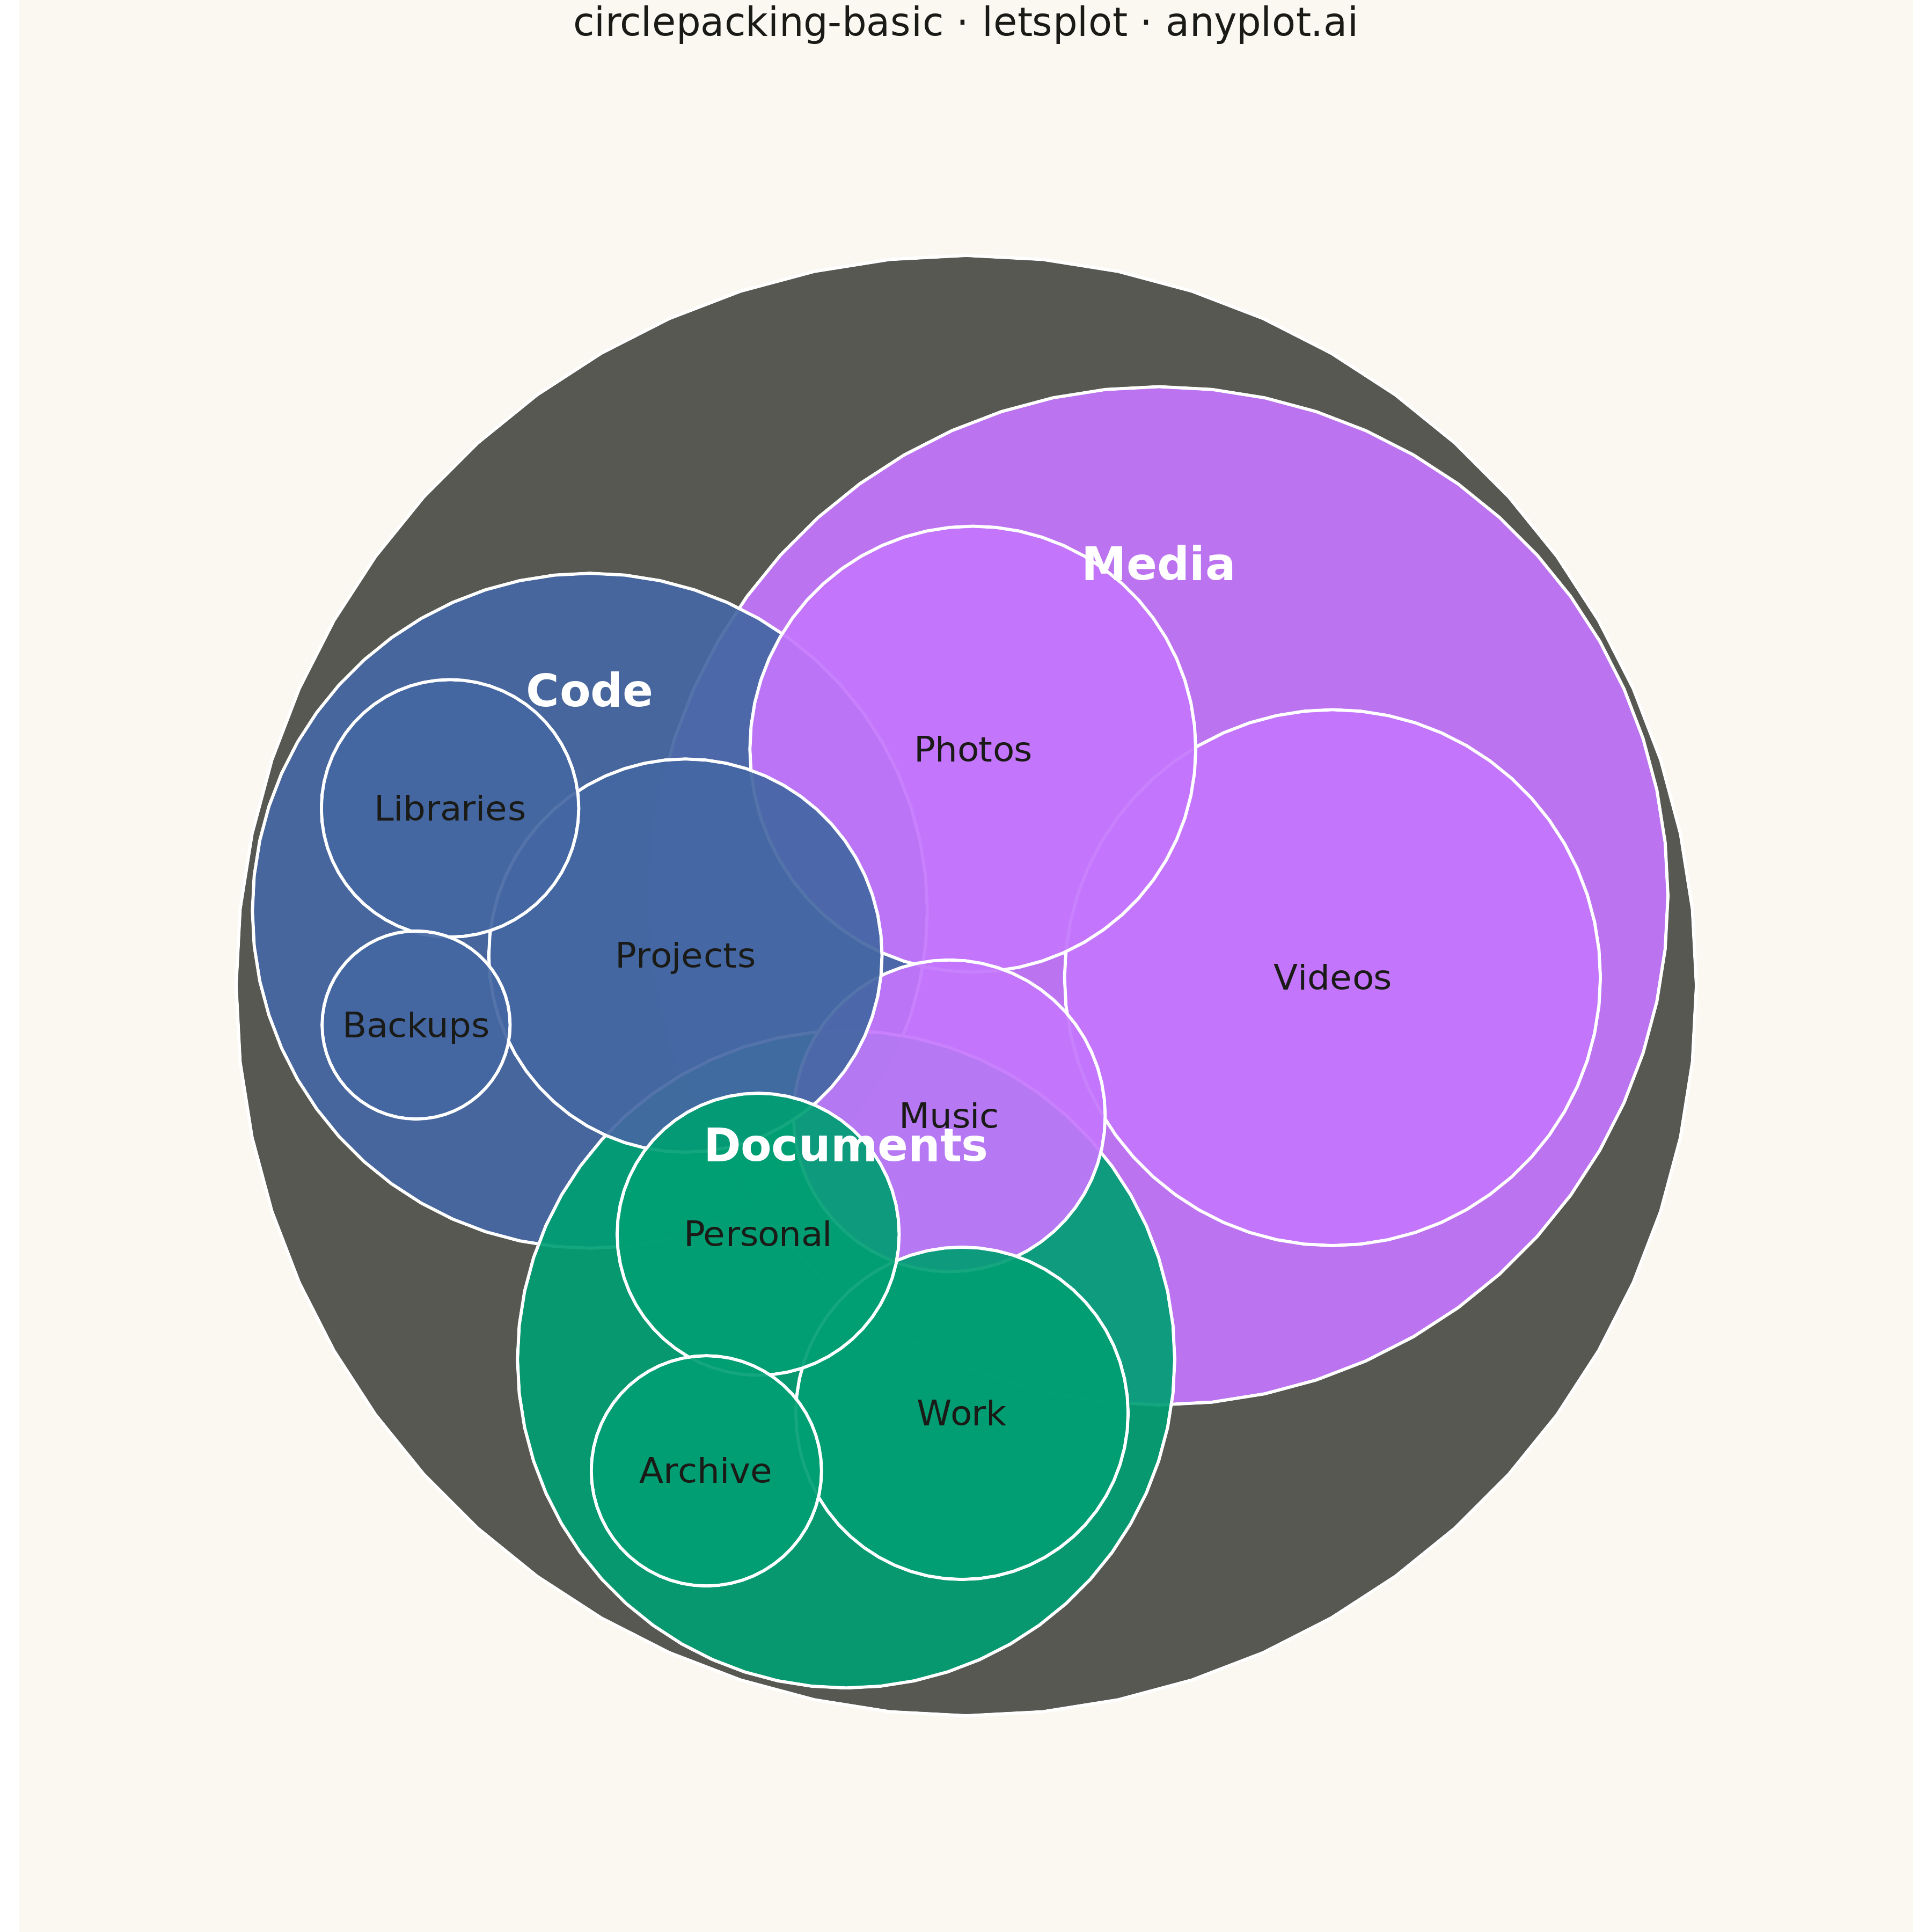
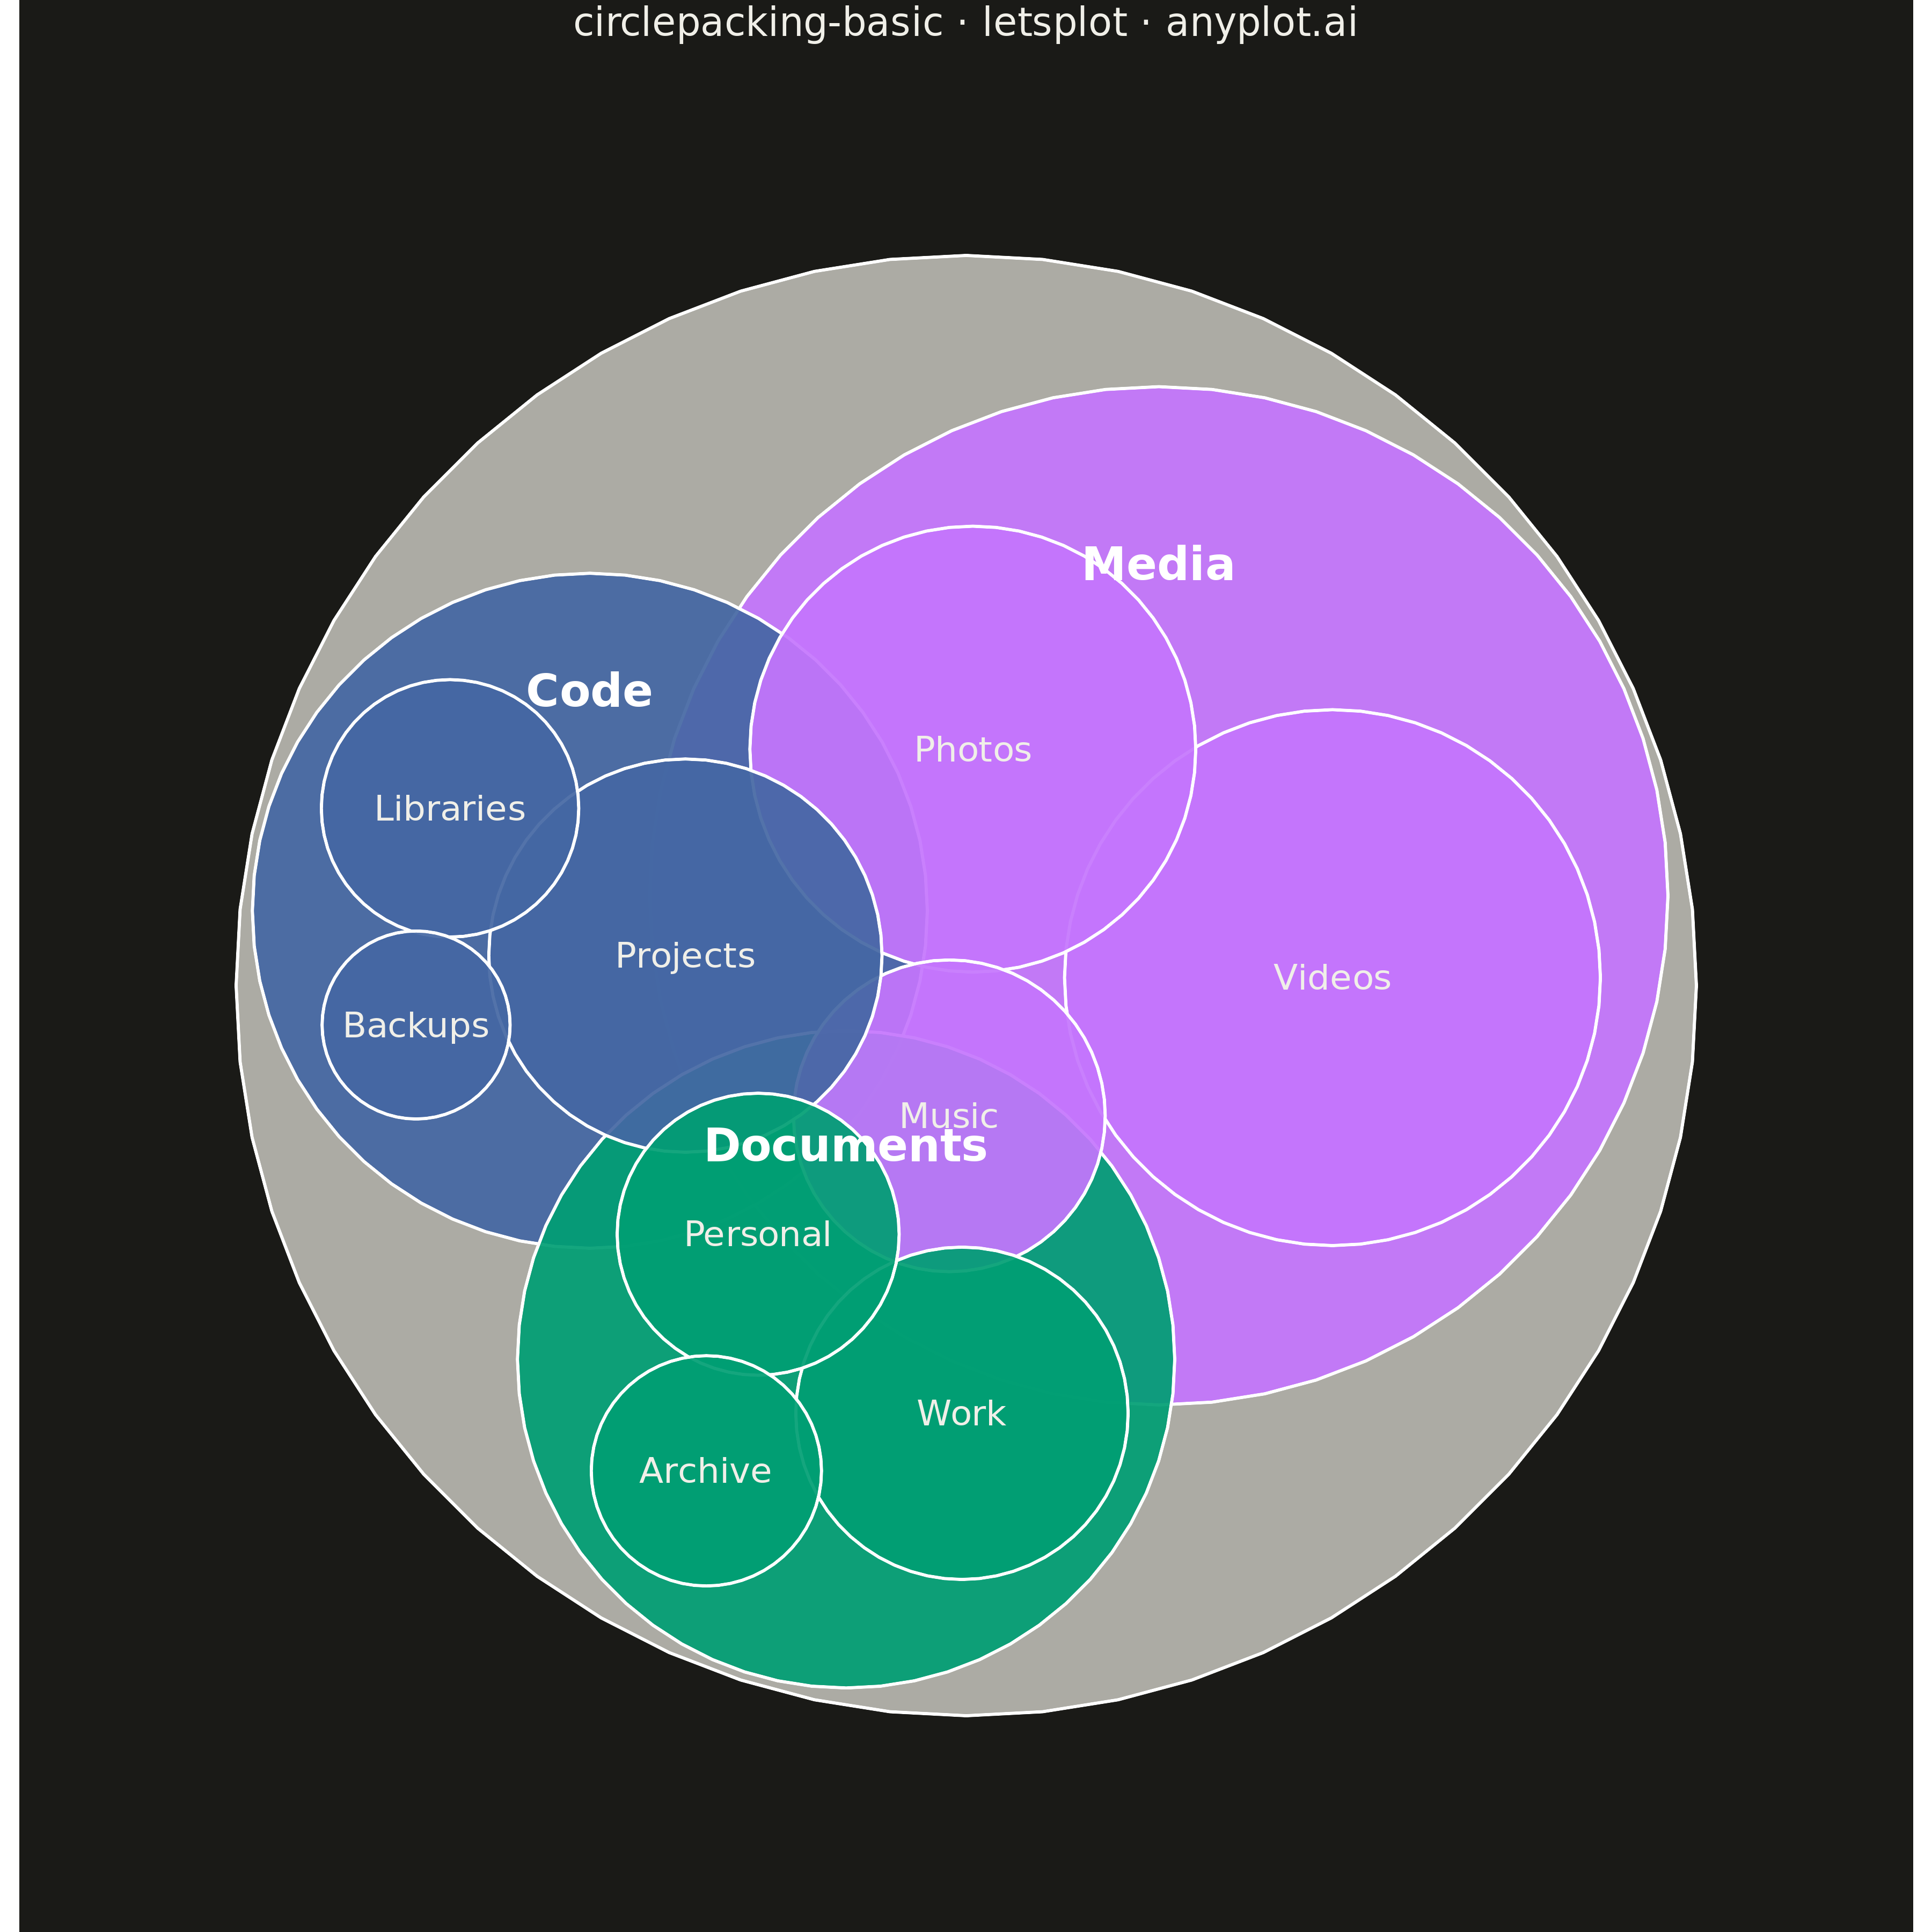
A circle packing chart displays hierarchical data as nested circles, where each circle contains smaller circles representing its children. Circle size is proportional to node value, and circles are packed efficiently without overlap. This visualization excels at revealing hierarchical structures while simultaneously showing quantitative relationships through area encoding.
""" anyplot.ai
circlepacking-basic: Circle Packing Chart
Library: letsplot 4.9.0 | Python 3.13.13
Quality: 86/100 | Updated: 2026-05-11
"""

import math
import os

import numpy as np
import pandas as pd
from lets_plot import (
    LetsPlot,
    aes,
    coord_fixed,
    element_blank,
    element_rect,
    element_text,
    geom_polygon,
    geom_text,
    ggplot,
    ggsize,
    labs,
    scale_fill_manual,
    scale_x_continuous,
    scale_y_continuous,
    theme,
)
from lets_plot.export import ggsave


LetsPlot.setup_html()

# Theme tokens
THEME = os.getenv("ANYPLOT_THEME", "light")
PAGE_BG = "#FAF8F1" if THEME == "light" else "#1A1A17"
ELEVATED_BG = "#FFFDF6" if THEME == "light" else "#242420"
INK = "#1A1A17" if THEME == "light" else "#F0EFE8"
INK_SOFT = "#4A4A44" if THEME == "light" else "#B8B7B0"

# Okabe-Ito palette
IMPRINT = ["#009E73", "#C475FD", "#4467A3", "#BD8233", "#AE3030", "#2ABCCD", "#954477"]

# Hierarchical data - File system storage breakdown (GB)
np.random.seed(42)
hierarchy = [
    # Level 1: Main folders
    {"id": "Documents", "parent": "root", "value": None, "label": "Documents"},
    {"id": "Media", "parent": "root", "value": None, "label": "Media"},
    {"id": "Code", "parent": "root", "value": None, "label": "Code"},
    # Level 2: Subfolders under Documents
    {"id": "Work", "parent": "Documents", "value": 25, "label": "Work"},
    {"id": "Personal", "parent": "Documents", "value": 18, "label": "Personal"},
    {"id": "Archive", "parent": "Documents", "value": 12, "label": "Archive"},
    # Level 2: Subfolders under Media
    {"id": "Photos", "parent": "Media", "value": 45, "label": "Photos"},
    {"id": "Videos", "parent": "Media", "value": 65, "label": "Videos"},
    {"id": "Music", "parent": "Media", "value": 22, "label": "Music"},
    # Level 2: Subfolders under Code
    {"id": "Projects", "parent": "Code", "value": 35, "label": "Projects"},
    {"id": "Libraries", "parent": "Code", "value": 15, "label": "Libraries"},
    {"id": "Backups", "parent": "Code", "value": 8, "label": "Backups"},
]

# Data preparation
df = pd.DataFrame(hierarchy)
for idx, row in df[df["value"].isna()].iterrows():
    children = df[df["parent"] == row["id"]]
    df.loc[idx, "value"] = children["value"].sum()

root_radius = 90
root_cx, root_cy = 0, 0
total_value = df[df["parent"] == "root"]["value"].sum()

polygon_rows = []
label_rows = []
circle_id = 0

# Root circle
angles = np.linspace(0, 2 * np.pi, 60, endpoint=False)
x_root = root_cx + root_radius * np.cos(angles)
y_root = root_cy + root_radius * np.sin(angles)
for x, y in zip(x_root, y_root, strict=True):
    polygon_rows.append({"x": x, "y": y, "circle_id": circle_id, "depth": 0, "color": "root"})
circle_id += 1

# Level 1 circles
level1 = df[df["parent"] == "root"].copy()
level1["radius"] = np.sqrt(level1["value"] / total_value) * root_radius * 0.95
level1 = level1.sort_values("radius", ascending=False).reset_index(drop=True)

# Pack level 1 circles with force simulation
level1_radii = level1["radius"].tolist()
n = len(level1_radii)
radii = np.array(level1_radii)
angles_init = np.linspace(0, 2 * np.pi, n, endpoint=False)
level1_x = root_cx + root_radius * 0.4 * np.cos(angles_init)
level1_y = root_cy + root_radius * 0.4 * np.sin(angles_init)

for _iteration in range(800):
    # Repulsion between pairs
    for i in range(n):
        for j in range(i + 1, n):
            dx = level1_x[j] - level1_x[i]
            dy = level1_y[j] - level1_y[i]
            dist = math.sqrt(dx * dx + dy * dy)
            min_dist = radii[i] + radii[j] + 1.0
            if dist < min_dist and dist > 0.001:
                overlap = (min_dist - dist) / 2
                norm_x = dx / dist
                norm_y = dy / dist
                level1_x[i] -= norm_x * overlap * 0.5
                level1_y[i] -= norm_y * overlap * 0.5
                level1_x[j] += norm_x * overlap * 0.5
                level1_y[j] += norm_y * overlap * 0.5
    # Boundary constraint
    for i in range(n):
        dx = level1_x[i] - root_cx
        dy = level1_y[i] - root_cy
        dist = math.sqrt(dx * dx + dy * dy)
        max_dist = root_radius - radii[i] - 1.0
        if dist > max_dist and dist > 0.001:
            scale = max_dist / dist
            level1_x[i] = root_cx + dx * scale
            level1_y[i] = root_cy + dy * scale
    # Gentle center attraction
    level1_x = root_cx + (level1_x - root_cx) * 0.998
    level1_y = root_cy + (level1_y - root_cy) * 0.998

# Draw level 1 circles
level1_positions = {}
for i, (_, row) in enumerate(level1.iterrows()):
    level1_positions[row["id"]] = {"x": level1_x[i], "y": level1_y[i], "radius": row["radius"]}
    # Circle polygon
    angles = np.linspace(0, 2 * np.pi, 60, endpoint=False)
    x_circ = level1_x[i] + row["radius"] * np.cos(angles)
    y_circ = level1_y[i] + row["radius"] * np.sin(angles)
    for x, y in zip(x_circ, y_circ, strict=True):
        polygon_rows.append({"x": x, "y": y, "circle_id": circle_id, "depth": 1, "color": row["id"]})
    # Label
    label_rows.append(
        {"x": level1_x[i], "y": level1_y[i] + row["radius"] * 0.65, "label": row["label"], "depth": 1, "size": 14}
    )
    circle_id += 1

# Level 2 circles
for parent_id, pos in level1_positions.items():
    children = df[df["parent"] == parent_id].copy()
    if children.empty:
        continue
    parent_value = children["value"].sum()
    children["radius"] = np.sqrt(children["value"] / parent_value) * pos["radius"] * 0.75
    children = children.sort_values("radius", ascending=False).reset_index(drop=True)

    # Pack children with force simulation
    children_radii = children["radius"].tolist()
    n_c = len(children_radii)
    radii_c = np.array(children_radii)
    angles_init = np.linspace(0, 2 * np.pi, n_c, endpoint=False)
    children_x = pos["x"] + pos["radius"] * 0.4 * np.cos(angles_init)
    children_y = pos["y"] + pos["radius"] * 0.4 * np.sin(angles_init)

    for _iteration in range(600):
        for i in range(n_c):
            for j in range(i + 1, n_c):
                dx = children_x[j] - children_x[i]
                dy = children_y[j] - children_y[i]
                dist = math.sqrt(dx * dx + dy * dy)
                min_dist = radii_c[i] + radii_c[j] + 1.0
                if dist < min_dist and dist > 0.001:
                    overlap = (min_dist - dist) / 2
                    norm_x = dx / dist
                    norm_y = dy / dist
                    children_x[i] -= norm_x * overlap * 0.5
                    children_y[i] -= norm_y * overlap * 0.5
                    children_x[j] += norm_x * overlap * 0.5
                    children_y[j] += norm_y * overlap * 0.5
        for i in range(n_c):
            dx = children_x[i] - pos["x"]
            dy = children_y[i] - pos["y"]
            dist = math.sqrt(dx * dx + dy * dy)
            max_dist = pos["radius"] * 0.92 - radii_c[i] - 1.0
            if dist > max_dist and dist > 0.001:
                scale = max_dist / dist
                children_x[i] = pos["x"] + dx * scale
                children_y[i] = pos["y"] + dy * scale
        children_x = pos["x"] + (children_x - pos["x"]) * 0.998
        children_y = pos["y"] + (children_y - pos["y"]) * 0.998

    # Draw children circles
    for i, (_, row) in enumerate(children.iterrows()):
        angles = np.linspace(0, 2 * np.pi, 60, endpoint=False)
        x_circ = children_x[i] + row["radius"] * np.cos(angles)
        y_circ = children_y[i] + row["radius"] * np.sin(angles)
        for x, y in zip(x_circ, y_circ, strict=True):
            polygon_rows.append({"x": x, "y": y, "circle_id": circle_id, "depth": 2, "color": row["id"]})
        # Label (if circle large enough)
        if row["radius"] > 6:
            label_rows.append({"x": children_x[i], "y": children_y[i], "label": row["label"], "depth": 2, "size": 11})
        circle_id += 1

polygon_df = pd.DataFrame(polygon_rows)
label_df = pd.DataFrame(label_rows)

# Color mapping: depth-based with Okabe-Ito
color_map = {
    "root": INK_SOFT,
    "Documents": IMPRINT[0],
    "Media": IMPRINT[1],
    "Code": IMPRINT[2],
    "Work": IMPRINT[0],
    "Personal": IMPRINT[0],
    "Archive": IMPRINT[0],
    "Photos": IMPRINT[1],
    "Videos": IMPRINT[1],
    "Music": IMPRINT[1],
    "Projects": IMPRINT[2],
    "Libraries": IMPRINT[2],
    "Backups": IMPRINT[2],
}

unique_colors = polygon_df["color"].unique()
color_values = [color_map.get(c, INK_SOFT) for c in unique_colors]

# Plot
plot = (
    ggplot(polygon_df)
    + geom_polygon(aes(x="x", y="y", fill="color", group="circle_id"), color="white", size=0.8, alpha=0.92)
    + geom_text(
        aes(x="x", y="y", label="label"), data=label_df[label_df["depth"] == 1], size=14, color="white", fontface="bold"
    )
    + geom_text(aes(x="x", y="y", label="label"), data=label_df[label_df["depth"] == 2], size=11, color=INK)
    + scale_fill_manual(values=color_values)
    + coord_fixed(ratio=1)
    + scale_x_continuous(limits=(-105, 105))
    + scale_y_continuous(limits=(-105, 105))
    + labs(title="circlepacking-basic · letsplot · anyplot.ai")
    + ggsize(1200, 1200)
    + theme(
        plot_background=element_rect(fill=PAGE_BG, color=PAGE_BG),
        panel_background=element_rect(fill=PAGE_BG, color=PAGE_BG),
        plot_title=element_text(size=24, hjust=0.5, color=INK),
        legend_position="none",
        axis_title=element_blank(),
        axis_text=element_blank(),
        axis_ticks=element_blank(),
        axis_line=element_blank(),
        panel_grid=element_blank(),
    )
)

# Save
ggsave(plot, f"plot-{THEME}.png", path=".", scale=3)
ggsave(plot, f"plot-{THEME}.html", path=".")
Runnable source as JSON, for any HTTP client: https://api.anyplot.ai/specs/circlepacking-basic/letsplot/code. Any spec id and library id listed in llms-full.txt fit the same URL shape; every URL below is complete and callable.
{
  "spec_id": "circlepacking-basic",
  "language": "python",
  "library": "letsplot",
  "page": "https://anyplot.ai/circlepacking-basic/python/letsplot",
  "hub": "https://anyplot.ai/circlepacking-basic",
  "code_json": "https://api.anyplot.ai/specs/circlepacking-basic/letsplot/code",
  "spec_json": "https://api.anyplot.ai/specs/circlepacking-basic",
  "render_light_png": "https://storage.googleapis.com/anyplot-images/plots/circlepacking-basic/python/letsplot/plot-light.png",
  "render_dark_png": "https://storage.googleapis.com/anyplot-images/plots/circlepacking-basic/python/letsplot/plot-dark.png",
  "interactive_light_html": "https://storage.googleapis.com/anyplot-images/plots/circlepacking-basic/python/letsplot/plot-light.html",
  "interactive_dark_html": "https://storage.googleapis.com/anyplot-images/plots/circlepacking-basic/python/letsplot/plot-dark.html",
  "quality_score": 86.0,
  "license": "MIT",
  "guide": "https://anyplot.ai/llms.txt"
}
Part of Circle Packing Chart on anyplot.ai.