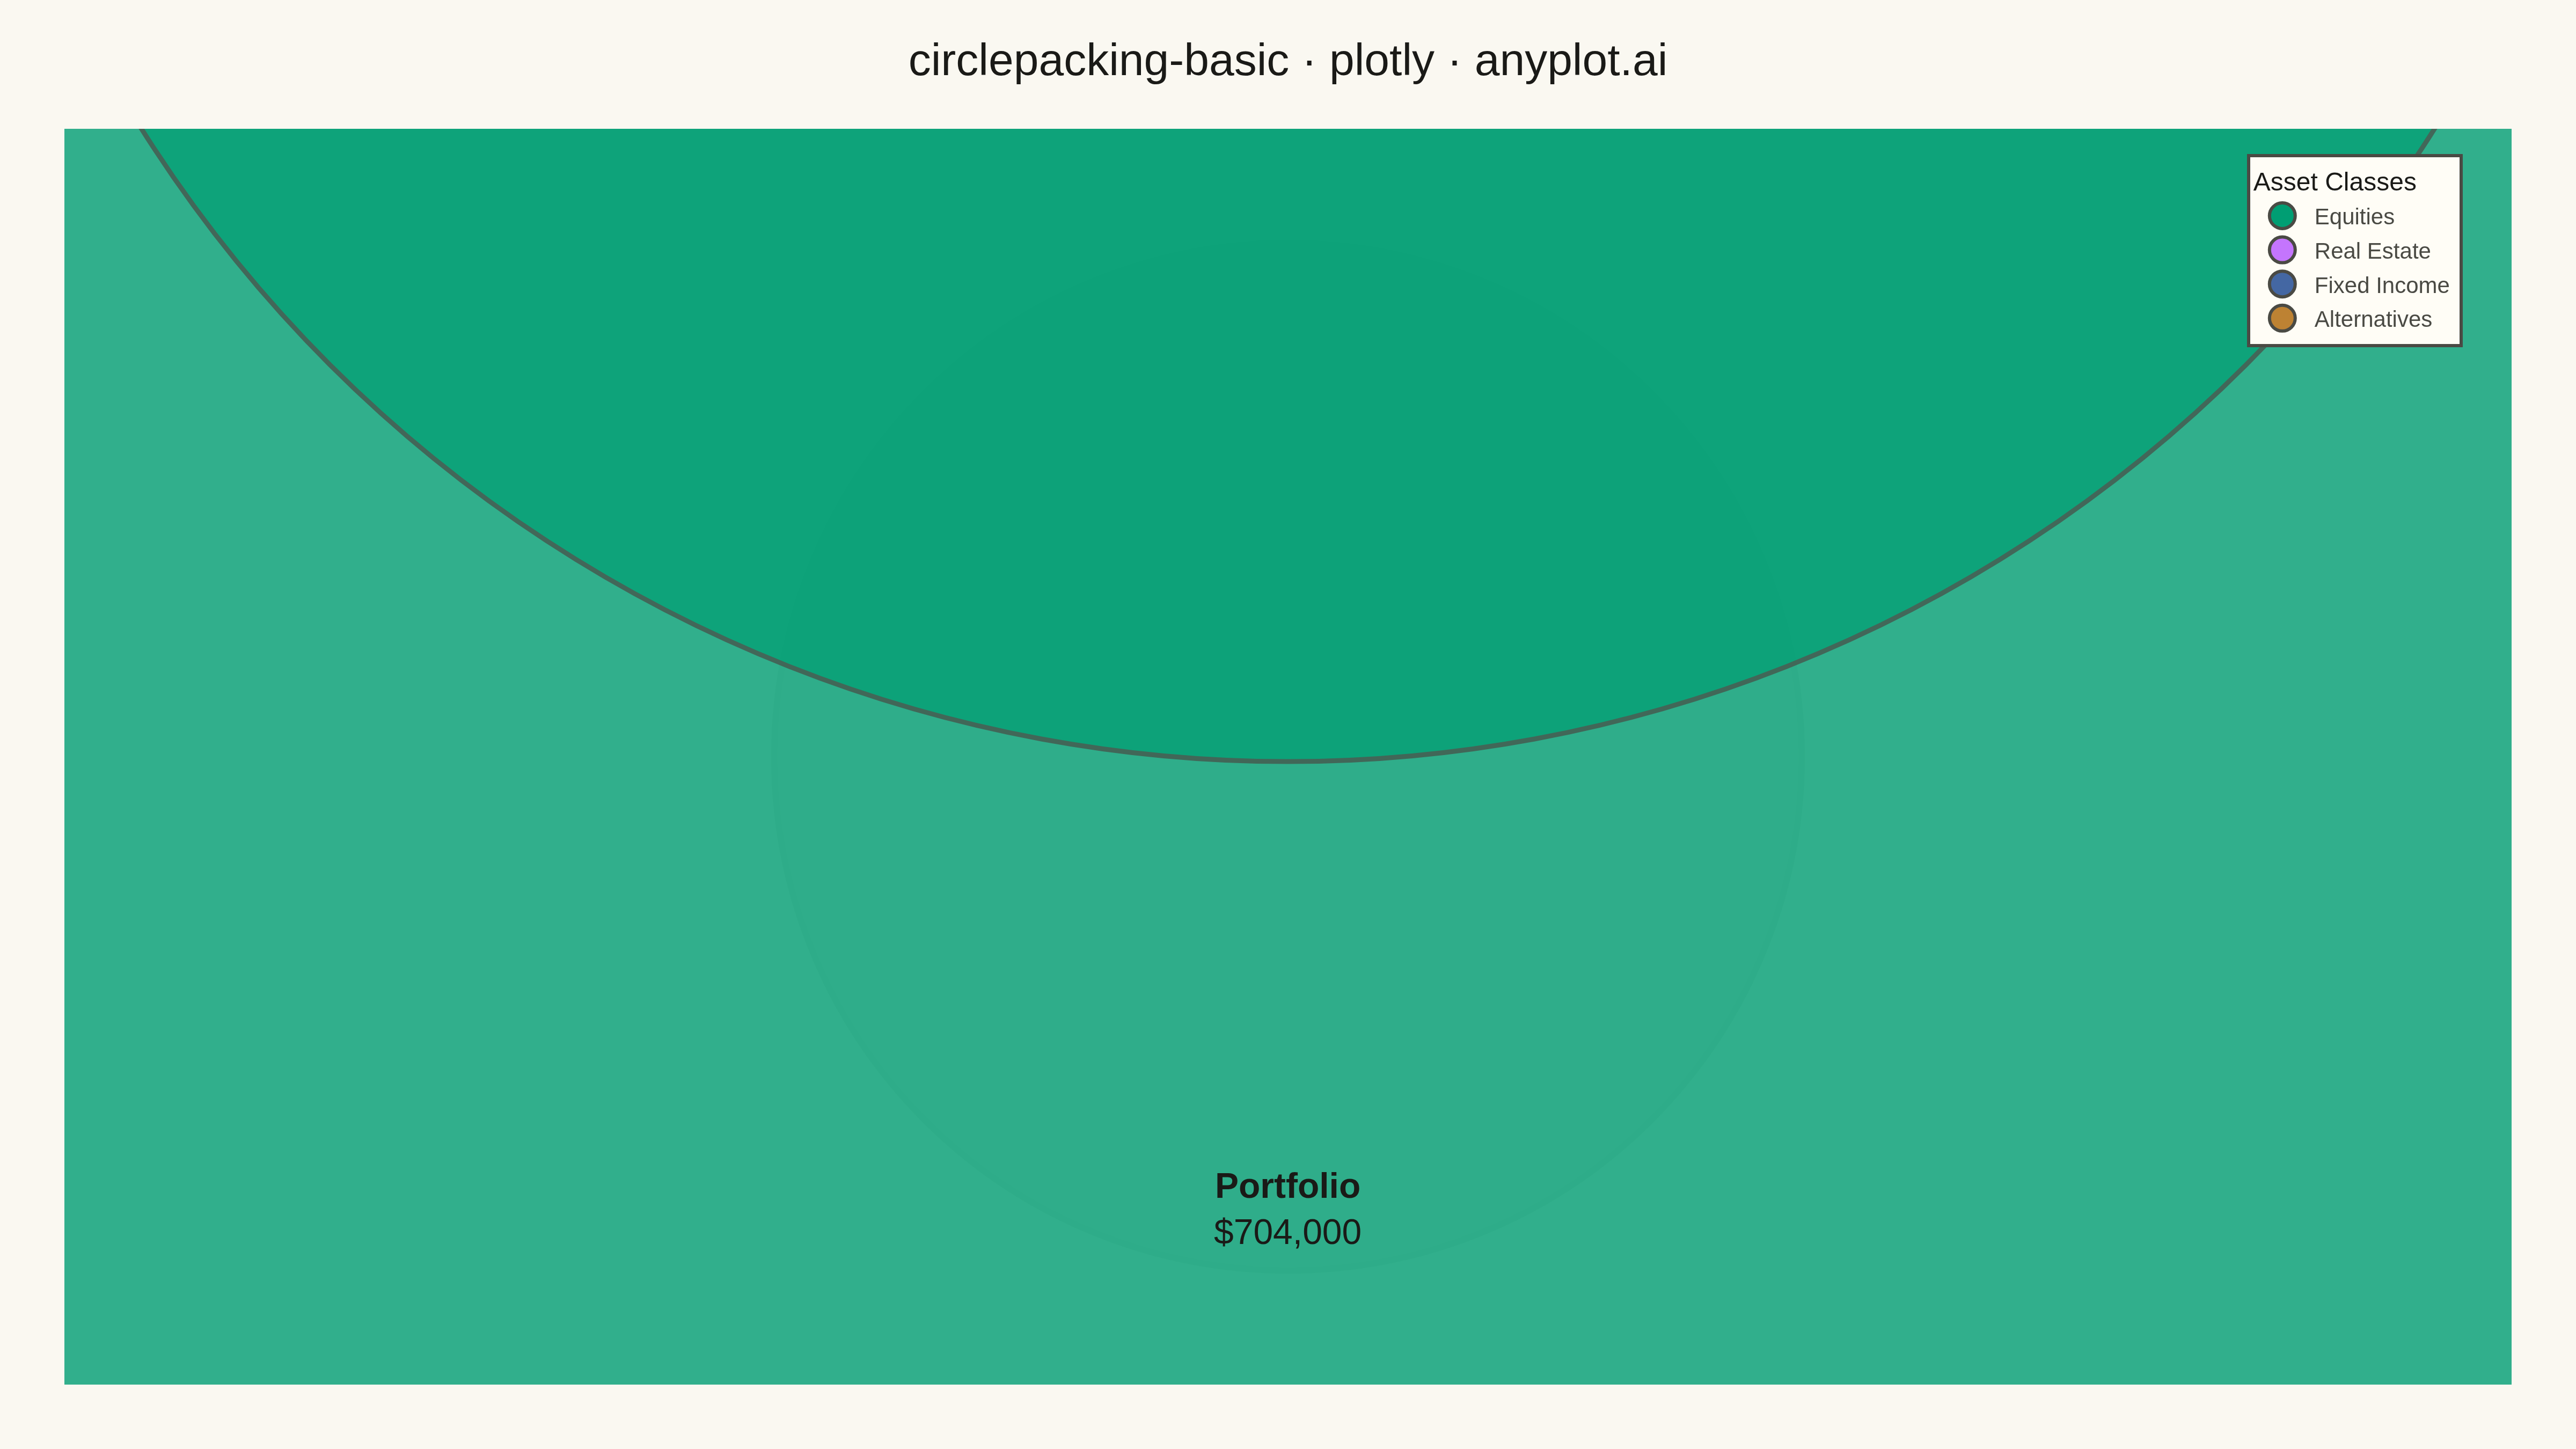
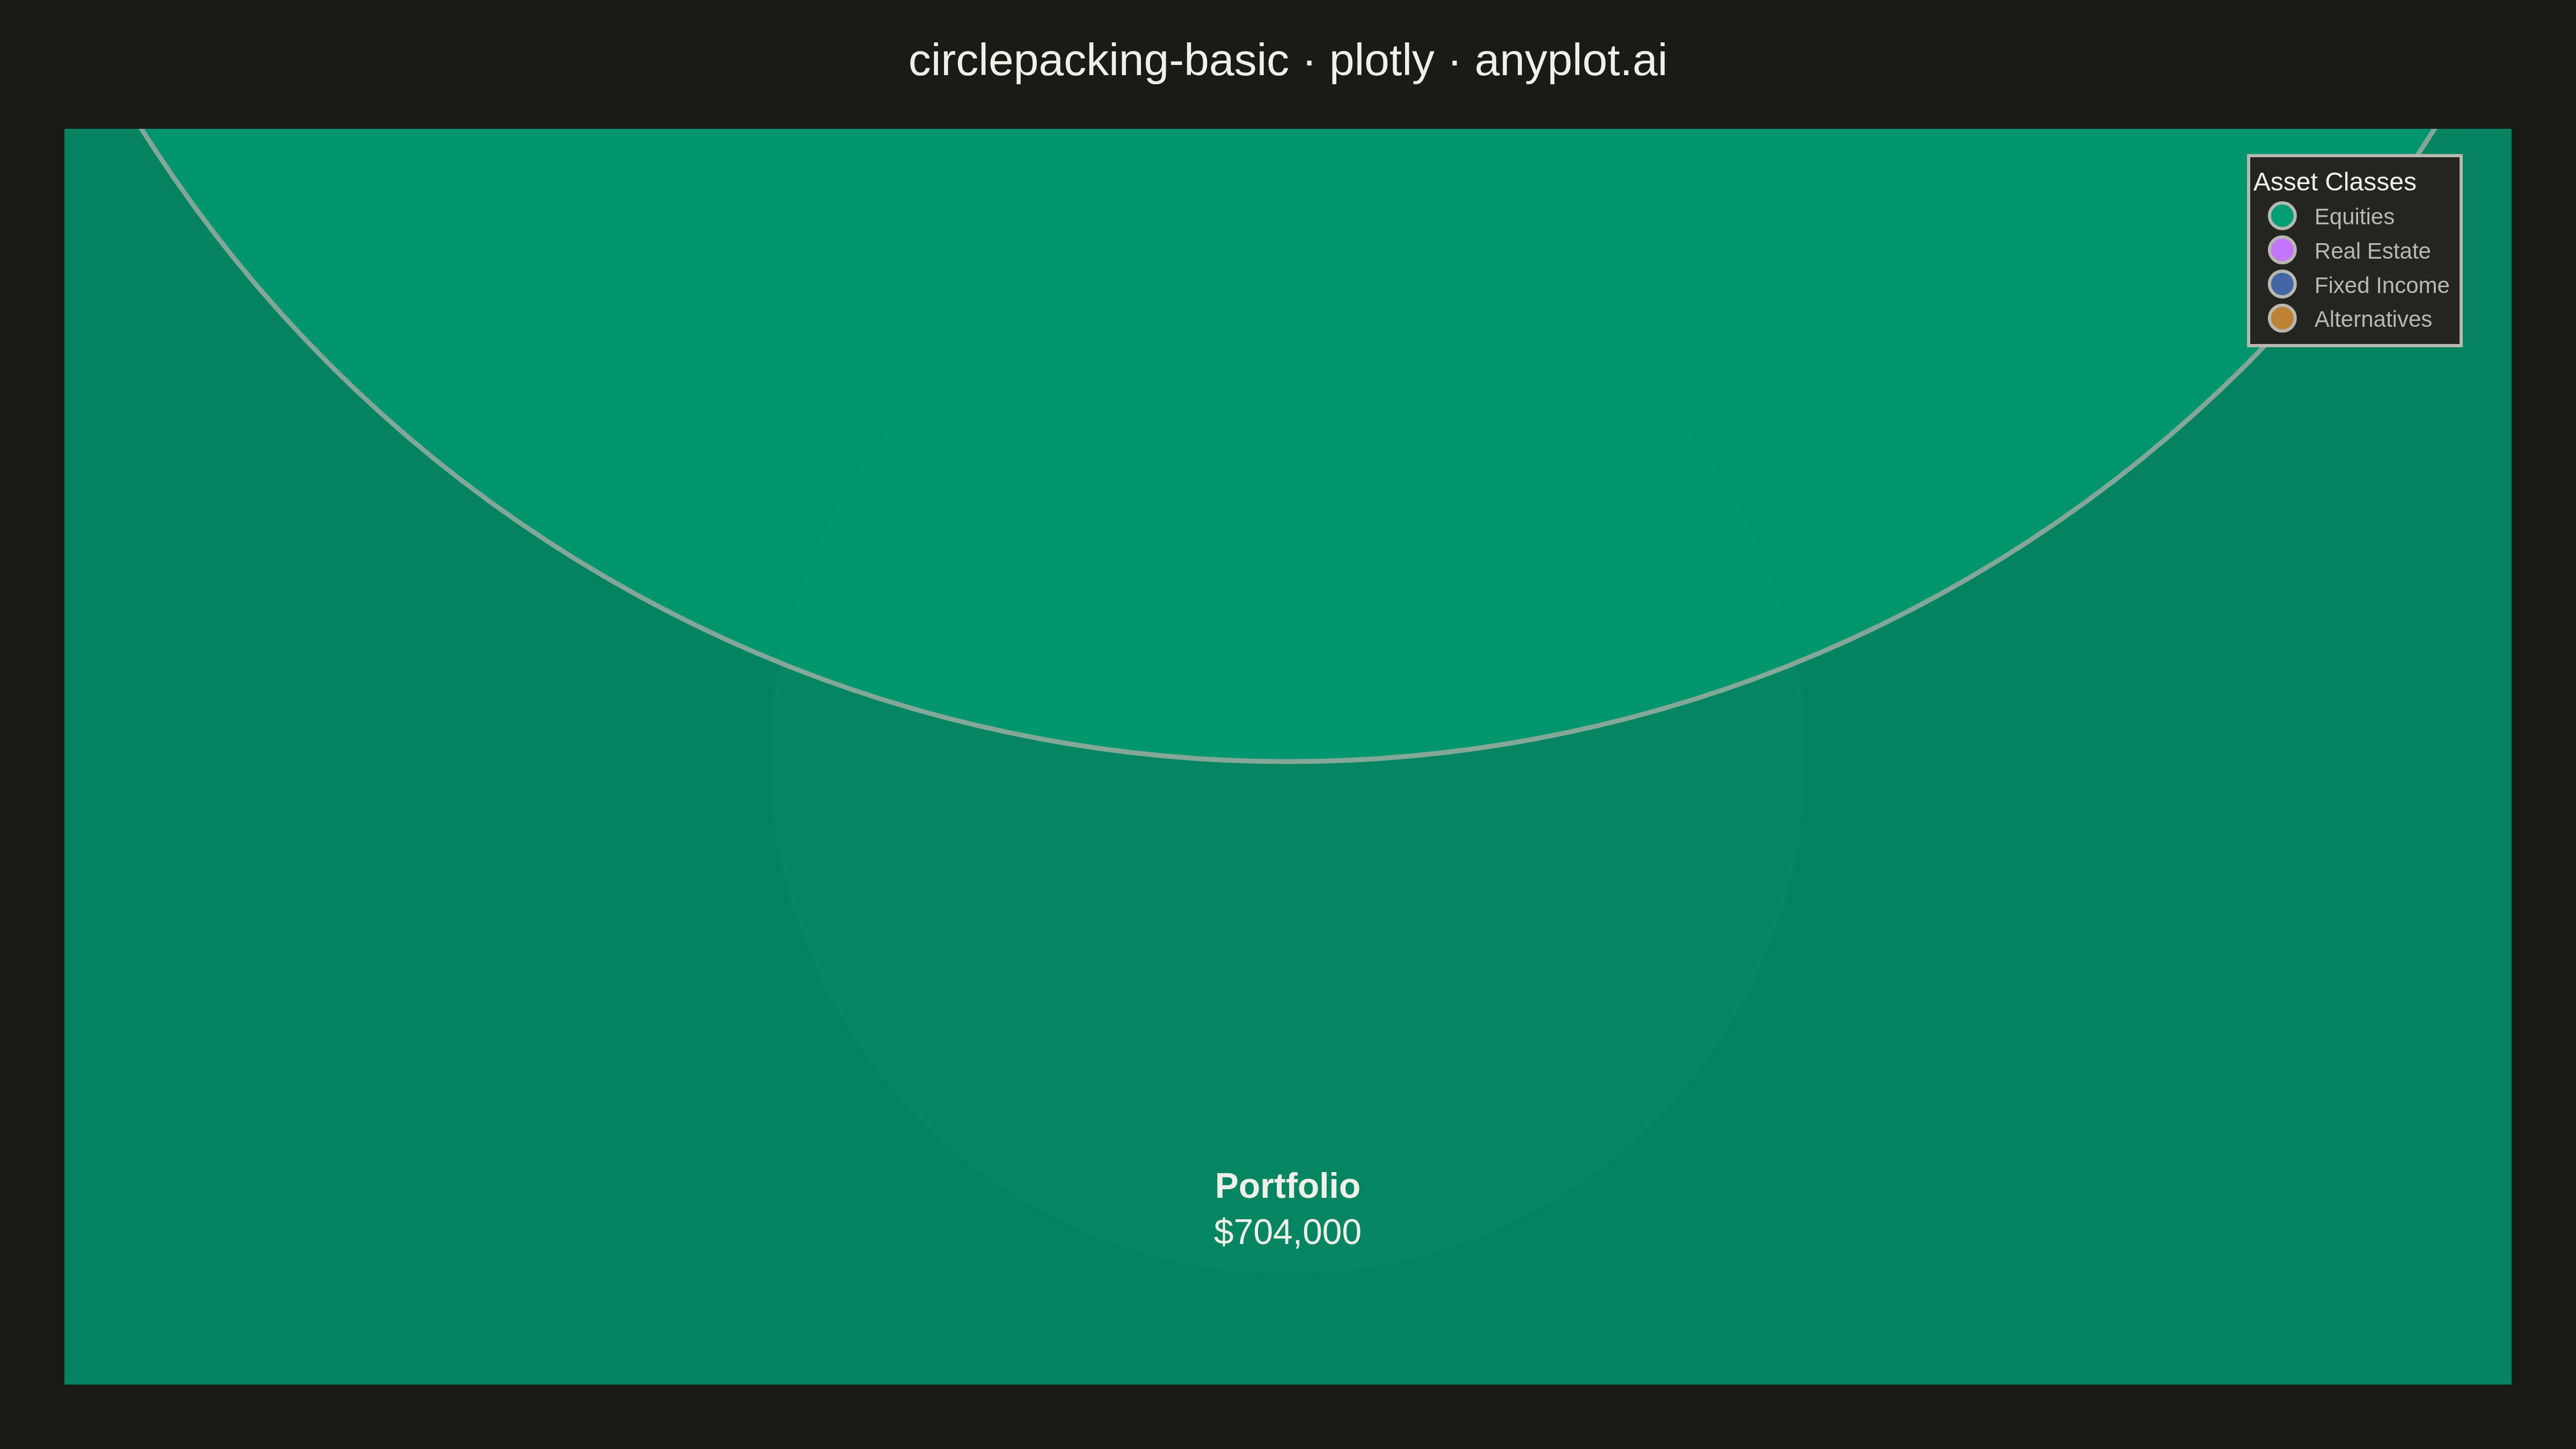
A circle packing chart displays hierarchical data as nested circles, where each circle contains smaller circles representing its children. Circle size is proportional to node value, and circles are packed efficiently without overlap. This visualization excels at revealing hierarchical structures while simultaneously showing quantitative relationships through area encoding.
""" anyplot.ai
circlepacking-basic: Circle Packing Chart
Library: plotly 6.7.0 | Python 3.13.13
Quality: 94/100 | Updated: 2026-05-11
"""

import os

import numpy as np
import plotly.graph_objects as go


THEME = os.getenv("ANYPLOT_THEME", "light")
PAGE_BG = "#FAF8F1" if THEME == "light" else "#1A1A17"
ELEVATED_BG = "#FFFDF6" if THEME == "light" else "#242420"
INK = "#1A1A17" if THEME == "light" else "#F0EFE8"
INK_SOFT = "#4A4A44" if THEME == "light" else "#B8B7B0"
GRID = "rgba(26,26,23,0.10)" if THEME == "light" else "rgba(240,239,232,0.10)"

IMPRINT = ["#009E73", "#C475FD", "#4467A3", "#BD8233", "#AE3030", "#2ABCCD", "#954477"]

np.random.seed(42)

# Data: Investment portfolio hierarchy by asset class and holdings
portfolio = {
    "Equities": {
        "US Large Cap": {"AAPL": 45000, "MSFT": 38000, "JPM": 32000},
        "International": {"ASML": 28000, "TSM": 35000, "SAP": 22000},
        "Emerging Markets": {"BABA": 18000, "TCEHY": 15000},
    },
    "Fixed Income": {
        "Government Bonds": {"US 10Y": 50000, "DE Bund": 35000},
        "Corporate Bonds": {"AAA": 42000, "BBB": 28000, "High Yield": 18000},
    },
    "Real Estate": {
        "REITs": {"Industrial": 22000, "Residential": 28000, "Commercial": 18000},
        "Direct": {"Property A": 65000, "Property B": 55000},
    },
    "Alternatives": {
        "Commodities": {"Gold": 20000, "Oil Futures": 15000},
        "Private Equity": {"Fund 1": 40000, "Fund 2": 35000},
    },
}

# Calculate total portfolio value
total_value = sum(sum(sum(items.values()) for items in subcats.values()) for subcats in portfolio.values())

# Build circles with packing algorithm
all_circles = []

# Root circle
root_radius = 450
all_circles.append(
    {"x": 0, "y": 0, "r": root_radius, "label": "Portfolio", "value": total_value, "color": "#808080", "level": -1}
)

# Calculate asset class data and sort by value
asset_data = []
for asset_class, subcats in portfolio.items():
    total = sum(sum(items.values()) for items in subcats.values())
    asset_data.append((asset_class, total, subcats))
asset_data.sort(key=lambda x: x[1], reverse=True)

# Calculate asset class radii
asset_radii = [(name, np.sqrt(total) * 7.0, total, subcats) for name, total, subcats in asset_data]

# Pack asset classes
packed_assets = []
for i, (name, radius, value, subcats) in enumerate(asset_radii):
    if i == 0:
        packed_assets.append(
            {"name": name, "r": radius, "value": value, "subcats": subcats, "x": 0, "y": radius * 0.35}
        )
    else:
        best_pos = None
        min_dist_from_center = float("inf")
        for existing in packed_assets:
            for angle in np.linspace(0, 2 * np.pi, 36):
                dist = existing["r"] + radius + 12
                nx = existing["x"] + dist * np.cos(angle)
                ny = existing["y"] + dist * np.sin(angle)
                d_to_center = np.sqrt(nx**2 + ny**2)
                if d_to_center + radius > root_radius * 0.93:
                    continue
                overlaps = False
                for other in packed_assets:
                    d = np.sqrt((nx - other["x"]) ** 2 + (ny - other["y"]) ** 2)
                    if d < other["r"] + radius + 10:
                        overlaps = True
                        break
                if not overlaps and d_to_center < min_dist_from_center:
                    min_dist_from_center = d_to_center
                    best_pos = (nx, ny)
        if best_pos:
            packed_assets.append(
                {"name": name, "r": radius, "value": value, "subcats": subcats, "x": best_pos[0], "y": best_pos[1]}
            )

# Build hierarchy with subcategories and leaf holdings
for idx, asset_info in enumerate(packed_assets):
    asset_class = asset_info["name"]
    cx, cy = asset_info["x"], asset_info["y"]
    asset_radius = asset_info["r"]
    subcats = asset_info["subcats"]
    asset_color = IMPRINT[idx % len(IMPRINT)]

    all_circles.append(
        {
            "x": cx,
            "y": cy,
            "r": asset_radius,
            "label": asset_class,
            "value": asset_info["value"],
            "color": asset_color,
            "level": 0,
        }
    )

    # Pack subcategories within asset class
    subcat_list = sorted(
        [(name, sum(items.values()), items) for name, items in subcats.items()], key=lambda x: x[1], reverse=True
    )
    packed_subs = []
    sub_scale = 3.5

    for j, (sub_name, sub_value, sub_items) in enumerate(subcat_list):
        sub_r = np.sqrt(sub_value) * sub_scale
        if j == 0:
            packed_subs.append({"name": sub_name, "value": sub_value, "items": sub_items, "r": sub_r, "x": cx, "y": cy})
        else:
            best_pos = None
            min_dist = float("inf")
            for existing in packed_subs:
                for angle in np.linspace(0, 2 * np.pi, 24):
                    dist = existing["r"] + sub_r + 5
                    nx = existing["x"] + dist * np.cos(angle)
                    ny = existing["y"] + dist * np.sin(angle)
                    d_to_parent = np.sqrt((nx - cx) ** 2 + (ny - cy) ** 2)
                    if d_to_parent + sub_r > asset_radius * 0.87:
                        continue
                    overlaps = False
                    for other in packed_subs:
                        d = np.sqrt((nx - other["x"]) ** 2 + (ny - other["y"]) ** 2)
                        if d < other["r"] + sub_r + 4:
                            overlaps = True
                            break
                    if not overlaps:
                        d_center = np.sqrt((nx - cx) ** 2 + (ny - cy) ** 2)
                        if d_center < min_dist:
                            min_dist = d_center
                            best_pos = (nx, ny)
            if best_pos:
                packed_subs.append(
                    {
                        "name": sub_name,
                        "value": sub_value,
                        "items": sub_items,
                        "r": sub_r,
                        "x": best_pos[0],
                        "y": best_pos[1],
                    }
                )

    for sub in packed_subs:
        sub_x, sub_y, sub_r = sub["x"], sub["y"], sub["r"]
        sub_color = asset_color
        all_circles.append(
            {
                "x": sub_x,
                "y": sub_y,
                "r": sub_r,
                "label": sub["name"],
                "value": sub["value"],
                "color": sub_color,
                "level": 1,
                "parent": asset_class,
            }
        )

        # Pack leaf nodes (holdings) within subcategory
        leaf_list = sorted(sub["items"].items(), key=lambda x: x[1], reverse=True)
        packed_leaves = []
        leaf_scale = 2.0

        for k, (leaf_name, leaf_value) in enumerate(leaf_list):
            leaf_r = np.sqrt(leaf_value) * leaf_scale
            if k == 0:
                packed_leaves.append({"name": leaf_name, "value": leaf_value, "r": leaf_r, "x": sub_x, "y": sub_y})
            else:
                best_pos = None
                min_dist = float("inf")
                for existing in packed_leaves:
                    for angle in np.linspace(0, 2 * np.pi, 24):
                        dist = existing["r"] + leaf_r + 2
                        nx = existing["x"] + dist * np.cos(angle)
                        ny = existing["y"] + dist * np.sin(angle)
                        d_to_parent = np.sqrt((nx - sub_x) ** 2 + (ny - sub_y) ** 2)
                        if d_to_parent + leaf_r > sub_r * 0.84:
                            continue
                        overlaps = False
                        for other in packed_leaves:
                            d = np.sqrt((nx - other["x"]) ** 2 + (ny - other["y"]) ** 2)
                            if d < other["r"] + leaf_r + 1:
                                overlaps = True
                                break
                        if not overlaps:
                            d_center = np.sqrt((nx - sub_x) ** 2 + (ny - sub_y) ** 2)
                            if d_center < min_dist:
                                min_dist = d_center
                                best_pos = (nx, ny)
                if best_pos:
                    packed_leaves.append(
                        {"name": leaf_name, "value": leaf_value, "r": leaf_r, "x": best_pos[0], "y": best_pos[1]}
                    )

        for leaf in packed_leaves:
            all_circles.append(
                {
                    "x": leaf["x"],
                    "y": leaf["y"],
                    "r": leaf["r"],
                    "label": leaf["name"],
                    "value": leaf["value"],
                    "color": sub_color,
                    "level": 2,
                    "parent": sub["name"],
                }
            )

# Create figure
fig = go.Figure()

# Draw circles by level (background to foreground)
for level in [-1, 0, 1, 2]:
    for circle in all_circles:
        if circle["level"] == level:
            if level == -1:
                opacity, line_width = 0.08, 4
            elif level == 0:
                opacity, line_width = 0.8, 4
            elif level == 1:
                opacity, line_width = 0.7, 3
            else:
                opacity, line_width = 0.85, 2

            fig.add_shape(
                type="circle",
                xref="x",
                yref="y",
                x0=circle["x"] - circle["r"],
                y0=circle["y"] - circle["r"],
                x1=circle["x"] + circle["r"],
                y1=circle["y"] + circle["r"],
                fillcolor=circle["color"],
                opacity=opacity,
                line={"color": INK_SOFT, "width": line_width},
            )

# Add labels
for circle in all_circles:
    level = circle["level"]

    if level == -1:
        fig.add_annotation(
            x=circle["x"],
            y=circle["y"] - circle["r"] * 0.88,
            text=f"<b>{circle['label']}</b><br>${circle['value']:,.0f}",
            showarrow=False,
            font={"size": 22, "color": INK},
        )
    elif level == 0:
        fig.add_annotation(
            x=circle["x"],
            y=circle["y"] + circle["r"] * 0.7,
            text=f"<b>{circle['label']}</b>",
            showarrow=False,
            font={"size": 18, "color": INK},
        )
        fig.add_annotation(
            x=circle["x"],
            y=circle["y"] + circle["r"] * 0.5,
            text=f"${circle['value']:,.0f}",
            showarrow=False,
            font={"size": 14, "color": INK_SOFT},
        )
    elif level == 1 and circle["r"] > 30:
        fig.add_annotation(
            x=circle["x"], y=circle["y"], text=f"{circle['label']}", showarrow=False, font={"size": 13, "color": INK}
        )
    elif level == 2 and circle["r"] > 12:
        fig.add_annotation(
            x=circle["x"], y=circle["y"], text=circle["label"], showarrow=False, font={"size": 10, "color": INK_SOFT}
        )

# Add hover traces for interactivity
for circle in all_circles:
    level_names = {-1: "Portfolio", 0: "Asset Class", 1: "Category", 2: "Holding"}
    fig.add_trace(
        go.Scatter(
            x=[circle["x"]],
            y=[circle["y"]],
            mode="markers",
            marker={"size": max(circle["r"], 12), "opacity": 0},
            hovertemplate=f"<b>{circle['label']}</b><br>{level_names[circle['level']]}: ${circle['value']:,.0f}<extra></extra>",
            showlegend=False,
        )
    )

# Add legend traces for asset classes
for idx, (name, _, _) in enumerate(asset_data):
    fig.add_trace(
        go.Scatter(
            x=[None],
            y=[None],
            mode="markers",
            marker={"size": 16, "color": IMPRINT[idx % len(IMPRINT)], "line": {"color": INK_SOFT, "width": 2}},
            name=name,
            showlegend=True,
        )
    )

# Layout
fig.update_layout(
    title={
        "text": "circlepacking-basic · plotly · anyplot.ai",
        "font": {"size": 28, "color": INK},
        "x": 0.5,
        "xanchor": "center",
        "y": 0.97,
    },
    xaxis={
        "showgrid": False,
        "zeroline": False,
        "showticklabels": False,
        "range": [-550, 550],
        "scaleanchor": "y",
        "scaleratio": 1,
    },
    yaxis={"showgrid": False, "zeroline": False, "showticklabels": False, "range": [-550, 550]},
    plot_bgcolor=PAGE_BG,
    paper_bgcolor=PAGE_BG,
    margin={"t": 80, "l": 40, "r": 40, "b": 40},
    showlegend=True,
    legend={
        "x": 0.98,
        "y": 0.98,
        "xanchor": "right",
        "yanchor": "top",
        "bgcolor": ELEVATED_BG,
        "bordercolor": INK_SOFT,
        "borderwidth": 2,
        "font": {"size": 14, "color": INK_SOFT},
        "title": {"text": "Asset Classes", "font": {"size": 16, "color": INK}},
    },
)

# Save outputs
fig.write_image(f"plot-{THEME}.png", width=1600, height=900, scale=3)
fig.write_html(f"plot-{THEME}.html", include_plotlyjs="cdn")
Runnable source as JSON, for any HTTP client: https://api.anyplot.ai/specs/circlepacking-basic/plotly/code. Any spec id and library id listed in llms-full.txt fit the same URL shape; every URL below is complete and callable.
{
  "spec_id": "circlepacking-basic",
  "language": "python",
  "library": "plotly",
  "page": "https://anyplot.ai/circlepacking-basic/python/plotly",
  "hub": "https://anyplot.ai/circlepacking-basic",
  "code_json": "https://api.anyplot.ai/specs/circlepacking-basic/plotly/code",
  "spec_json": "https://api.anyplot.ai/specs/circlepacking-basic",
  "render_light_png": "https://storage.googleapis.com/anyplot-images/plots/circlepacking-basic/python/plotly/plot-light.png",
  "render_dark_png": "https://storage.googleapis.com/anyplot-images/plots/circlepacking-basic/python/plotly/plot-dark.png",
  "interactive_light_html": "https://storage.googleapis.com/anyplot-images/plots/circlepacking-basic/python/plotly/plot-light.html",
  "interactive_dark_html": "https://storage.googleapis.com/anyplot-images/plots/circlepacking-basic/python/plotly/plot-dark.html",
  "quality_score": 94.0,
  "license": "MIT",
  "guide": "https://anyplot.ai/llms.txt"
}
Part of Circle Packing Chart on anyplot.ai.