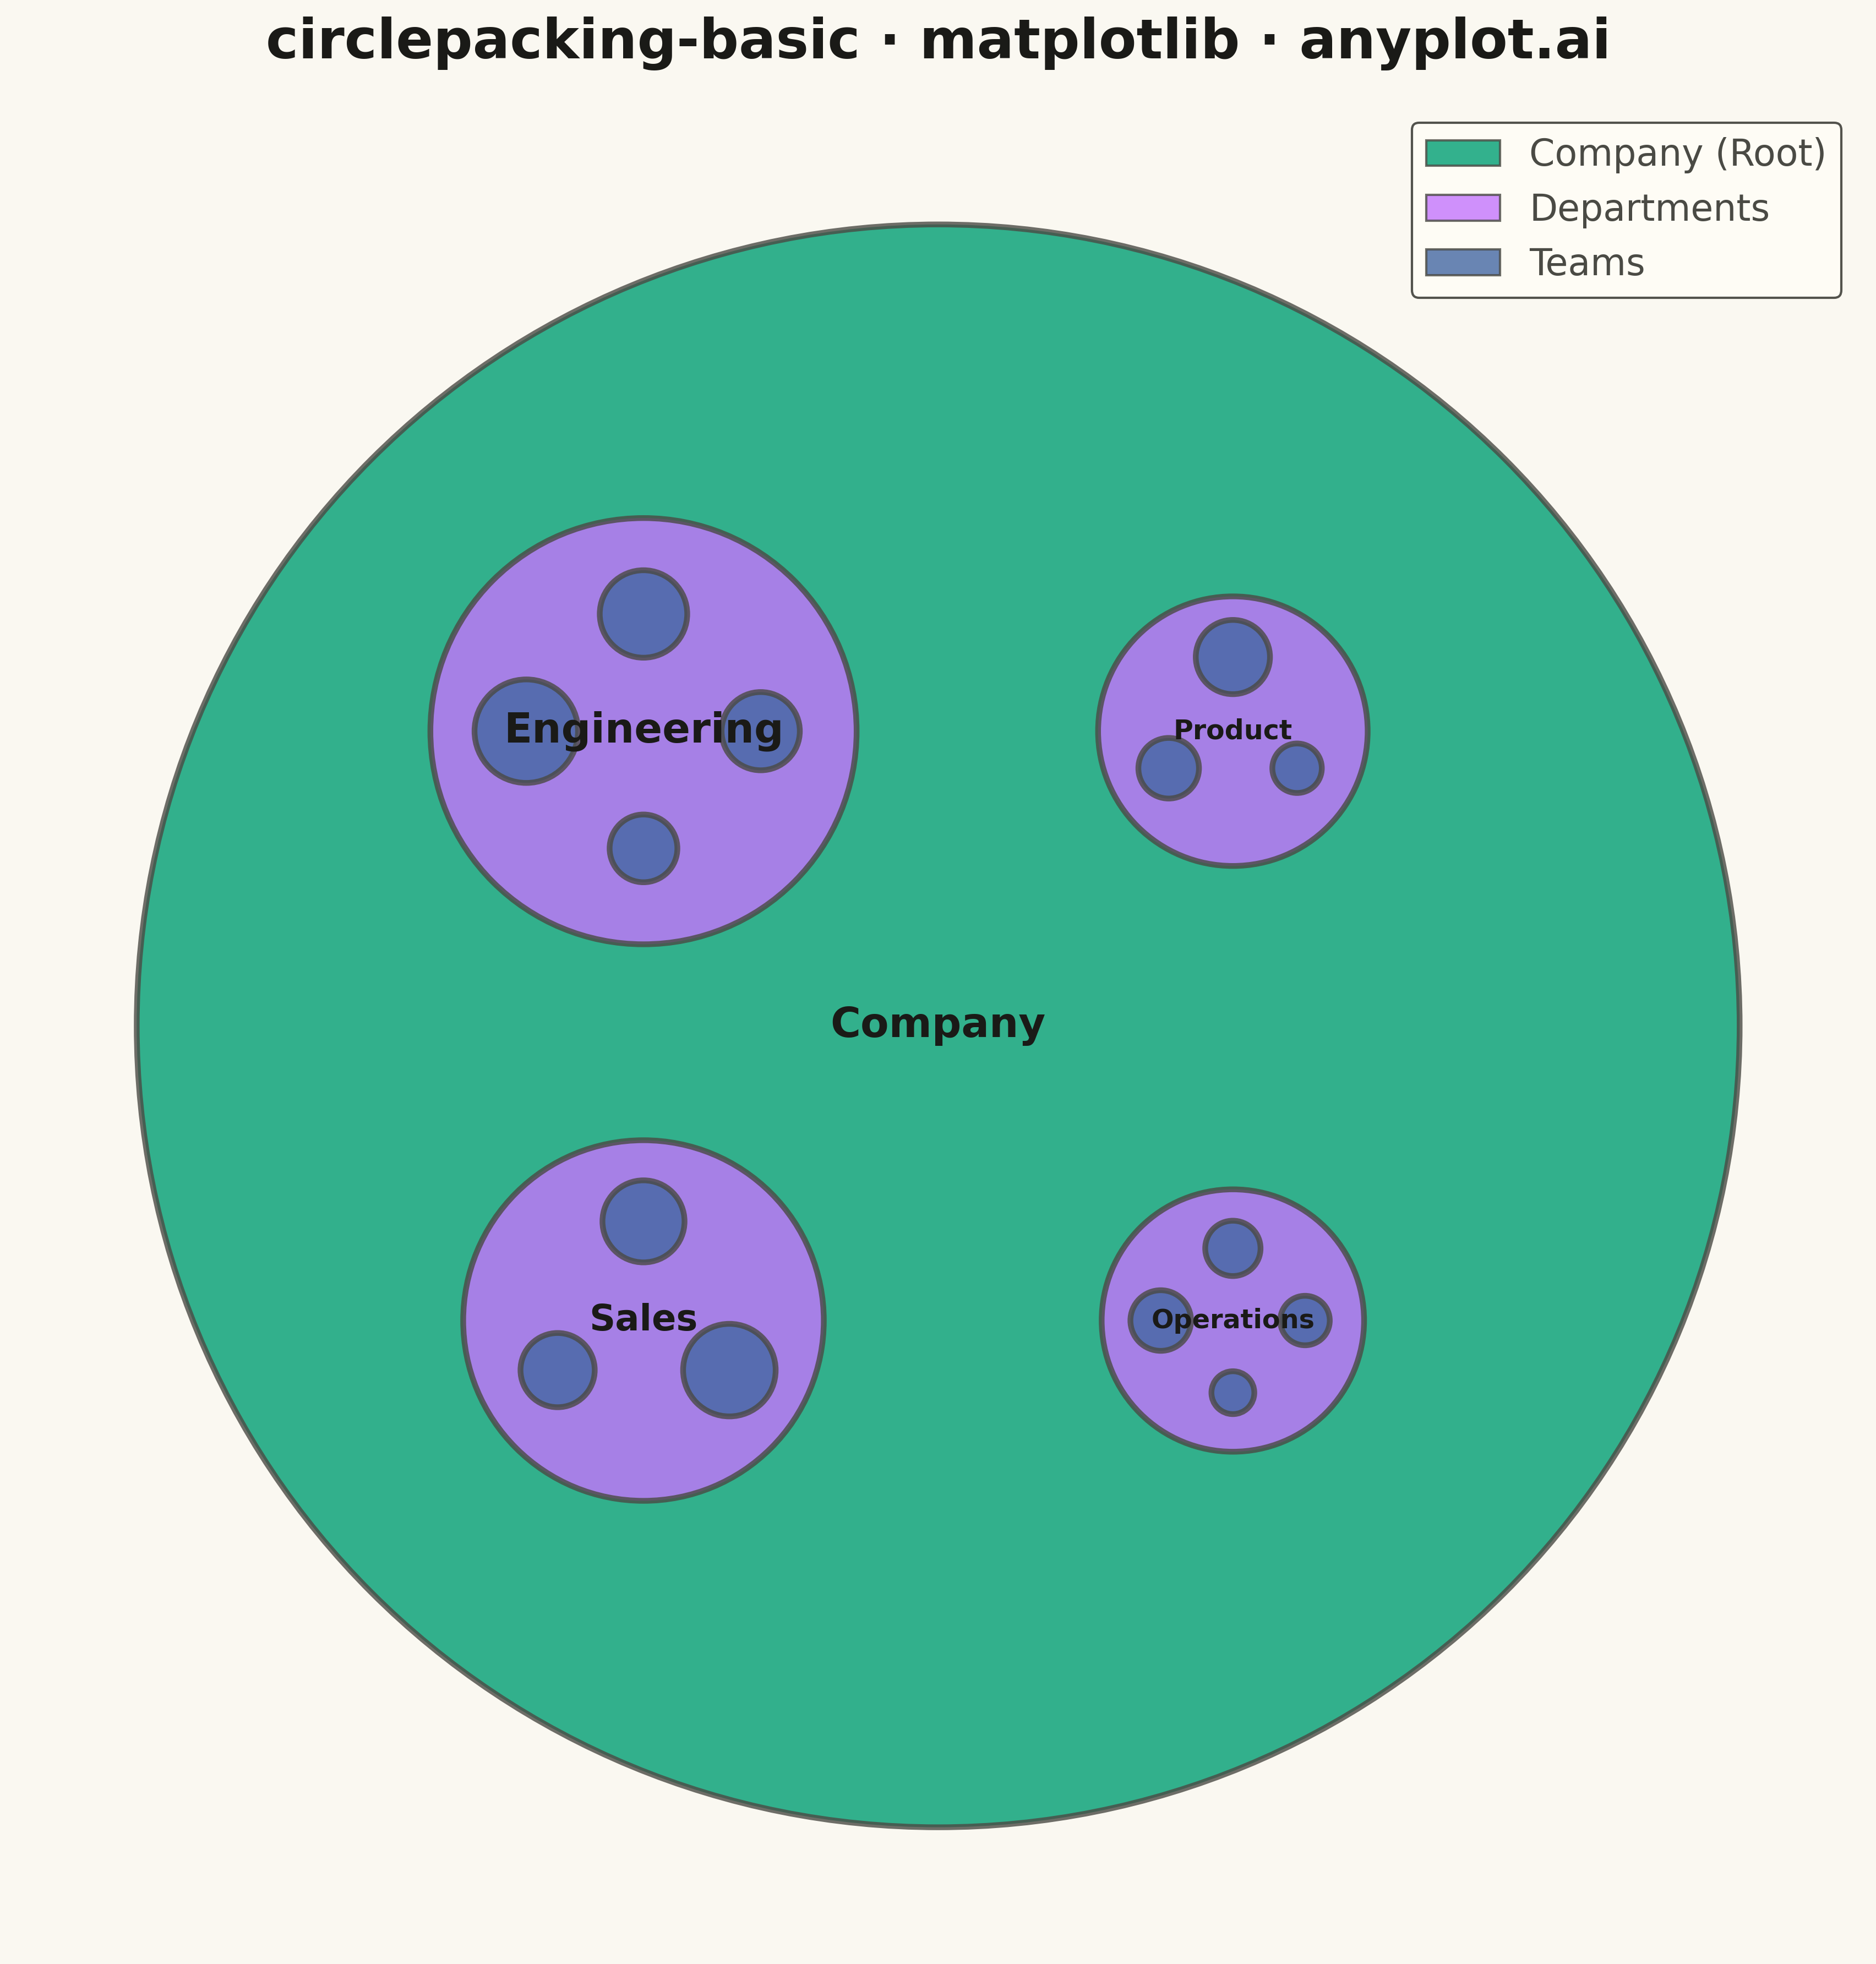
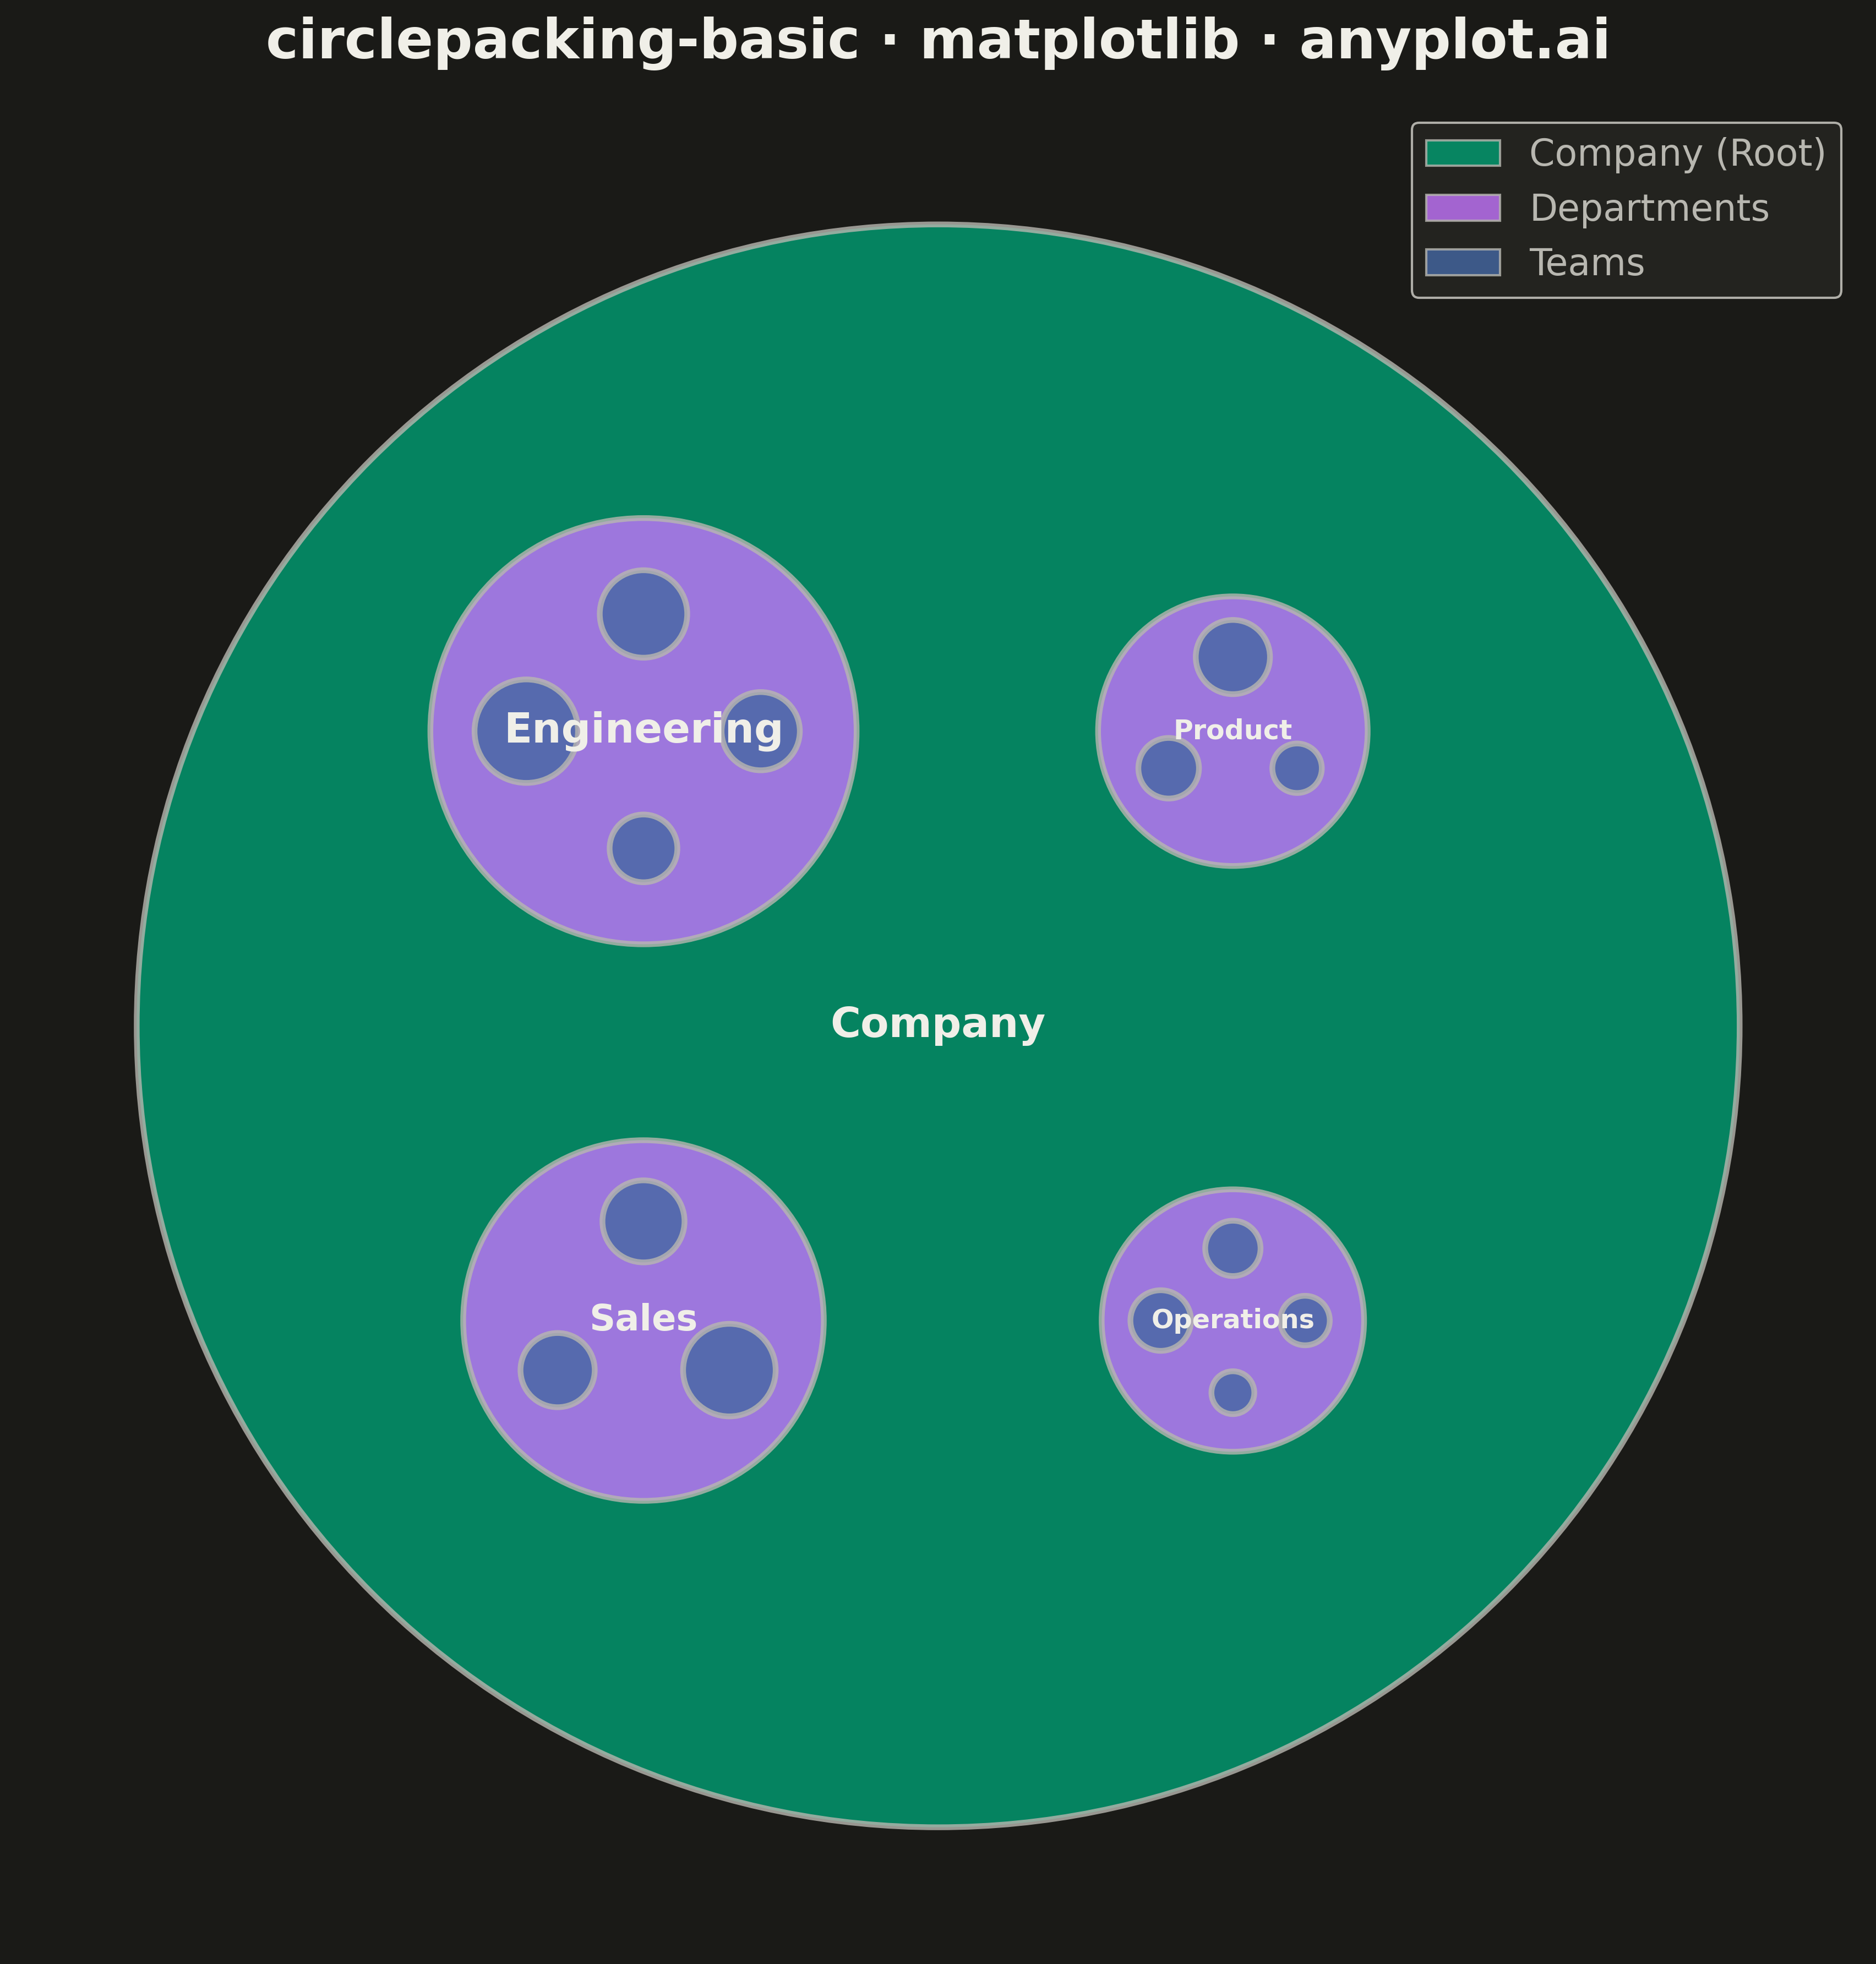
A circle packing chart displays hierarchical data as nested circles, where each circle contains smaller circles representing its children. Circle size is proportional to node value, and circles are packed efficiently without overlap. This visualization excels at revealing hierarchical structures while simultaneously showing quantitative relationships through area encoding.
""" anyplot.ai
circlepacking-basic: Circle Packing Chart
Library: matplotlib 3.10.9 | Python 3.13.13
Quality: 94/100 | Updated: 2026-05-11
"""

import os

import matplotlib.patches as patches
import matplotlib.pyplot as plt
import numpy as np


# Theme tokens
THEME = os.getenv("ANYPLOT_THEME", "light")
PAGE_BG = "#FAF8F1" if THEME == "light" else "#1A1A17"
ELEVATED_BG = "#FFFDF6" if THEME == "light" else "#242420"
INK = "#1A1A17" if THEME == "light" else "#F0EFE8"
INK_SOFT = "#4A4A44" if THEME == "light" else "#B8B7B0"
INK_MUTED = "#6B6A63" if THEME == "light" else "#A8A79F"
BRAND = "#009E73"

# Set random seed for reproducibility
np.random.seed(42)

# Hierarchical data: Company departments with team sizes
hierarchy_data = [
    ("Company", None, 0),
    ("Engineering", "Company", 1),
    ("Product", "Company", 1),
    ("Operations", "Company", 1),
    ("Sales", "Company", 1),
    ("Frontend", "Engineering", 25),
    ("Backend", "Engineering", 35),
    ("DevOps", "Engineering", 15),
    ("QA", "Engineering", 20),
    ("Design", "Product", 18),
    ("Research", "Product", 12),
    ("PM", "Product", 8),
    ("HR", "Operations", 10),
    ("Finance", "Operations", 12),
    ("Legal", "Operations", 6),
    ("Admin", "Operations", 8),
    ("North", "Sales", 22),
    ("South", "Sales", 18),
    ("Intl", "Sales", 28),
]

# Build node structure
nodes = {}
for name, parent, value in hierarchy_data:
    nodes[name] = {"name": name, "parent": parent, "value": value, "children": []}

# Link children to parents
for name, node in nodes.items():
    if node["parent"]:
        nodes[node["parent"]]["children"].append(name)

# Compute values for branch nodes
for name in ["Engineering", "Product", "Operations", "Sales"]:
    nodes[name]["value"] = sum(nodes[c]["value"] for c in nodes[name]["children"])
nodes["Company"]["value"] = sum(nodes[c]["value"] for c in nodes["Company"]["children"])

# Depth-based colors using Okabe-Ito palette
depth_colors = {
    0: BRAND,  # Root: brand green
    1: "#C475FD",  # Departments: vermillion
    2: "#4467A3",  # Teams: blue
}

# Circle packing layout
circles = []

# Root circle
root_radius = 280
circles.append({"name": "Company", "x": 0, "y": 0, "radius": root_radius, "depth": 0})

# Department positioning
dept_names = ["Engineering", "Product", "Operations", "Sales"]
dept_values = [nodes[d]["value"] for d in dept_names]
total_dept = sum(dept_values)

dept_ring_radius = root_radius * 0.52
dept_angles = [np.pi * 0.75, np.pi * 0.25, -np.pi * 0.25, -np.pi * 0.75]

dept_circles = {}
for i, dept in enumerate(dept_names):
    dept_radius = np.sqrt(dept_values[i] / total_dept) * root_radius * 0.42
    dept_x = dept_ring_radius * np.cos(dept_angles[i])
    dept_y = dept_ring_radius * np.sin(dept_angles[i])
    circles.append({"name": dept, "x": dept_x, "y": dept_y, "radius": dept_radius, "depth": 1})
    dept_circles[dept] = {"x": dept_x, "y": dept_y, "radius": dept_radius}

# Team positioning within each department
for dept in dept_names:
    children = nodes[dept]["children"]
    if not children:
        continue

    parent = dept_circles[dept]
    child_values = [nodes[c]["value"] for c in children]
    total_child = sum(child_values)
    n_children = len(children)

    child_ring_radius = parent["radius"] * 0.55
    angle_step = 2 * np.pi / n_children
    start_angle = np.pi / 2

    for j, child in enumerate(children):
        child_radius = np.sqrt(child_values[j] / total_child) * parent["radius"] * 0.40
        angle = start_angle + j * angle_step
        child_x = parent["x"] + child_ring_radius * np.cos(angle)
        child_y = parent["y"] + child_ring_radius * np.sin(angle)

        # Ensure child stays within parent boundary
        dist_to_parent_center = np.sqrt((child_x - parent["x"]) ** 2 + (child_y - parent["y"]) ** 2)
        max_dist = parent["radius"] - child_radius - 3
        if dist_to_parent_center + child_radius > parent["radius"] - 2:
            scale = max_dist / dist_to_parent_center
            child_x = parent["x"] + (child_x - parent["x"]) * scale
            child_y = parent["y"] + (child_y - parent["y"]) * scale

        circles.append({"name": child, "x": child_x, "y": child_y, "radius": child_radius, "depth": 2})

# Create figure (square format for symmetric visualization)
fig, ax = plt.subplots(figsize=(12, 12), facecolor=PAGE_BG)
ax.set_facecolor(PAGE_BG)

# Draw circles from largest to smallest
circles_sorted = sorted(circles, key=lambda c: -c["radius"])

for circle in circles_sorted:
    color = depth_colors.get(circle["depth"], INK_MUTED)

    circ = patches.Circle(
        (circle["x"], circle["y"]), circle["radius"], facecolor=color, edgecolor=INK_SOFT, linewidth=2.5, alpha=0.8
    )
    ax.add_patch(circ)

    # Add labels for circles that are large enough
    if circle["radius"] > 20:
        fontsize = min(18, max(11, circle["radius"] * 0.25))
        ax.text(
            circle["x"],
            circle["y"],
            circle["name"],
            ha="center",
            va="center",
            fontsize=fontsize,
            fontweight="bold",
            color=INK,
        )

# Set equal aspect ratio and limits
ax.set_aspect("equal")
padding = root_radius * 0.15
ax.set_xlim(-root_radius - padding, root_radius + padding)
ax.set_ylim(-root_radius - padding, root_radius + padding)

# Remove axes for cleaner visualization
ax.axis("off")

# Title
ax.set_title("circlepacking-basic · matplotlib · anyplot.ai", fontsize=24, fontweight="bold", pad=20, color=INK)

# Legend
legend_elements = [
    patches.Patch(facecolor=depth_colors[0], edgecolor=INK_SOFT, alpha=0.8, label="Company (Root)"),
    patches.Patch(facecolor=depth_colors[1], edgecolor=INK_SOFT, alpha=0.8, label="Departments"),
    patches.Patch(facecolor=depth_colors[2], edgecolor=INK_SOFT, alpha=0.8, label="Teams"),
]
leg = ax.legend(handles=legend_elements, loc="upper right", fontsize=16, framealpha=0.95)
leg.get_frame().set_facecolor(ELEVATED_BG)
leg.get_frame().set_edgecolor(INK_SOFT)
for text in leg.get_texts():
    text.set_color(INK_SOFT)

plt.tight_layout()
plt.savefig(f"plot-{THEME}.png", dpi=300, bbox_inches="tight", facecolor=PAGE_BG)
Runnable source as JSON, for any HTTP client: https://api.anyplot.ai/specs/circlepacking-basic/matplotlib/code. Any spec id and library id listed in llms-full.txt fit the same URL shape; every URL below is complete and callable.
{
  "spec_id": "circlepacking-basic",
  "language": "python",
  "library": "matplotlib",
  "page": "https://anyplot.ai/circlepacking-basic/python/matplotlib",
  "hub": "https://anyplot.ai/circlepacking-basic",
  "code_json": "https://api.anyplot.ai/specs/circlepacking-basic/matplotlib/code",
  "spec_json": "https://api.anyplot.ai/specs/circlepacking-basic",
  "render_light_png": "https://storage.googleapis.com/anyplot-images/plots/circlepacking-basic/python/matplotlib/plot-light.png",
  "render_dark_png": "https://storage.googleapis.com/anyplot-images/plots/circlepacking-basic/python/matplotlib/plot-dark.png",
  "quality_score": 94.0,
  "license": "MIT",
  "guide": "https://anyplot.ai/llms.txt"
}
Part of Circle Packing Chart on anyplot.ai.