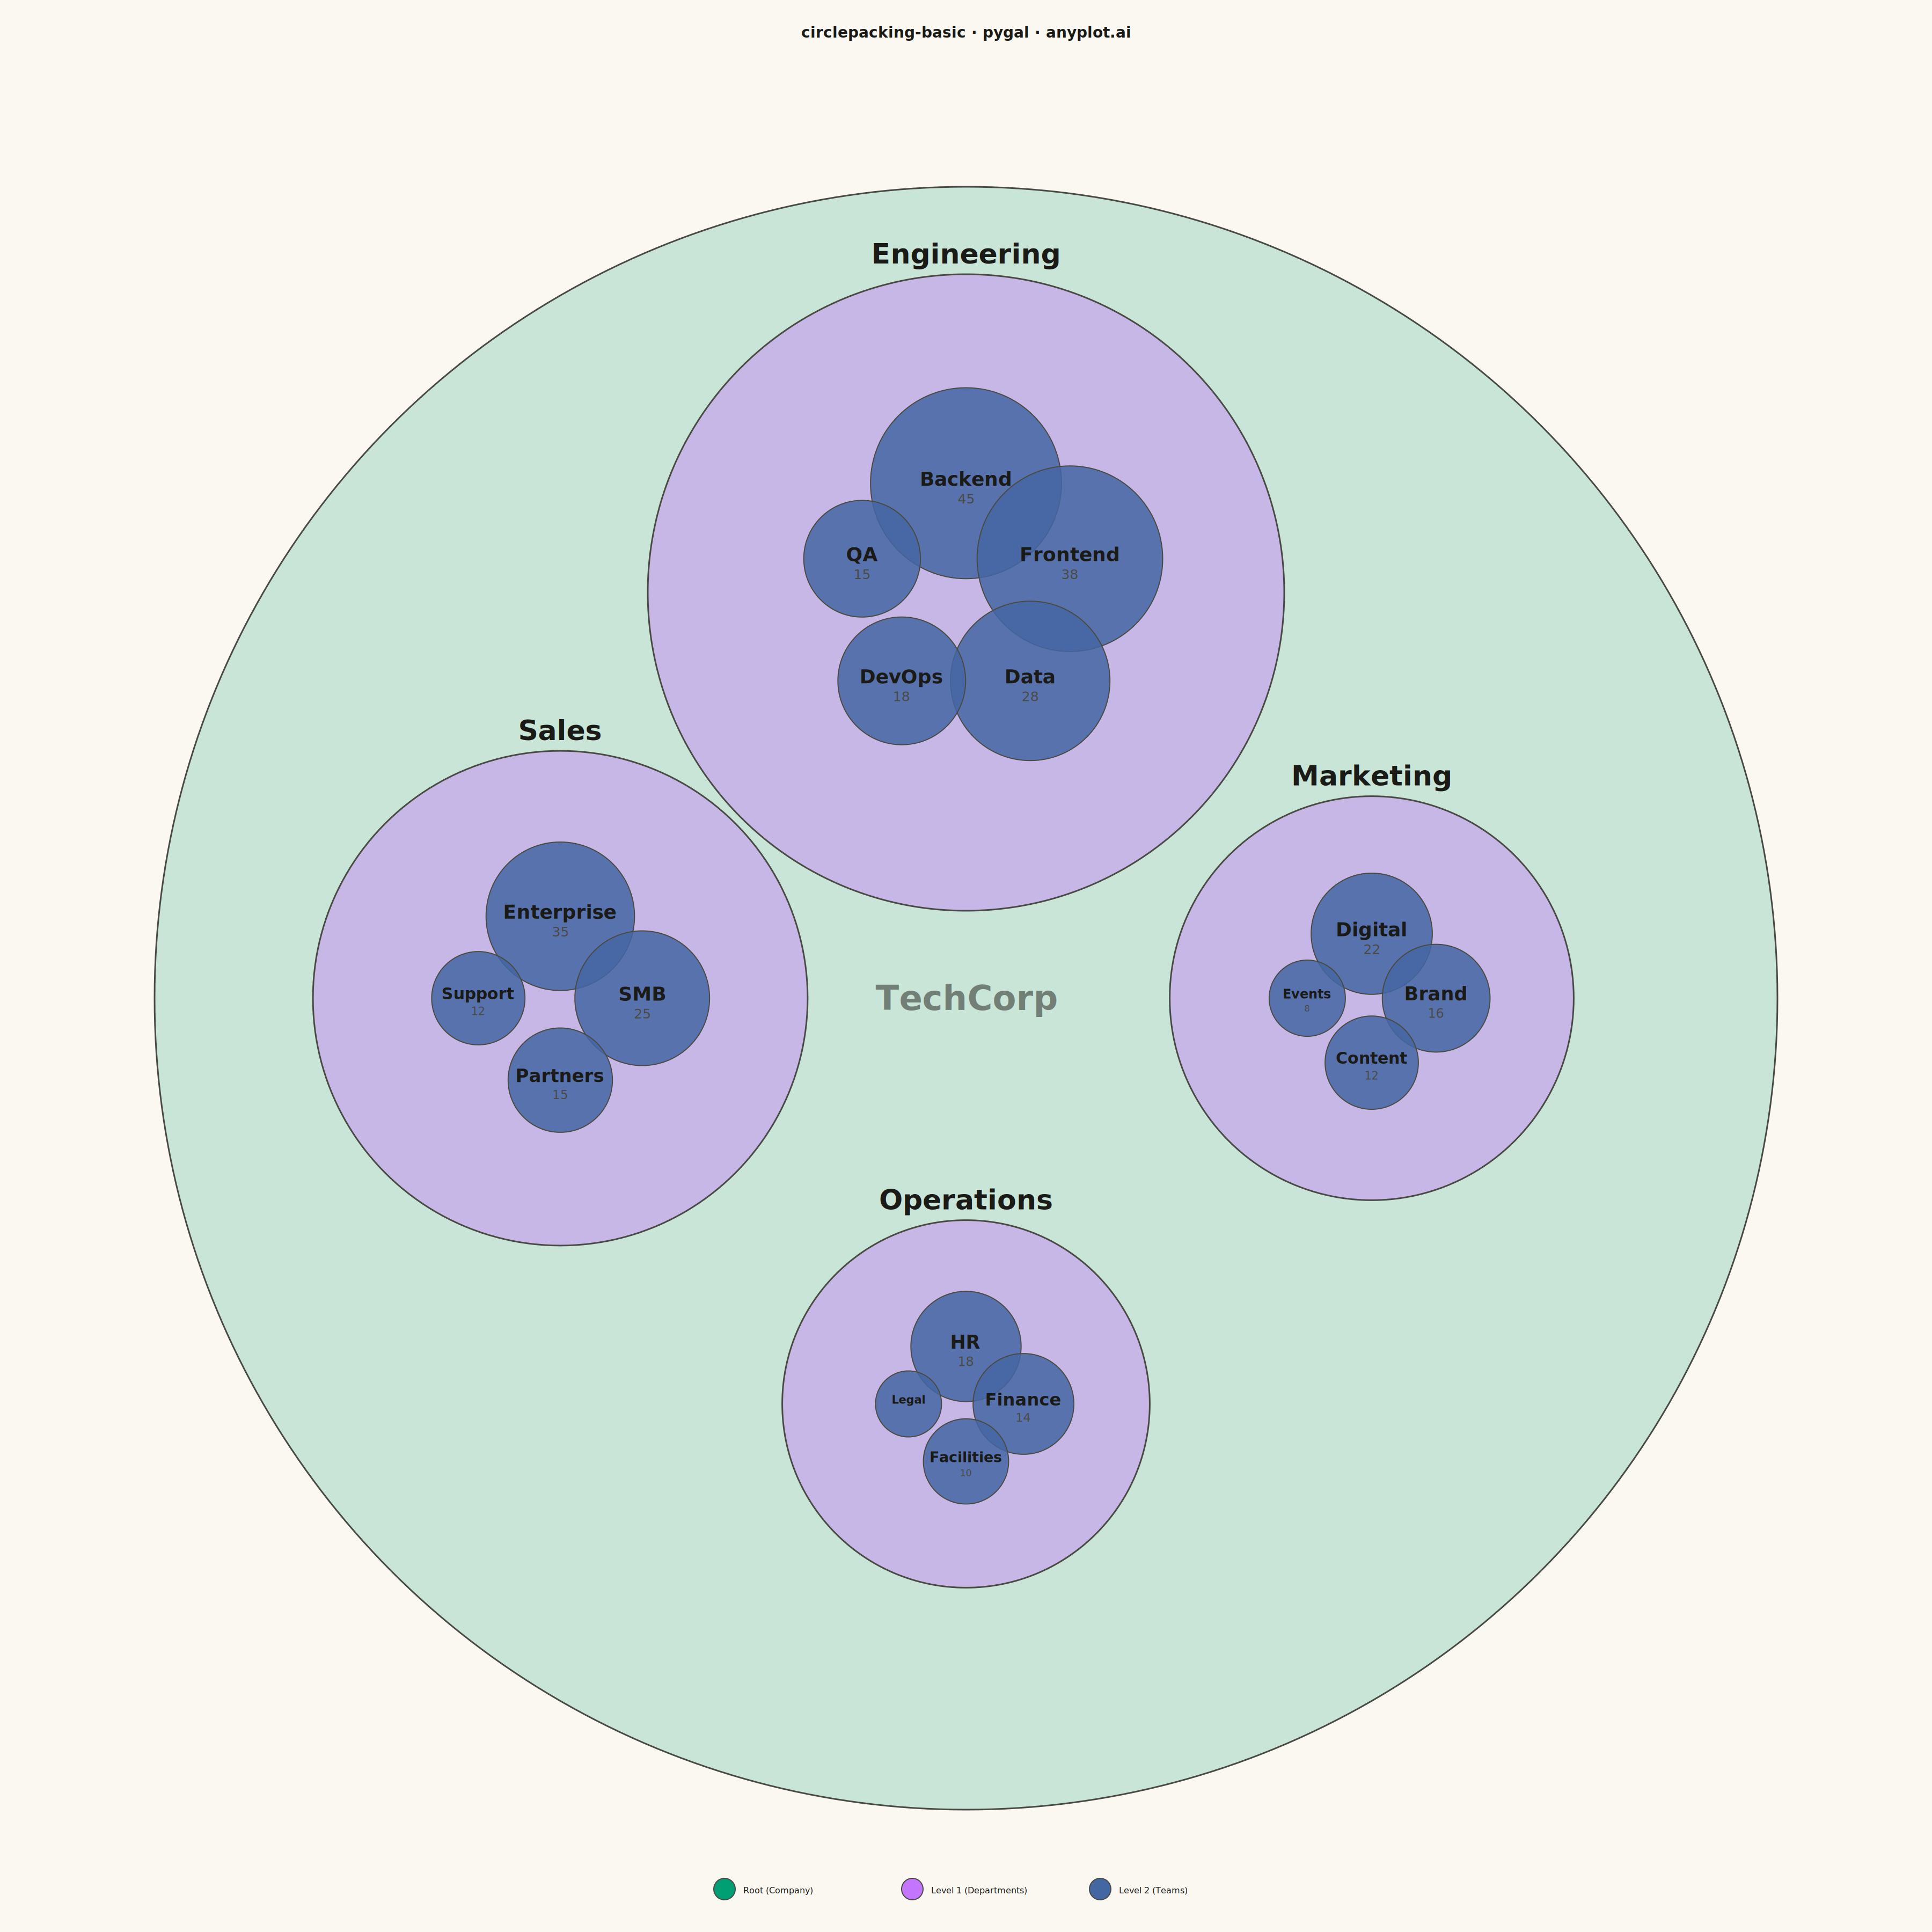
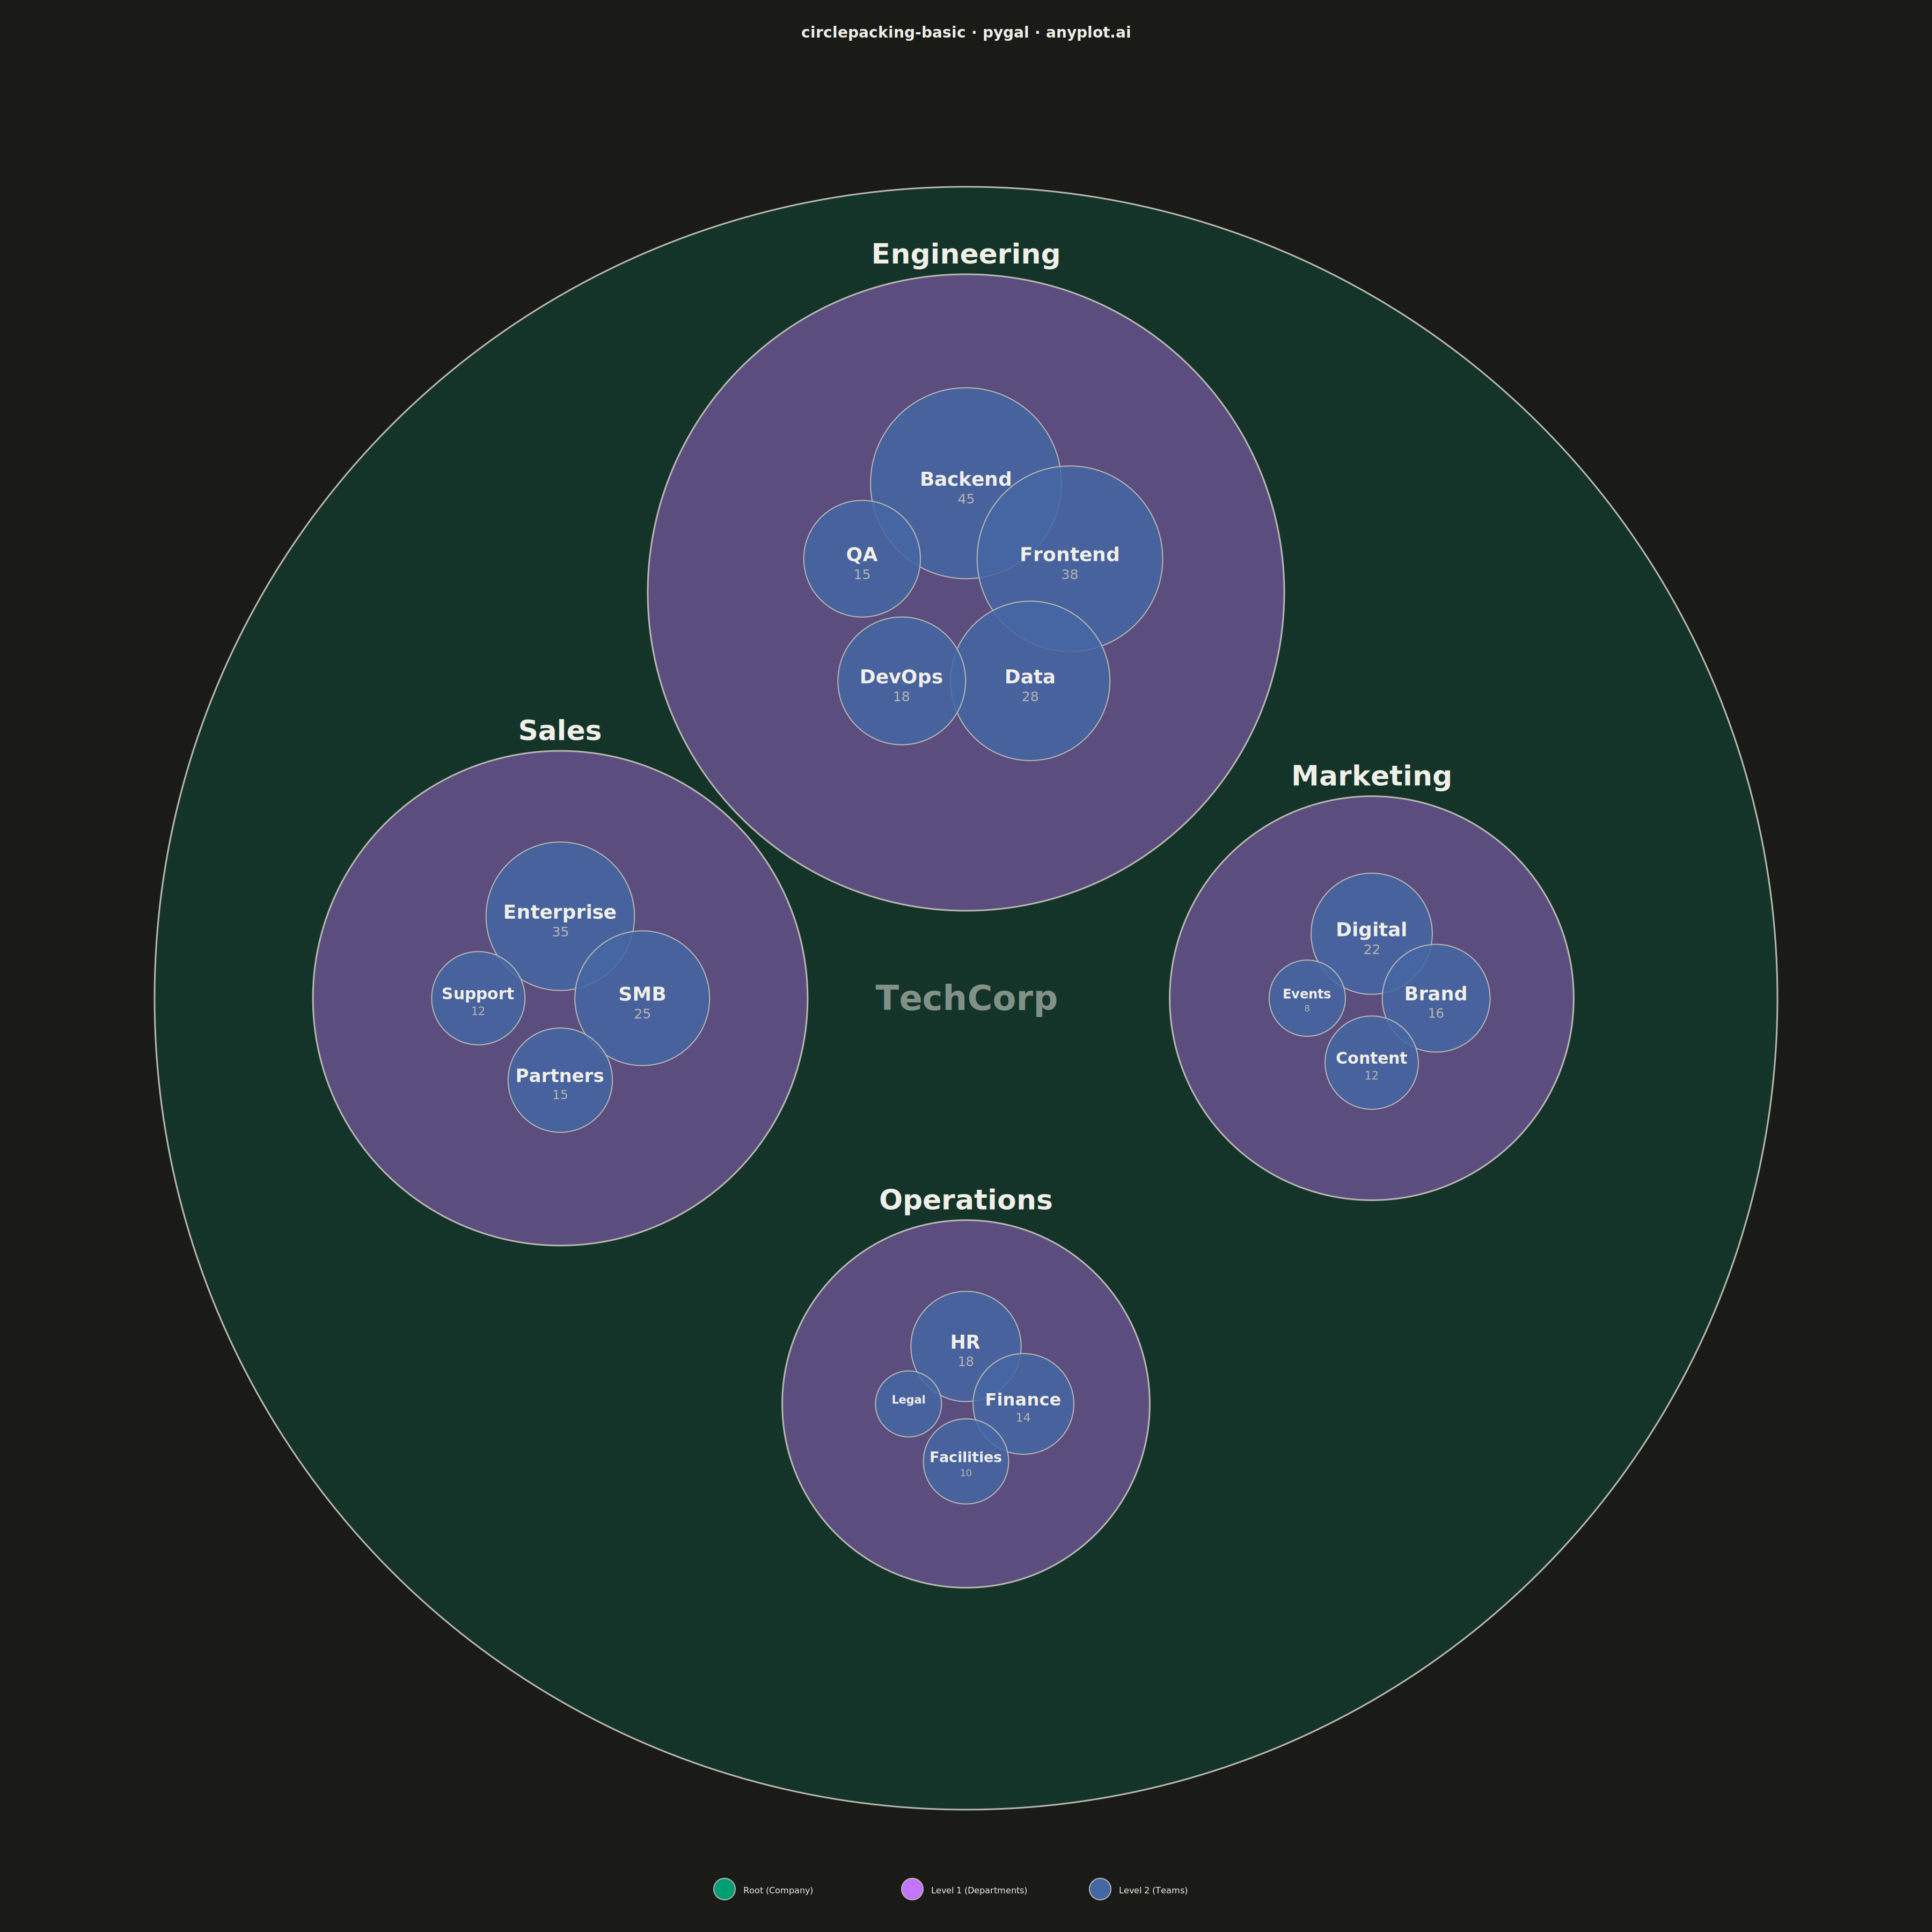
A circle packing chart displays hierarchical data as nested circles, where each circle contains smaller circles representing its children. Circle size is proportional to node value, and circles are packed efficiently without overlap. This visualization excels at revealing hierarchical structures while simultaneously showing quantitative relationships through area encoding.
""" anyplot.ai
circlepacking-basic: Circle Packing Chart
Library: pygal 3.1.0 | Python 3.13.13
Quality: 91/100 | Updated: 2026-05-11
"""

import math
import os
import sys
import xml.etree.ElementTree as ET

import cairosvg


# Import pygal for styling infrastructure
# Remove current directory from path to avoid importing this file as pygal
cwd = os.getcwd()
if cwd in sys.path:
    sys.path.remove(cwd)
if os.path.dirname(os.path.abspath(__file__)) in sys.path:
    sys.path.remove(os.path.dirname(os.path.abspath(__file__)))

from pygal.style import Style


THEME = os.getenv("ANYPLOT_THEME", "light")
PAGE_BG = "#FAF8F1" if THEME == "light" else "#1A1A17"
INK = "#1A1A17" if THEME == "light" else "#F0EFE8"
INK_SOFT = "#4A4A44" if THEME == "light" else "#B8B7B0"
INK_MUTED = "#6B6A63" if THEME == "light" else "#A8A79F"

IMPRINT = ("#009E73", "#C475FD", "#4467A3", "#BD8233", "#AE3030", "#2ABCCD", "#954477")

# Initialize pygal Style for theme-aware styling
custom_style = Style(
    background=PAGE_BG,
    plot_background=PAGE_BG,
    foreground=INK,
    foreground_strong=INK,
    foreground_subtle=INK_MUTED,
    colors=IMPRINT,
    title_font_size=28,
    label_font_size=18,
)

# Hierarchical data - Company structure with headcount per team
hierarchy = [
    ("company", None, None, "TechCorp"),
    ("eng", "company", None, "Engineering"),
    ("mkt", "company", None, "Marketing"),
    ("ops", "company", None, "Operations"),
    ("sales", "company", None, "Sales"),
    ("eng-backend", "eng", 45, "Backend"),
    ("eng-frontend", "eng", 38, "Frontend"),
    ("eng-data", "eng", 28, "Data"),
    ("eng-devops", "eng", 18, "DevOps"),
    ("eng-qa", "eng", 15, "QA"),
    ("mkt-digital", "mkt", 22, "Digital"),
    ("mkt-brand", "mkt", 16, "Brand"),
    ("mkt-content", "mkt", 12, "Content"),
    ("mkt-events", "mkt", 8, "Events"),
    ("ops-hr", "ops", 18, "HR"),
    ("ops-finance", "ops", 14, "Finance"),
    ("ops-facilities", "ops", 10, "Facilities"),
    ("ops-legal", "ops", 6, "Legal"),
    ("sales-enterprise", "sales", 35, "Enterprise"),
    ("sales-smb", "sales", 25, "SMB"),
    ("sales-partners", "sales", 15, "Partners"),
    ("sales-support", "sales", 12, "Support"),
]

# Build tree structure
nodes = {}
for id_, parent, value, label in hierarchy:
    nodes[id_] = {"id": id_, "parent": parent, "value": value, "label": label, "children": []}

for node in nodes.values():
    if node["parent"] and node["parent"] in nodes:
        nodes[node["parent"]]["children"].append(node)

# Calculate values for parent nodes (sum of children)
stack = [nodes["company"]]
order = []
while stack:
    n = stack.pop()
    order.append(n)
    stack.extend(n["children"])
for n in reversed(order):
    if n["value"] is None:
        n["value"] = sum(c["value"] for c in n["children"])

root = nodes["company"]

# Chart dimensions (square for circle packing)
WIDTH = 3600
HEIGHT = 3600
CENTER_X = WIDTH / 2
CENTER_Y = HEIGHT / 2 + 60

# Color palette by depth (using Okabe-Ito for first 3 levels)
DEPTH_COLORS = IMPRINT[:3]

PADDING = 15

# All circles to draw
all_circles = []

# Root circle
root_r = min(WIDTH, HEIGHT) * 0.42
all_circles.append(
    {"x": CENTER_X, "y": CENTER_Y, "r": root_r, "label": root["label"], "value": root["value"], "depth": 0}
)

# Calculate department positions around center
departments = root["children"]
n_depts = len(departments)
total_dept_value = sum(d["value"] for d in departments)

# Calculate radii for each department based on value (area-proportional)
dept_total_area = math.pi * (root_r * 0.60) ** 2
dept_radii = []
for dept in departments:
    dept_area = dept_total_area * (dept["value"] / total_dept_value)
    dept_radii.append(math.sqrt(dept_area / math.pi))

# Position departments in a ring around center
dept_ring_radius = root_r * 0.50
dept_circles = []
for i, dept in enumerate(departments):
    angle = (2 * math.pi * i / n_depts) - math.pi / 2
    r = dept_radii[i]
    x = CENTER_X + dept_ring_radius * math.cos(angle)
    y = CENTER_Y + dept_ring_radius * math.sin(angle)
    dept_circles.append({"node": dept, "x": x, "y": y, "r": r})
    all_circles.append({"x": x, "y": y, "r": r, "label": dept["label"], "value": dept["value"], "depth": 1})

# Pack teams within each department
for dc in dept_circles:
    dept = dc["node"]
    teams = dept["children"]
    if not teams:
        continue

    dept_x, dept_y, dept_r = dc["x"], dc["y"], dc["r"]
    n_teams = len(teams)

    # Sort teams by value (largest first)
    sorted_teams = sorted(teams, key=lambda t: -t["value"])
    total_team_value = sum(t["value"] for t in teams)

    if n_teams == 1:
        # Single team - put at center
        scale_r = dept_r * 0.55
        team_data = [{"node": sorted_teams[0], "r": scale_r, "x": dept_x, "y": dept_y}]
    else:
        # Multiple teams - arrange in optimized positions
        max_single_r = dept_r * 0.30
        team_data = []
        for team in sorted_teams:
            proportion = team["value"] / total_team_value
            tr = min(max_single_r, dept_r * 0.45 * math.sqrt(proportion * n_teams / math.pi))
            team_data.append({"node": team, "r": tr, "x": 0.0, "y": 0.0})

        # Ring radius for teams
        max_team_r = max(td["r"] for td in team_data)
        ring_radius = dept_r - max_team_r - PADDING * 3

        # Scale down if needed
        if ring_radius < max_team_r:
            scale = (dept_r * 0.35) / max_team_r
            for td in team_data:
                td["r"] *= scale
            max_team_r = max(td["r"] for td in team_data)
            ring_radius = dept_r - max_team_r - PADDING * 3

        # Place teams around the ring
        for i, td in enumerate(team_data):
            angle = (2 * math.pi * i / n_teams) - math.pi / 2
            td["x"] = dept_x + ring_radius * 0.55 * math.cos(angle)
            td["y"] = dept_y + ring_radius * 0.55 * math.sin(angle)

    # Add team circles
    for tc in team_data:
        all_circles.append(
            {
                "x": tc["x"],
                "y": tc["y"],
                "r": tc["r"],
                "label": tc["node"]["label"],
                "value": tc["node"]["value"],
                "depth": 2,
            }
        )

# Build SVG
svg_ns = "http://www.w3.org/2000/svg"
ET.register_namespace("", svg_ns)

svg_root = ET.Element("svg", xmlns=svg_ns, width=str(WIDTH), height=str(HEIGHT), viewBox=f"0 0 {WIDTH} {HEIGHT}")

# Add background rectangle
bg_rect = ET.SubElement(svg_root, "rect")
bg_rect.set("width", str(WIDTH))
bg_rect.set("height", str(HEIGHT))
bg_rect.set("fill", PAGE_BG)

# Add title
title_elem = ET.SubElement(svg_root, "text")
title_elem.set("x", str(WIDTH / 2))
title_elem.set("y", "70")
title_elem.set("text-anchor", "middle")
title_elem.set("fill", INK)
title_elem.set("font-size", "28px")
title_elem.set("font-family", "sans-serif")
title_elem.set("font-weight", "bold")
title_elem.text = "circlepacking-basic · pygal · anyplot.ai"

# Create main group for circles
g = ET.SubElement(svg_root, "g")
g.set("class", "circle-packing")

# Sort by depth (draw outer circles first)
sorted_circles = sorted(all_circles, key=lambda c: c["depth"])

for circle in sorted_circles:
    depth = circle["depth"]
    color = DEPTH_COLORS[depth]
    opacity = 0.20 if depth == 0 else (0.40 if depth == 1 else 0.85)

    # Circle element
    elem = ET.SubElement(g, "circle")
    elem.set("cx", f"{circle['x']:.1f}")
    elem.set("cy", f"{circle['y']:.1f}")
    elem.set("r", f"{circle['r']:.1f}")
    elem.set("fill", color)
    elem.set("fill-opacity", str(opacity))
    elem.set("stroke", INK_SOFT)
    elem.set("stroke-width", "3" if depth < 2 else "2")

    # Tooltip
    title = ET.SubElement(elem, "title")
    title.text = f"{circle['label']}: {circle['value']} people"

# Draw labels
labels_g = ET.SubElement(svg_root, "g")
labels_g.set("class", "labels")

for circle in sorted_circles:
    depth = circle["depth"]

    if depth == 0:
        # Root label at center
        text = ET.SubElement(labels_g, "text")
        text.set("x", f"{circle['x']:.1f}")
        text.set("y", f"{circle['y']:.1f}")
        text.set("text-anchor", "middle")
        text.set("dominant-baseline", "middle")
        text.set("fill", INK)
        text.set("font-size", "64px")
        text.set("font-family", "sans-serif")
        text.set("font-weight", "bold")
        text.set("opacity", "0.5")
        text.text = circle["label"]
    elif depth == 1:
        # Department label above the circle
        text = ET.SubElement(labels_g, "text")
        text.set("x", f"{circle['x']:.1f}")
        text.set("y", f"{circle['y'] - circle['r'] - 20:.1f}")
        text.set("text-anchor", "middle")
        text.set("fill", INK)
        text.set("font-size", "52px")
        text.set("font-family", "sans-serif")
        text.set("font-weight", "bold")
        text.text = circle["label"]
    elif depth == 2 and circle["r"] > 50:
        # Team label inside circle (only if circle is large enough)
        font_size = int(min(circle["r"] * 0.35, 36))
        text = ET.SubElement(labels_g, "text")
        text.set("x", f"{circle['x']:.1f}")
        text.set("y", f"{circle['y'] - 8:.1f}")
        text.set("text-anchor", "middle")
        text.set("dominant-baseline", "middle")
        text.set("fill", INK)
        text.set("font-size", str(font_size) + "px")
        text.set("font-family", "sans-serif")
        text.set("font-weight", "bold")
        text.text = circle["label"]

        # Value text below label
        if circle["r"] > 65:
            val_text = ET.SubElement(labels_g, "text")
            val_text.set("x", f"{circle['x']:.1f}")
            val_text.set("y", f"{circle['y'] + font_size * 0.8:.1f}")
            val_text.set("text-anchor", "middle")
            val_text.set("dominant-baseline", "middle")
            val_text.set("fill", INK_SOFT)
            val_text.set("font-size", str(int(font_size * 0.7)) + "px")
            val_text.set("font-family", "sans-serif")
            val_text.text = f"{circle['value']}"

# Add legend at bottom
legend_y = HEIGHT - 80
legend_items = [
    ("Root (Company)", DEPTH_COLORS[0]),
    ("Level 1 (Departments)", DEPTH_COLORS[1]),
    ("Level 2 (Teams)", DEPTH_COLORS[2]),
]
legend_x_start = WIDTH / 2 - 450
for i, (label, color) in enumerate(legend_items):
    x = legend_x_start + i * 350
    # Circle marker
    marker = ET.SubElement(svg_root, "circle")
    marker.set("cx", str(x))
    marker.set("cy", str(legend_y))
    marker.set("r", "20")
    marker.set("fill", color)
    marker.set("stroke", INK_SOFT)
    marker.set("stroke-width", "2")
    # Label
    lbl = ET.SubElement(svg_root, "text")
    lbl.set("x", str(x + 35))
    lbl.set("y", str(legend_y + 8))
    lbl.set("fill", INK)
    lbl.set("font-size", "16px")
    lbl.set("font-family", "sans-serif")
    lbl.text = label

# Render to files
svg_output = ET.tostring(svg_root, encoding="unicode")
with open(f"plot-{THEME}.html", "w") as f:
    f.write(svg_output)

cairosvg.svg2png(bytestring=svg_output.encode("utf-8"), write_to=f"plot-{THEME}.png")
Runnable source as JSON, for any HTTP client: https://api.anyplot.ai/specs/circlepacking-basic/pygal/code. Any spec id and library id listed in llms-full.txt fit the same URL shape; every URL below is complete and callable.
{
  "spec_id": "circlepacking-basic",
  "language": "python",
  "library": "pygal",
  "page": "https://anyplot.ai/circlepacking-basic/python/pygal",
  "hub": "https://anyplot.ai/circlepacking-basic",
  "code_json": "https://api.anyplot.ai/specs/circlepacking-basic/pygal/code",
  "spec_json": "https://api.anyplot.ai/specs/circlepacking-basic",
  "render_light_png": "https://storage.googleapis.com/anyplot-images/plots/circlepacking-basic/python/pygal/plot-light.png",
  "render_dark_png": "https://storage.googleapis.com/anyplot-images/plots/circlepacking-basic/python/pygal/plot-dark.png",
  "interactive_light_html": "https://storage.googleapis.com/anyplot-images/plots/circlepacking-basic/python/pygal/plot-light.html",
  "interactive_dark_html": "https://storage.googleapis.com/anyplot-images/plots/circlepacking-basic/python/pygal/plot-dark.html",
  "quality_score": 91.0,
  "license": "MIT",
  "guide": "https://anyplot.ai/llms.txt"
}
Part of Circle Packing Chart on anyplot.ai.