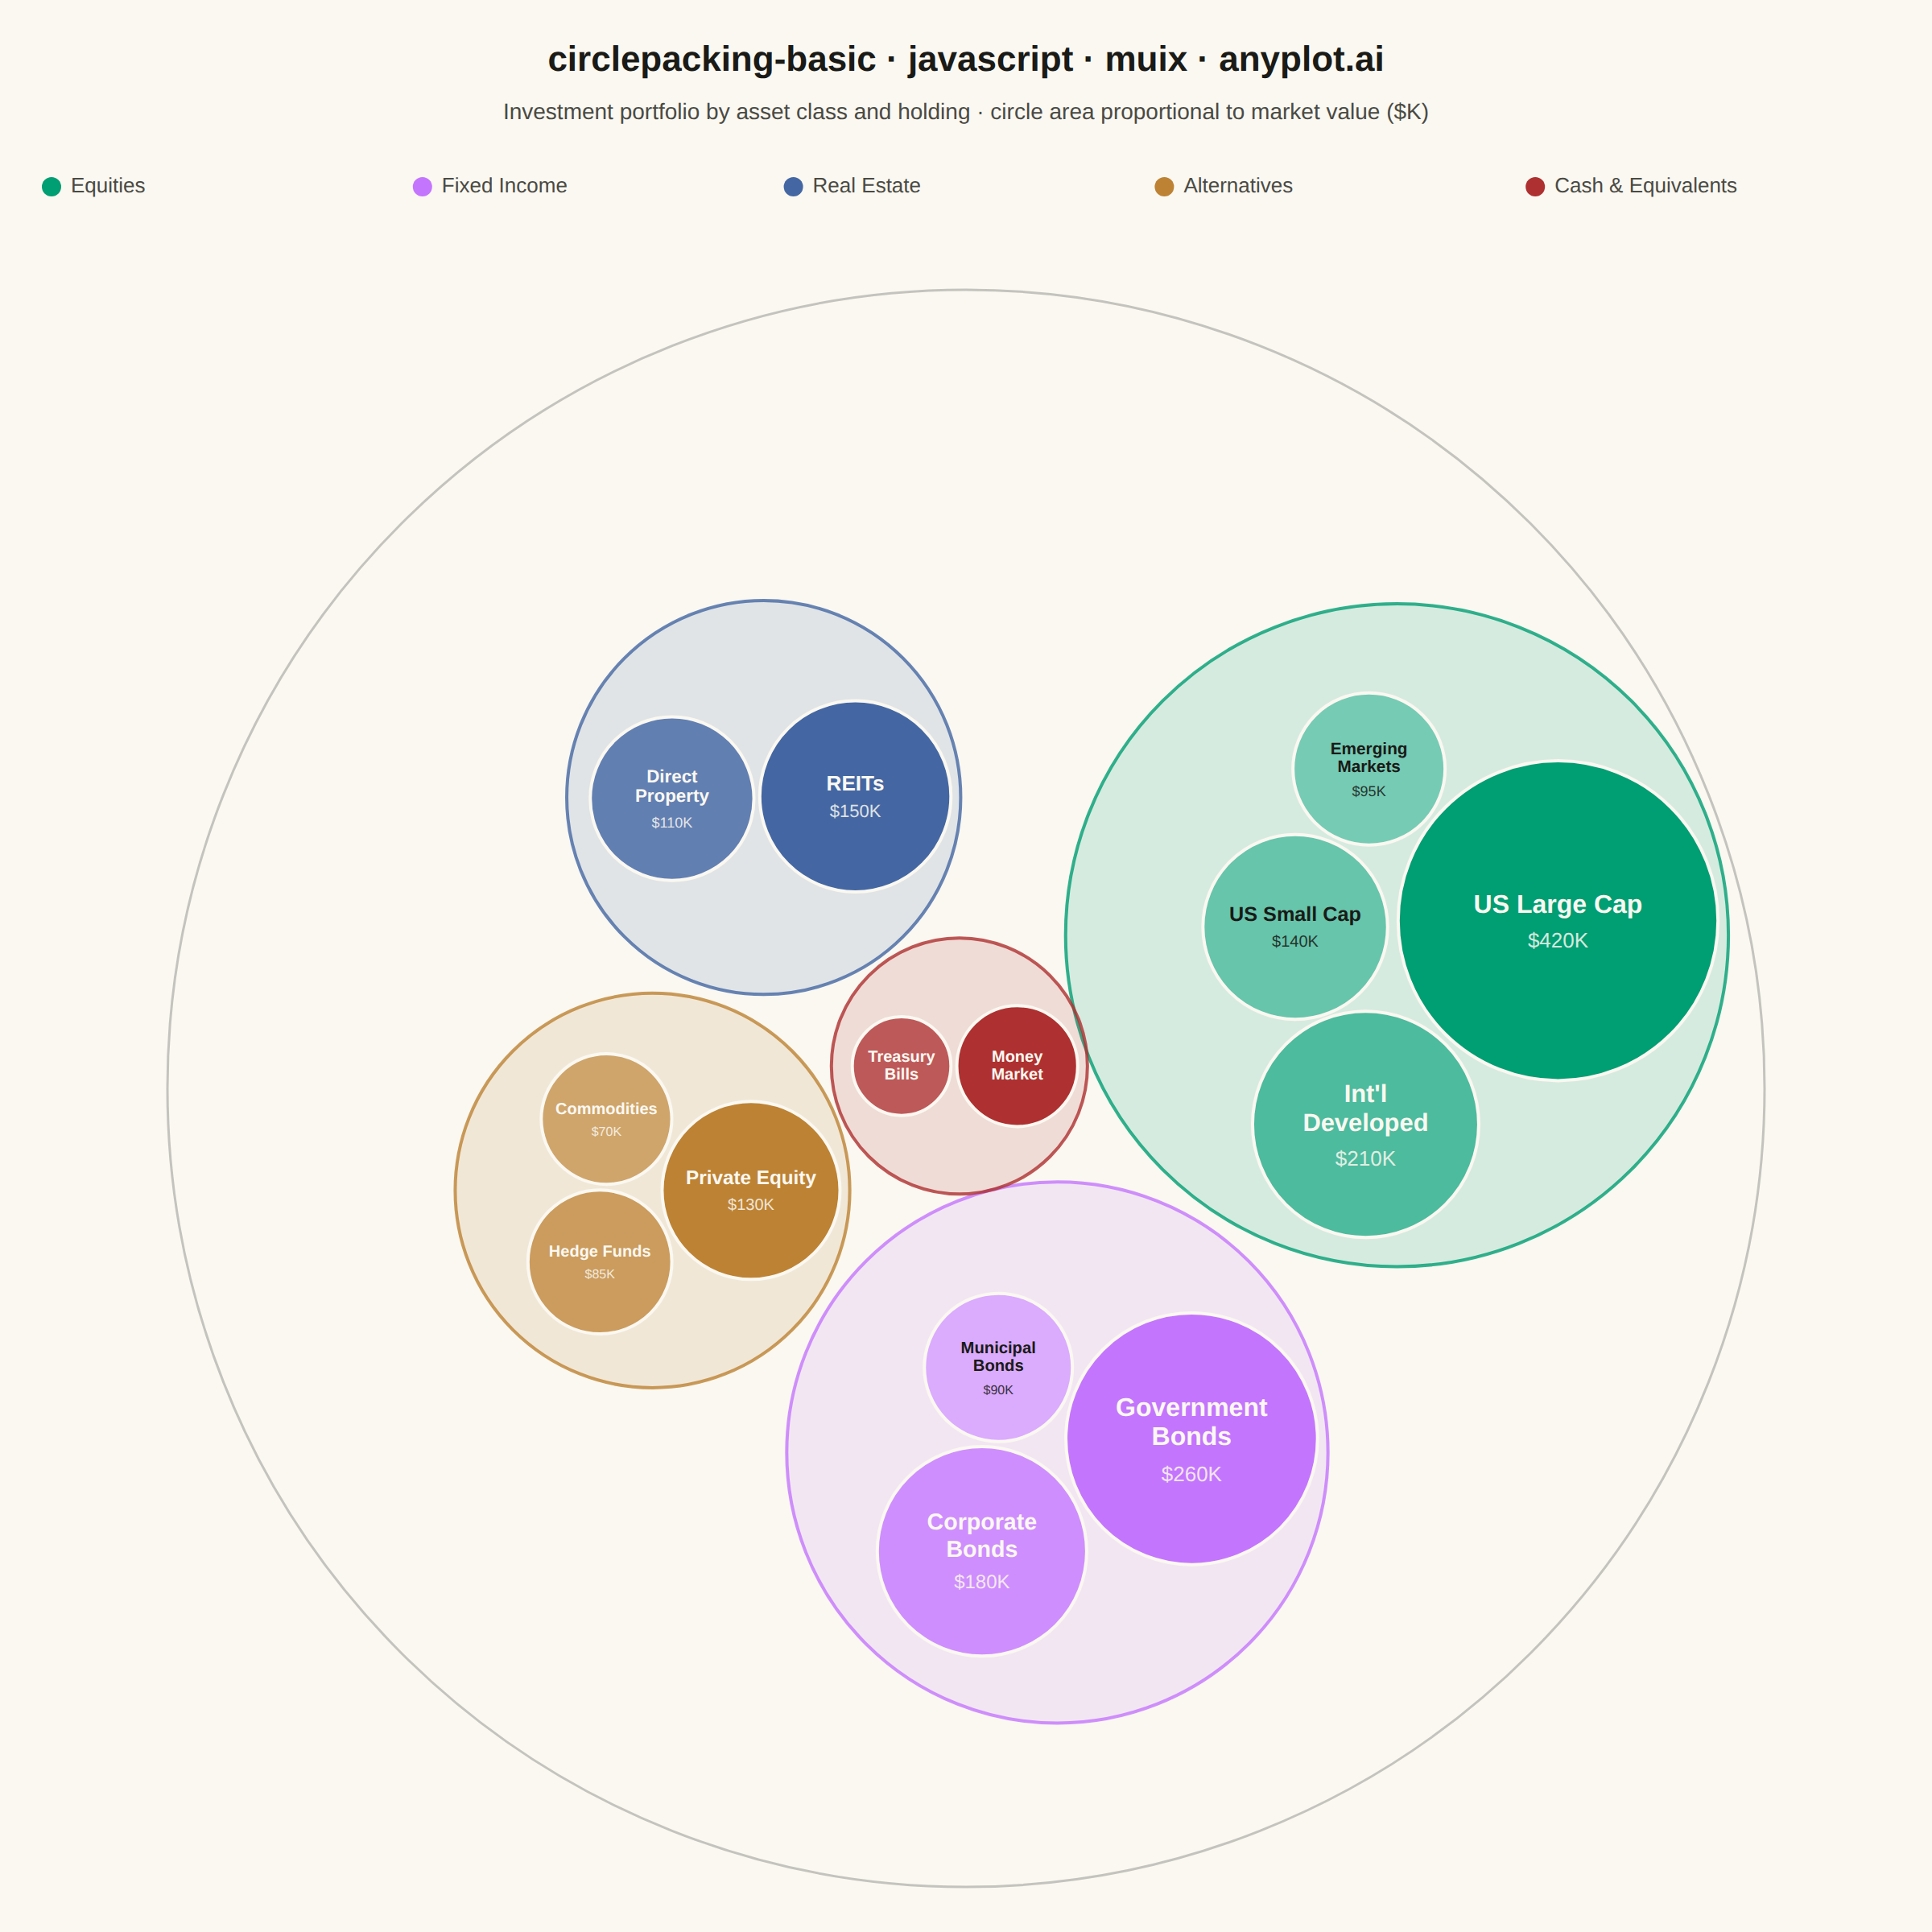
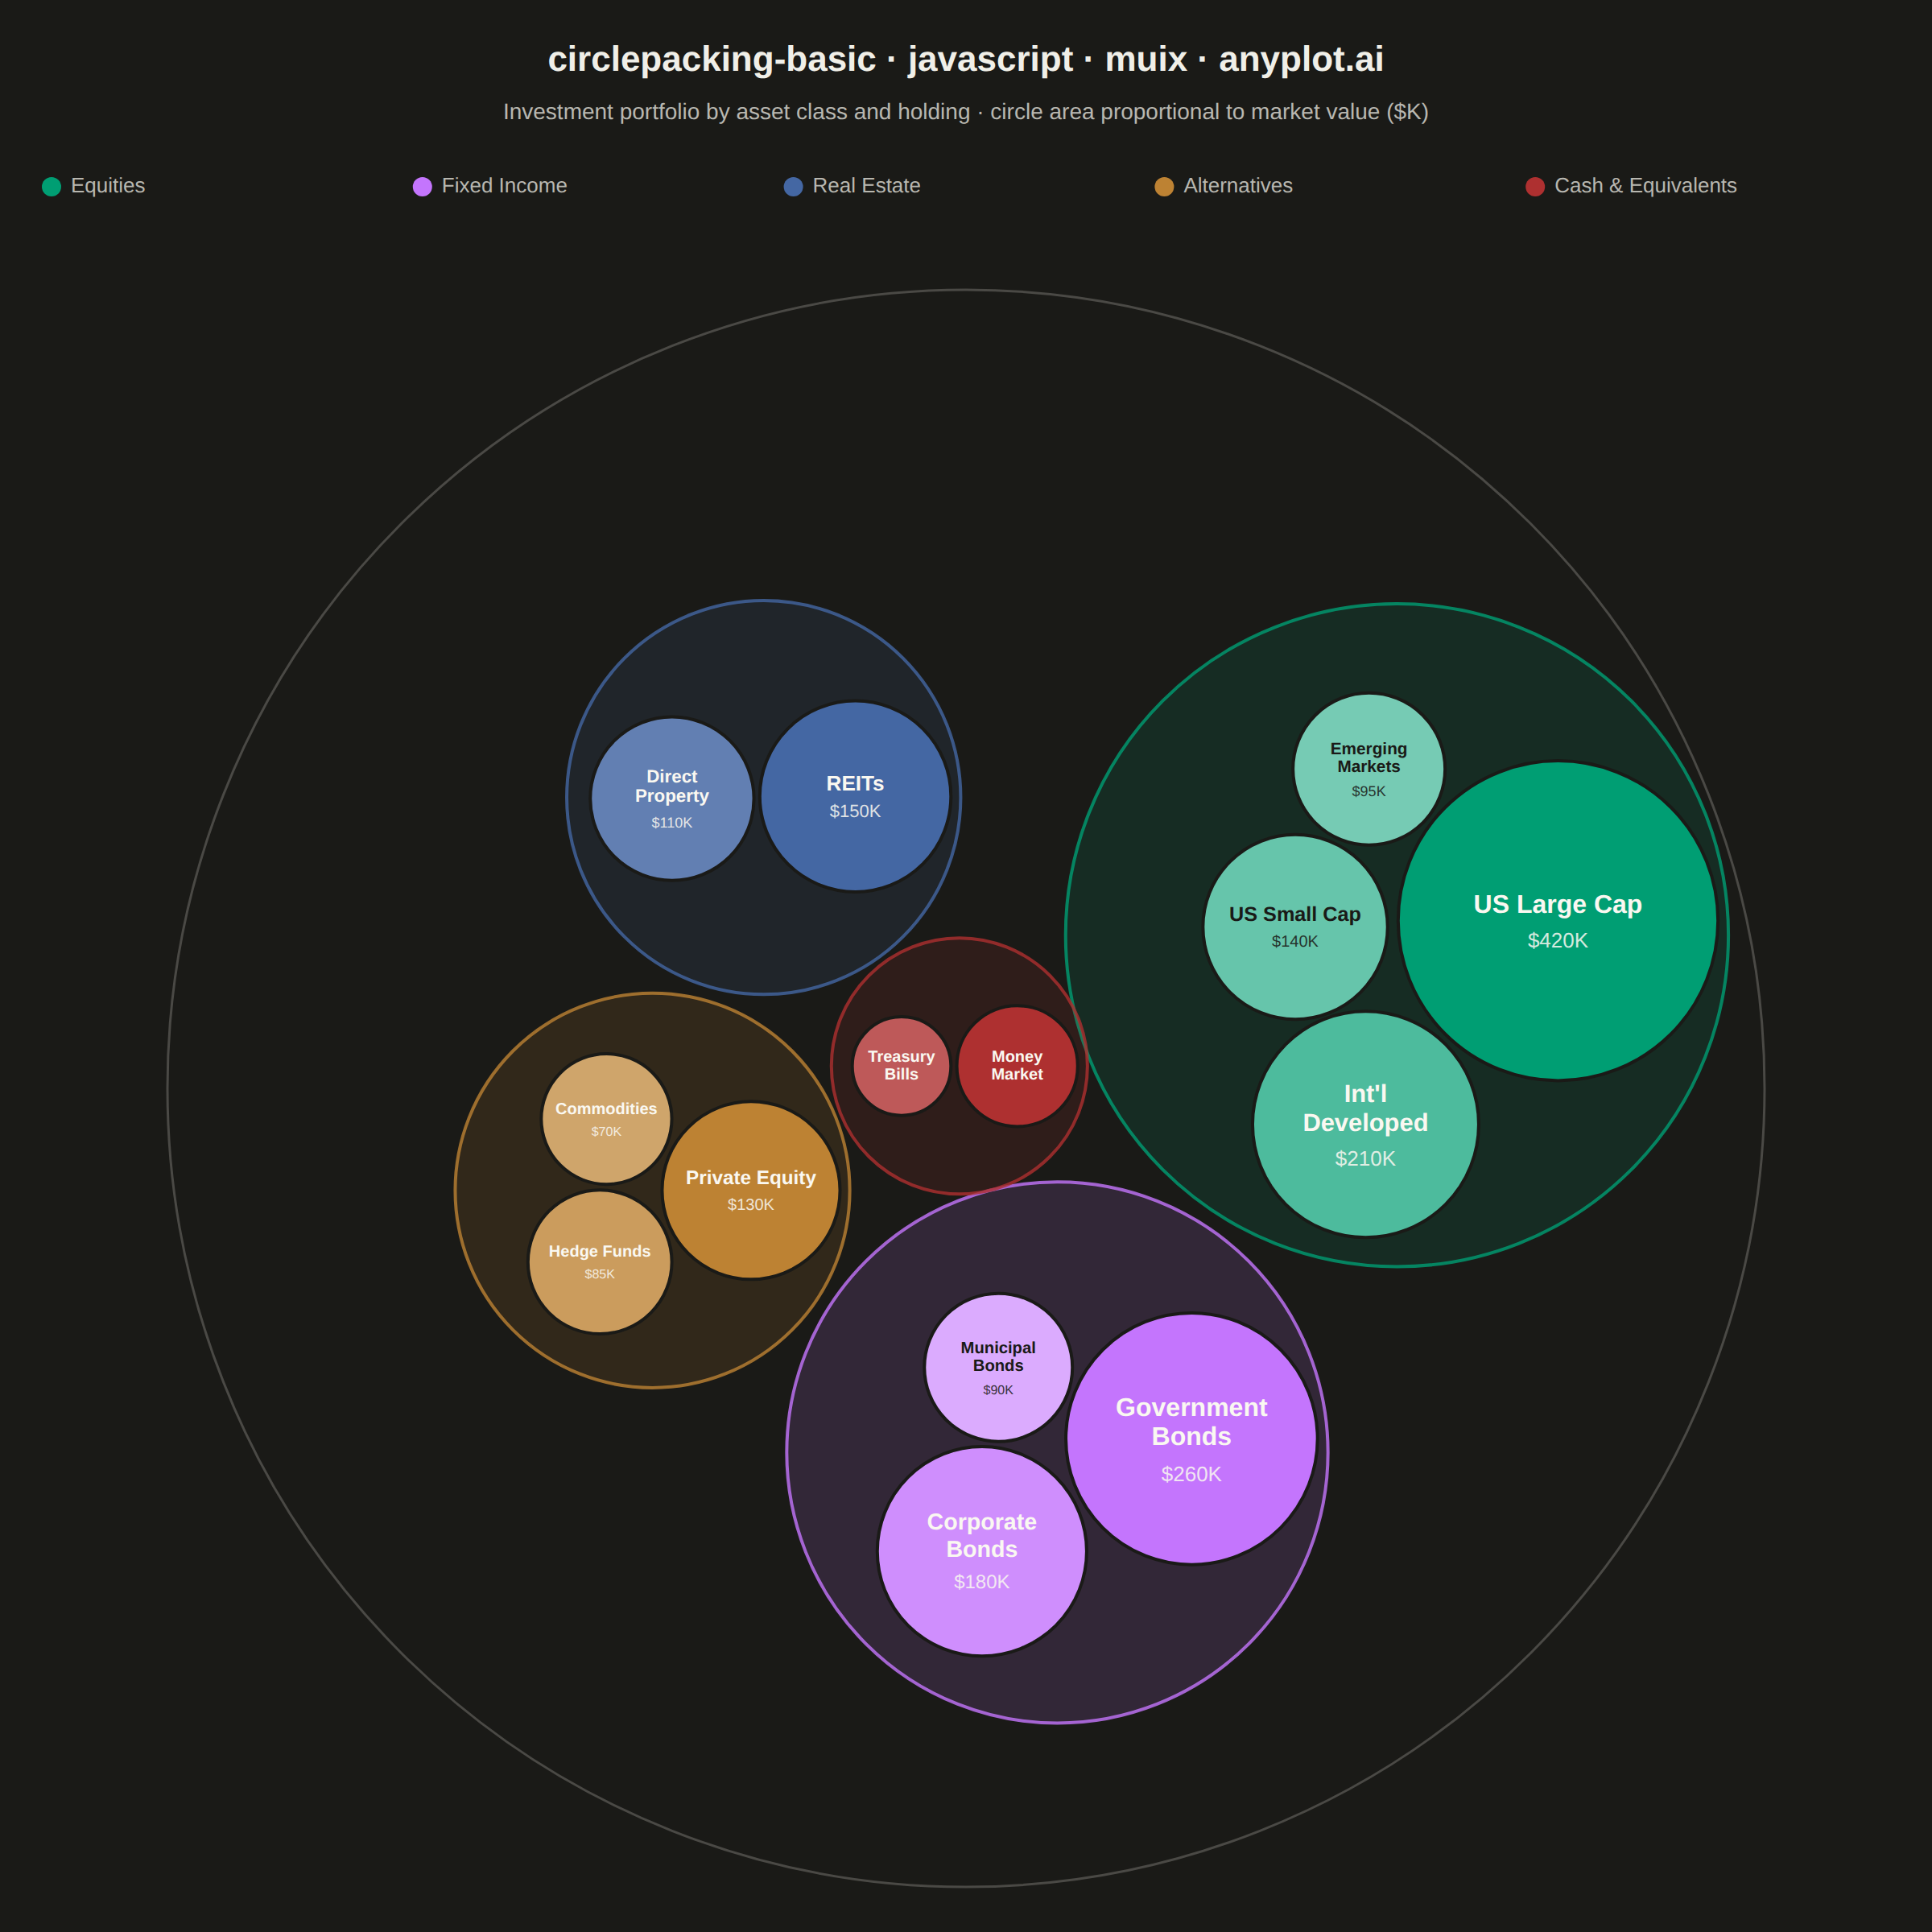
The same plot in 14 other libraries — JavaScript: Chart.js, D3.js, Apache ECharts, Highcharts; Python: Altair, Bokeh, lets-plot, Matplotlib, Plotly, plotnine, Pygal, Seaborn; R: ggplot2; Julia: Makie.jl. Compare all 15 side by side: Circle Packing Chart in Python, R, Julia and JavaScript.
A circle packing chart displays hierarchical data as nested circles, where each circle contains smaller circles representing its children. Circle size is proportional to node value, and circles are packed efficiently without overlap. This visualization excels at revealing hierarchical structures while simultaneously showing quantitative relationships through area encoding.
// anyplot.ai
// circlepacking-basic: Circle Packing Chart
// Library: muix 7.29.1 | JavaScript 22.23.2
// Quality: 92/100 | Created: 2026-09-02
//# anyplot-orientation: square
// anyplot.ai
// circlepacking-basic: Circle Packing Chart
// Library: MUI X Charts | React | Node 22
// License: @mui/x-charts — MIT (community). Pro/Premium are out of scope.
// Quality: pending | Created: 2026-09-02
import { ChartContainer } from "@mui/x-charts/ChartContainer";
import { useDrawingArea } from "@mui/x-charts/hooks";
import { ChartsText } from "@mui/x-charts/ChartsText";

const t = window.ANYPLOT_TOKENS;

const title = "circlepacking-basic · javascript · muix · anyplot.ai";
const TITLE_DEFAULT = 22;
const TITLE_FLOOR = 15;
const titleFontSize = Math.max(TITLE_FLOOR, Math.round(TITLE_DEFAULT * Math.min(1, 67 / title.length)));

// --- Data: investment portfolio composition -- one of the spec's listed
// applications ("breaking down investments by asset class and holdings").
// Flat id/parent/value/label rows, exactly the fields the spec's Data
// section describes; `value` is only present on leaf holdings, matching
// "size value determining circle area (for leaf nodes)". 20 nodes across
// 3 levels: portfolio -> asset class -> holding. -----------------------------
const NODES = [
  { id: "portfolio", parent: null, label: "Portfolio" },
  { id: "equities", parent: "portfolio", label: "Equities" },
  { id: "us-large-cap", parent: "equities", label: "US Large Cap", value: 420 },
  { id: "us-small-cap", parent: "equities", label: "US Small Cap", value: 140 },
  { id: "intl-developed", parent: "equities", label: "Int'l Developed", value: 210 },
  { id: "emerging-markets", parent: "equities", label: "Emerging Markets", value: 95 },
  { id: "fixed-income", parent: "portfolio", label: "Fixed Income" },
  { id: "gov-bonds", parent: "fixed-income", label: "Government Bonds", value: 260 },
  { id: "corp-bonds", parent: "fixed-income", label: "Corporate Bonds", value: 180 },
  { id: "muni-bonds", parent: "fixed-income", label: "Municipal Bonds", value: 90 },
  { id: "real-estate", parent: "portfolio", label: "Real Estate" },
  { id: "reits", parent: "real-estate", label: "REITs", value: 150 },
  { id: "direct-property", parent: "real-estate", label: "Direct Property", value: 110 },
  { id: "alternatives", parent: "portfolio", label: "Alternatives" },
  { id: "private-equity", parent: "alternatives", label: "Private Equity", value: 130 },
  { id: "commodities", parent: "alternatives", label: "Commodities", value: 70 },
  { id: "hedge-funds", parent: "alternatives", label: "Hedge Funds", value: 85 },
  { id: "cash", parent: "portfolio", label: "Cash & Equivalents" },
  { id: "money-market", parent: "cash", label: "Money Market", value: 60 },
  { id: "treasury-bills", parent: "cash", label: "Treasury Bills", value: 40 },
];

function buildTree(nodes) {
  const byId = new Map();
  nodes.forEach((n) => byId.set(n.id, { ...n, children: [] }));
  let treeRoot = null;
  byId.forEach((node) => {
    if (node.parent == null) treeRoot = node;
    else byId.get(node.parent).children.push(node);
  });
  return treeRoot;
}
function computeValue(node) {
  if (node.children.length === 0) return node.value;
  node.value = node.children.reduce((sum, c) => sum + computeValue(c), 0);
  return node.value;
}
const root = buildTree(NODES);
computeValue(root);

// First branch keeps the mandatory brand green; remaining branches follow
// canonical Imprint order (asset classes are abstract categories -- no
// semantic color expectation to override the default order).
root.children.forEach((branch, i) => {
  branch.color = t.palette[i % t.palette.length];
});

// --- Circle packing: the community package has no packing layout of its
// own, so the geometry is a small hand-rolled force simulation -- each
// sibling set is attracted toward its shared local center and pushed apart
// on overlap, then the parent's own radius is set to the enclosing circle
// of its settled children plus padding. Recursing bottom-up produces true
// nested packing (not just flat non-overlapping bubbles). ------------------
function lcg(seed) {
  let state = seed;
  return () => {
    state = (state * 1664525 + 1013904223) % 4294967296;
    return state / 4294967296;
  };
}
const rand = lcg(42);

function packChildren(children) {
  const sorted = [...children].sort((a, b) => b.r - a.r);
  const seedRadius = sorted[0].r * 1.4;
  sorted.forEach((c, i) => {
    const angle = (2 * Math.PI * i) / sorted.length;
    c.x = Math.cos(angle) * seedRadius + (rand() - 0.5) * 4;
    c.y = Math.sin(angle) * seedRadius + (rand() - 0.5) * 4;
  });

  const PADDING = 6;
  const ATTRACTION = 0.02;
  const ITERATIONS = 400;
  for (let iter = 0; iter < ITERATIONS; iter++) {
    for (const c of children) {
      c.x -= c.x * ATTRACTION;
      c.y -= c.y * ATTRACTION;
    }
    for (let i = 0; i < children.length; i++) {
      for (let j = i + 1; j < children.length; j++) {
        const a = children[i];
        const b = children[j];
        const dx = b.x - a.x;
        const dy = b.y - a.y;
        const dist = Math.hypot(dx, dy) || 0.01;
        const minDist = a.r + b.r + PADDING;
        if (dist < minDist) {
          const overlap = (minDist - dist) / 2;
          const ux = dx / dist;
          const uy = dy / dist;
          a.x -= ux * overlap;
          a.y -= uy * overlap;
          b.x += ux * overlap;
          b.y += uy * overlap;
        }
      }
    }
  }

  let enclosing = 0;
  for (const c of children) enclosing = Math.max(enclosing, Math.hypot(c.x, c.y) + c.r);
  return enclosing;
}

const LEAF_RADIUS_SCALE = 8;
const NODE_PADDING = 10;

function layout(node) {
  if (node.children.length === 0) {
    node.r = LEAF_RADIUS_SCALE * Math.sqrt(node.value);
    return;
  }
  node.children.forEach(layout);
  node.r = packChildren(node.children) + NODE_PADDING;
}
layout(root);

function place(node, cx, cy) {
  node.cx = cx;
  node.cy = cy;
  node.children.forEach((c) => place(c, cx + c.x, cy + c.y));
}
place(root, 0, 0);

// --- Color: leaves get a white-mixed tint of their branch's hue, scaled by
// their value relative to the largest sibling, so shade intensity echoes
// relative size within the asset class while the hue keeps the grouping. --
function hexToRgb(hex) {
  const n = parseInt(hex.slice(1), 16);
  return [(n >> 16) & 255, (n >> 8) & 255, n & 255];
}
function relativeLuminance([r, g, b]) {
  const chan = (v) => {
    const c = v / 255;
    return c <= 0.03928 ? c / 12.92 : ((c + 0.055) / 1.055) ** 2.4;
  };
  return 0.2126 * chan(r) + 0.7152 * chan(g) + 0.0722 * chan(b);
}
function mixWithWhite(rgb, factor) {
  return rgb.map((c) => Math.round(c + (255 - c) * factor));
}
function rgbToCss([r, g, b]) {
  return `rgb(${r}, ${g}, ${b})`;
}
function textColorFor(rgb) {
  return relativeLuminance(rgb) > 0.45 ? "#1A1A17" : "#FAF8F1";
}
function truncateLabel(label, maxChars) {
  if (label.length <= maxChars) return label;
  const clipped = label.slice(0, maxChars);
  const lastSpace = clipped.lastIndexOf(" ");
  return lastSpace >= 3 ? `${clipped.slice(0, lastSpace)}…` : `${clipped}…`;
}
// Wrap a two-or-more-word label onto the most balanced two lines that both
// fit `maxCharsPerLine`, so labels like "Corporate Bonds" show in full
// instead of ellipsis-truncating mid-word. Falls back to truncation for
// single-word labels or when no split fits.
function wrapLabel(label, maxCharsPerLine) {
  if (label.length <= maxCharsPerLine) return [label];
  const words = label.split(" ");
  if (words.length < 2) return [truncateLabel(label, maxCharsPerLine)];
  let best = null;
  for (let i = 1; i < words.length; i++) {
    const line1 = words.slice(0, i).join(" ");
    const line2 = words.slice(i).join(" ");
    if (line1.length <= maxCharsPerLine && line2.length <= maxCharsPerLine) {
      const diff = Math.abs(line1.length - line2.length);
      if (!best || diff < best.diff) best = { line1, line2, diff };
    }
  }
  return best ? [best.line1, best.line2] : [truncateLabel(label, maxCharsPerLine)];
}

// --- Legend: branch color identity, read once above the packing area so the
// circles themselves stay uncluttered (no in-circle branch labels fighting
// the child circles they contain). ------------------------------------------
function Legend({ x, y, width: legendWidth }) {
  const itemWidth = legendWidth / root.children.length;
  return (
    <g>
      {root.children.map((branch, i) => {
        const itemX = x + itemWidth * i;
        return (
          <g key={branch.id}>
            <circle cx={itemX + 8} cy={y} r={6} fill={branch.color} />
            <text x={itemX + 20} y={y} dominantBaseline="middle" fontSize={13} fill={t.inkSoft}>
              {branch.label}
            </text>
          </g>
        );
      })}
    </g>
  );
}

// --- Circles: root boundary, branch zones (light fill + colored stroke),
// leaf holdings (solid tint, labeled when large enough). Leaf labels use
// MUI X's own ChartsText primitive (not a raw <text>) so long names wrap
// onto two lines via its native "\n"-line-splitting instead of truncating
// mid-word -- ChartsTooltip/ChartsLegend don't apply here since they key
// off a `series` data model this hand-rolled packing geometry has none of. -

function CirclePacking() {
  const { left, top, width, height } = useDrawingArea();
  const availableRadius = Math.min(width, height) / 2 - 4;
  const scale = availableRadius / root.r;
  const originX = left + width / 2;
  const originY = top + height / 2;

  function project(node) {
    return { cx: originX + node.cx * scale, cy: originY + node.cy * scale, r: node.r * scale };
  }

  const rootCircle = project(root);

  return (
    <g>
      <circle cx={rootCircle.cx} cy={rootCircle.cy} r={rootCircle.r} fill="none" stroke={t.inkSoft} strokeOpacity={0.3} strokeWidth={1.5} />
      {root.children.map((branch) => {
        const b = project(branch);
        const maxLeafValue = Math.max(...branch.children.map((c) => c.value));
        return (
          <g key={branch.id}>
            <circle cx={b.cx} cy={b.cy} r={b.r} fill={branch.color} fillOpacity={0.14} stroke={branch.color} strokeOpacity={0.8} strokeWidth={2}>
              <title>{`${branch.label}: $${branch.value}K`}</title>
            </circle>
            {branch.children.map((leaf) => {
              const l = project(leaf);
              const tintFactor = maxLeafValue > 0 ? (1 - leaf.value / maxLeafValue) * 0.6 : 0;
              const rgb = mixWithWhite(hexToRgb(branch.color), tintFactor);
              const fill = rgbToCss(rgb);
              const ink = textColorFor(rgb);
              const nameSize = Math.max(10, Math.min(16, l.r * 0.22));
              const valueSize = Math.round(nameSize * 0.82);
              const showName = l.r >= 26;
              const showValue = l.r >= 40;
              const maxCharsPerLine = Math.max(4, Math.floor((l.r * 1.7) / (nameSize * 0.55)));
              const nameLines = showName ? wrapLabel(leaf.label, maxCharsPerLine) : [];
              const LINE_HEIGHT_EM = 1.18;
              const nameHalfHeight = (nameLines.length * nameSize * LINE_HEIGHT_EM) / 2;
              const valueHalfHeight = (valueSize * LINE_HEIGHT_EM) / 2;
              const gap = nameSize * 0.3;
              const nameCenterY = showValue ? l.cy - valueHalfHeight - gap / 2 : l.cy;
              const valueCenterY = l.cy + nameHalfHeight + gap / 2;
              return (
                <g key={leaf.id}>
                  <circle cx={l.cx} cy={l.cy} r={l.r} fill={fill} stroke={t.pageBg} strokeWidth={2}>
                    <title>{`${branch.label} / ${leaf.label}: $${leaf.value}K`}</title>
                  </circle>
                  {showName && (
                    <ChartsText
                      text={nameLines.join("\n")}
                      x={l.cx}
                      y={nameCenterY}
                      style={{
                        fontSize: nameSize,
                        fontWeight: 600,
                        fill: ink,
                        textAnchor: "middle",
                        dominantBaseline: "central",
                      }}
                    />
                  )}
                  {showValue && (
                    <ChartsText
                      text={`$${leaf.value}K`}
                      x={l.cx}
                      y={valueCenterY}
                      opacity={0.85}
                      style={{ fontSize: valueSize, fill: ink, textAnchor: "middle", dominantBaseline: "central" }}
                    />
                  )}
                </g>
              );
            })}
          </g>
        );
      })}
    </g>
  );
}

// --- Chart (default-exported component -- the harness mounts it) ----------
// ChartContainer supplies the <ChartsSurface> SVG root and theme context; its
// `margin` prop drives the DrawingProvider that CirclePacking() reads back
// via useDrawingArea(), the same layout primitive MUI X's own axis/legend
// components use. The packing body itself is laid out in local, scale-free
// units by layout()/place() above and only projected into pixel space here,
// so no axis/scale is needed -- xAxis/yAxis are omitted entirely.
const MARGIN = { top: 176, right: 24, bottom: 24, left: 24 };

export default function Chart() {
  const { width, height } = window.ANYPLOT_SIZE;

  return (
    <ChartContainer width={width} height={height} series={[]} margin={MARGIN} skipAnimation>
      <text x={width / 2} y={44} textAnchor="middle" fontSize={titleFontSize} fontWeight={600} fill={t.ink}>
        {title}
      </text>
      <text x={width / 2} y={74} textAnchor="middle" fontSize={14} fill={t.inkSoft}>
        Investment portfolio by asset class and holding · circle area proportional to market value ($K)
      </text>
      <Legend x={MARGIN.left} y={116} width={width - MARGIN.left - MARGIN.right} />
      <CirclePacking />
    </ChartContainer>
  );
}
Runnable source as JSON, for any HTTP client: https://api.anyplot.ai/specs/circlepacking-basic/muix/code. Any spec id and library id listed in llms-full.txt fit the same URL shape; every URL below is complete and callable.
{
  "spec_id": "circlepacking-basic",
  "language": "javascript",
  "library": "muix",
  "page": "https://anyplot.ai/circlepacking-basic/javascript/muix",
  "hub": "https://anyplot.ai/circlepacking-basic",
  "code_json": "https://api.anyplot.ai/specs/circlepacking-basic/muix/code",
  "spec_json": "https://api.anyplot.ai/specs/circlepacking-basic",
  "render_light_png": "https://storage.googleapis.com/anyplot-images/plots/circlepacking-basic/javascript/muix/plot-light.png",
  "render_dark_png": "https://storage.googleapis.com/anyplot-images/plots/circlepacking-basic/javascript/muix/plot-dark.png",
  "interactive_light_html": "https://storage.googleapis.com/anyplot-images/plots/circlepacking-basic/javascript/muix/plot-light.html",
  "interactive_dark_html": "https://storage.googleapis.com/anyplot-images/plots/circlepacking-basic/javascript/muix/plot-dark.html",
  "quality_score": 92.0,
  "license": "MIT",
  "guide": "https://anyplot.ai/llms.txt"
}
Part of Circle Packing Chart on anyplot.ai.