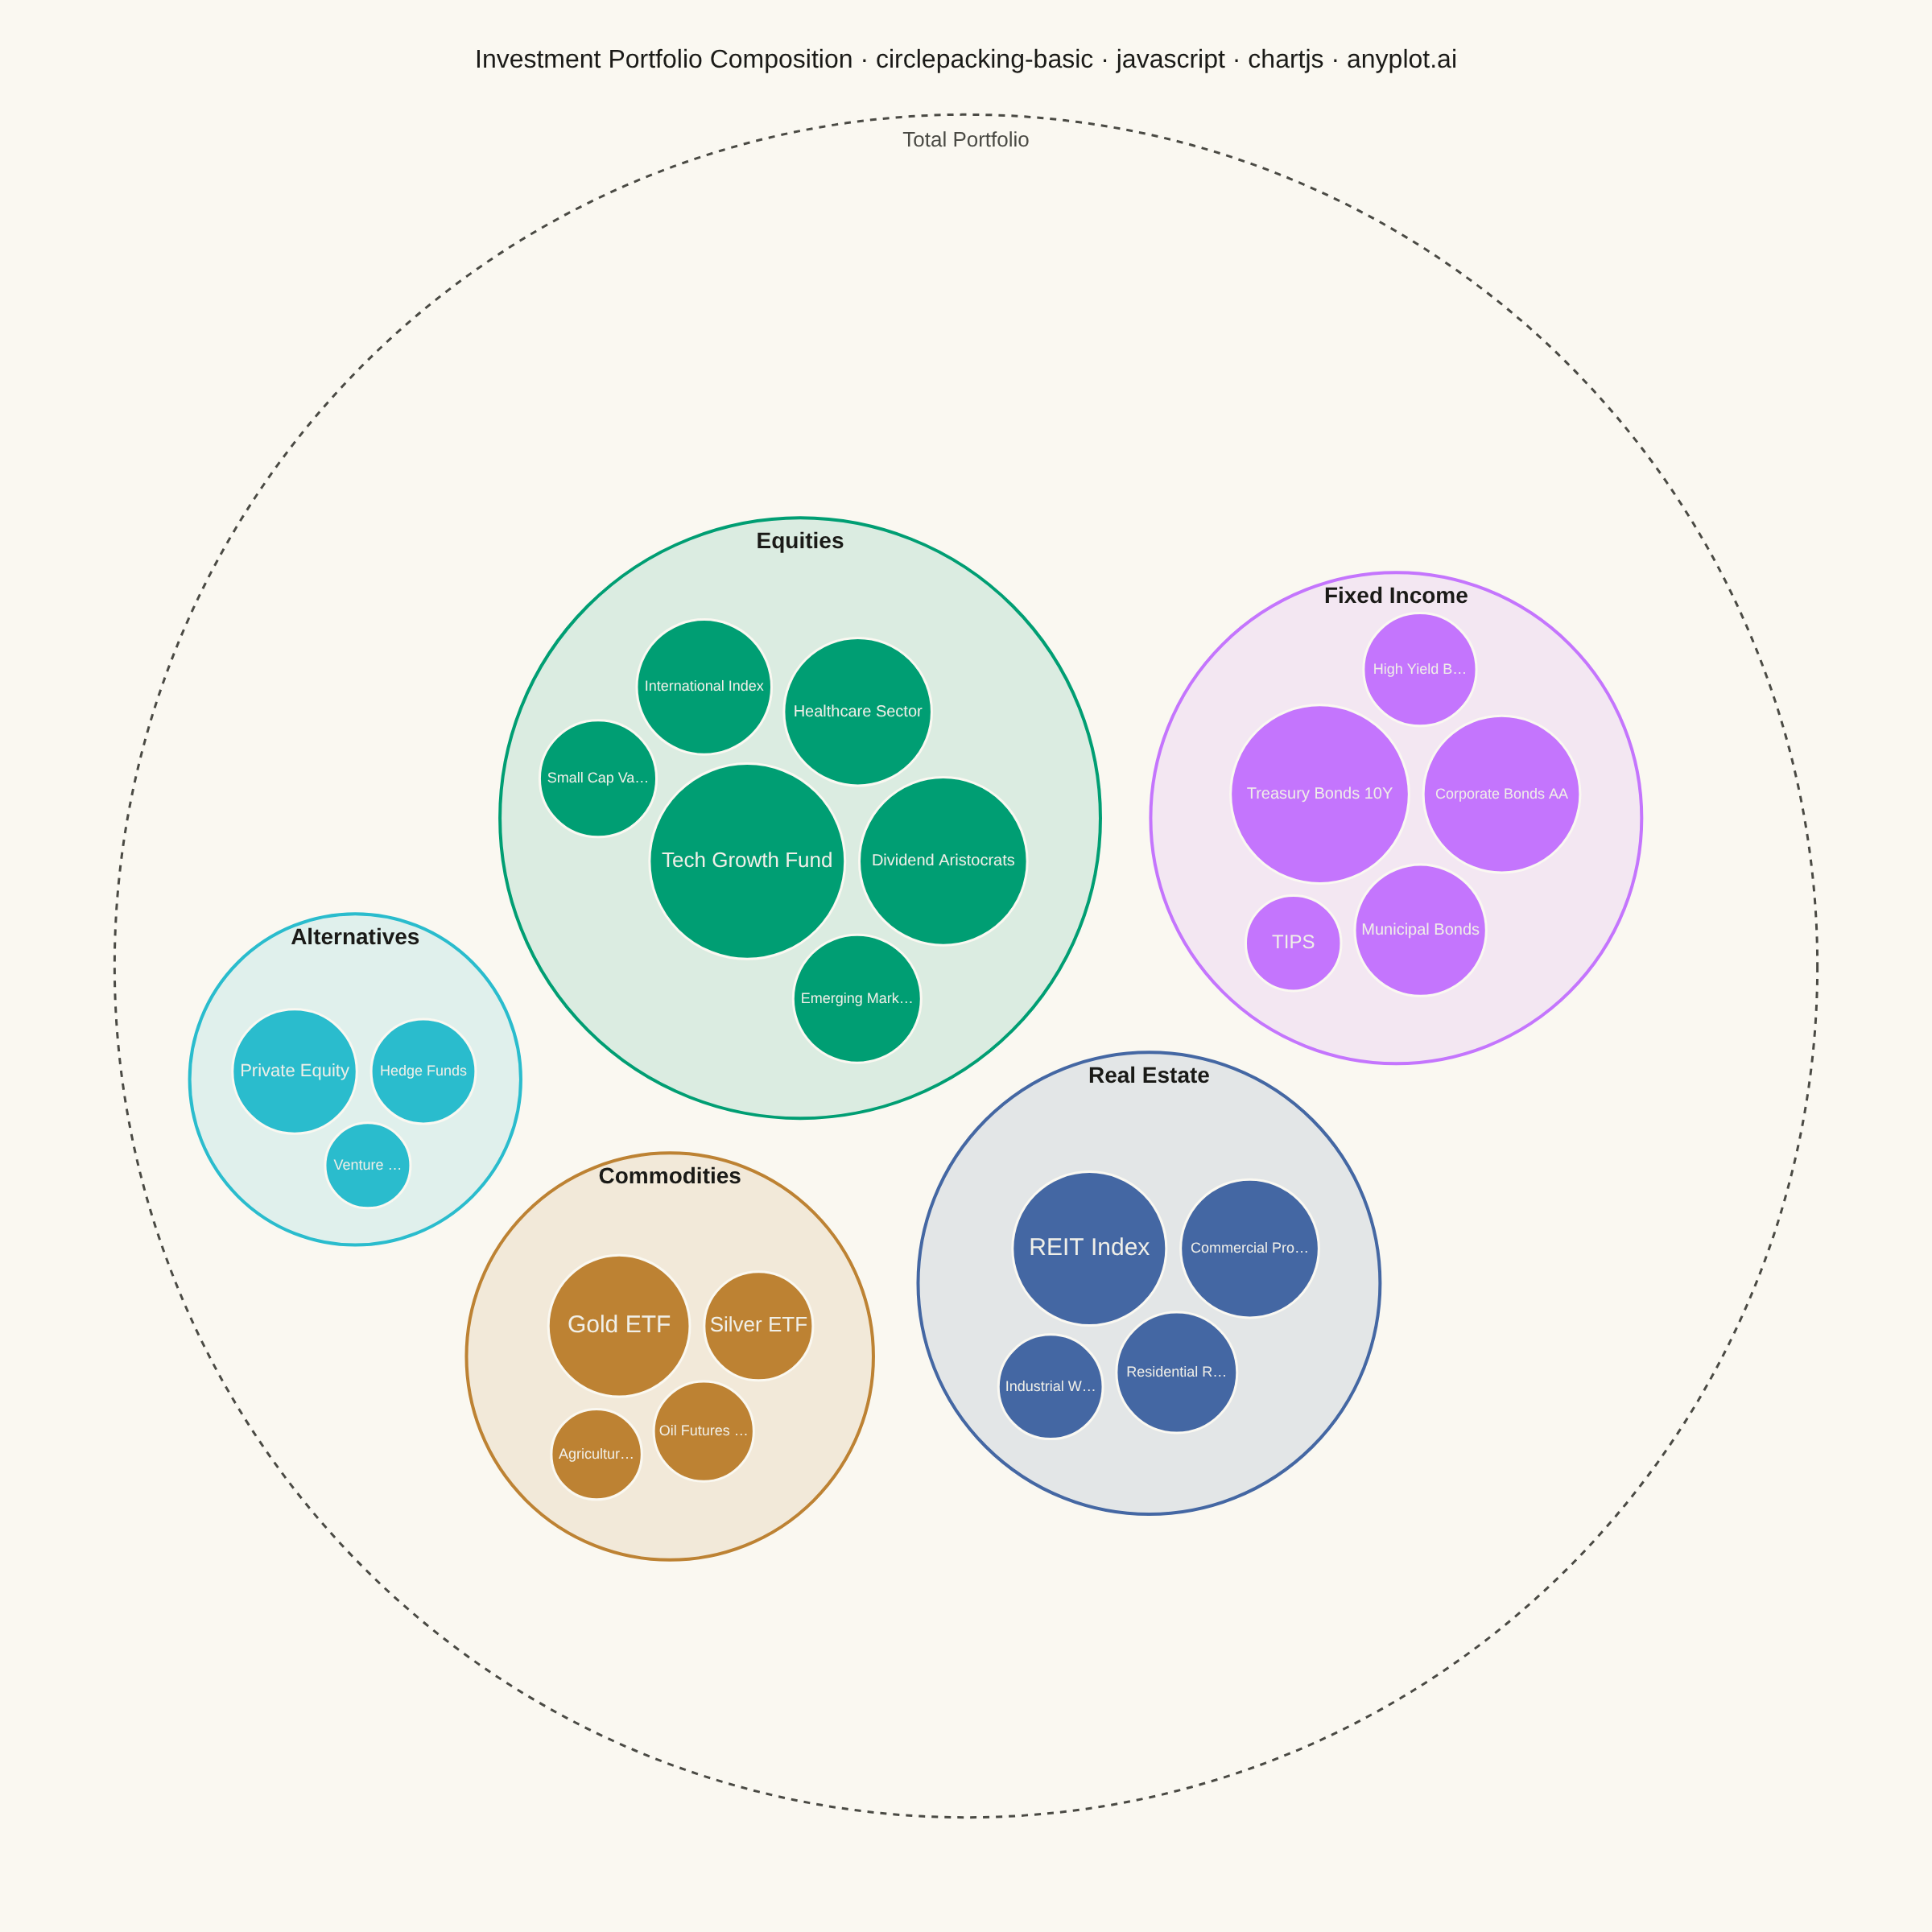
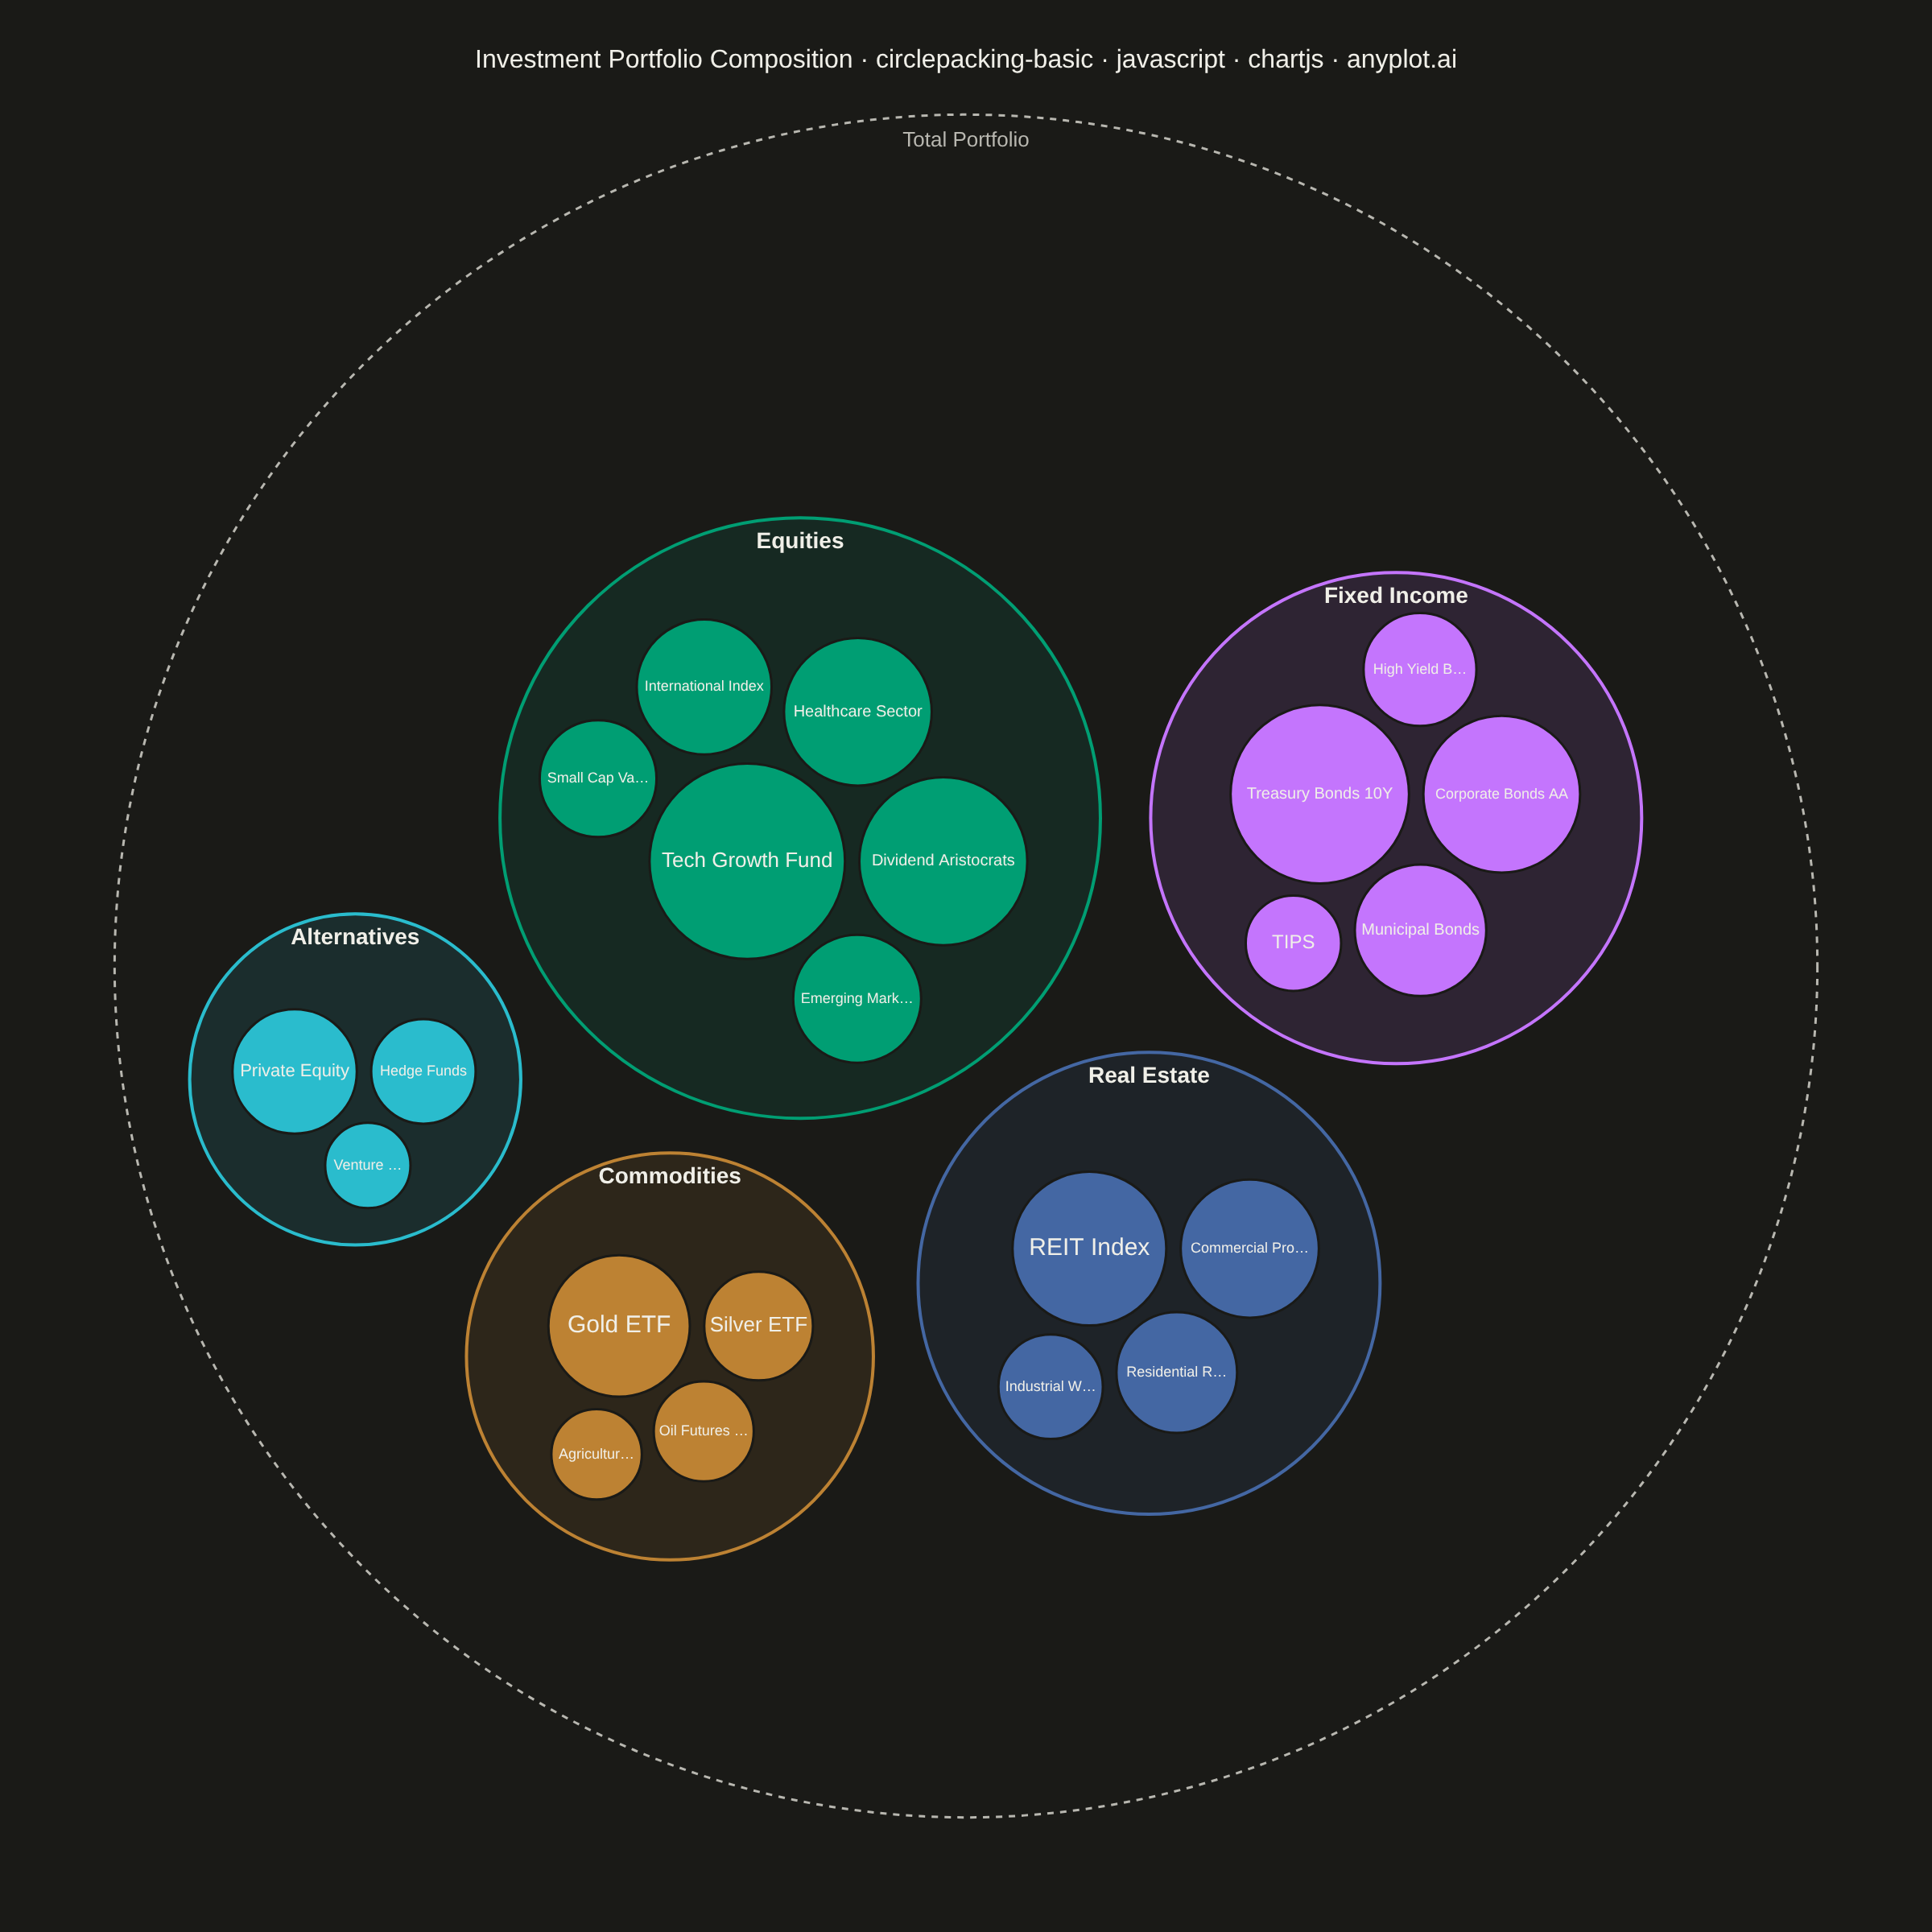
The same plot in 14 other libraries — JavaScript: D3.js, Apache ECharts, Highcharts, MUI X Charts; Python: Altair, Bokeh, lets-plot, Matplotlib, Plotly, plotnine, Pygal, Seaborn; R: ggplot2; Julia: Makie.jl. Compare all 15 side by side: Circle Packing Chart in Python, R, Julia and JavaScript.
A circle packing chart displays hierarchical data as nested circles, where each circle contains smaller circles representing its children. Circle size is proportional to node value, and circles are packed efficiently without overlap. This visualization excels at revealing hierarchical structures while simultaneously showing quantitative relationships through area encoding.
// anyplot.ai
// circlepacking-basic: Circle Packing Chart
// Library: chartjs 4.4.7 | JavaScript 22.23.2
// Quality: 91/100 | Created: 2026-09-02

//# anyplot-orientation: square
const t = window.ANYPLOT_TOKENS;

// --- Data: investment portfolio composition ($M), flat node list -----------
// id / parent / value / label mirror the spec's data schema. `value` is set
// only on leaf holdings — category and root totals are derived bottom-up.
const nodes = [
  { id: "portfolio", parent: null, label: "Portfolio" },
  { id: "equities", parent: "portfolio", label: "Equities" },
  { id: "tech-growth", parent: "equities", label: "Tech Growth Fund", value: 42 },
  { id: "dividend-aristocrats", parent: "equities", label: "Dividend Aristocrats", value: 31 },
  { id: "healthcare-sector", parent: "equities", label: "Healthcare Sector", value: 24 },
  { id: "international-index", parent: "equities", label: "International Index", value: 20 },
  { id: "emerging-markets", parent: "equities", label: "Emerging Markets", value: 18 },
  { id: "small-cap-value", parent: "equities", label: "Small Cap Value", value: 15 },
  { id: "fixed-income", parent: "portfolio", label: "Fixed Income" },
  { id: "treasury-10y", parent: "fixed-income", label: "Treasury Bonds 10Y", value: 35 },
  { id: "corporate-aa", parent: "fixed-income", label: "Corporate Bonds AA", value: 27 },
  { id: "municipal-bonds", parent: "fixed-income", label: "Municipal Bonds", value: 19 },
  { id: "high-yield", parent: "fixed-income", label: "High Yield Bonds", value: 14 },
  { id: "tips", parent: "fixed-income", label: "TIPS", value: 10 },
  { id: "real-estate", parent: "portfolio", label: "Real Estate" },
  { id: "reit-index", parent: "real-estate", label: "REIT Index", value: 26 },
  { id: "commercial-property", parent: "real-estate", label: "Commercial Property Fund", value: 21 },
  { id: "residential-reit", parent: "real-estate", label: "Residential REIT", value: 16 },
  { id: "industrial-warehouses", parent: "real-estate", label: "Industrial Warehouses", value: 12 },
  { id: "commodities", parent: "portfolio", label: "Commodities" },
  { id: "gold-etf", parent: "commodities", label: "Gold ETF", value: 22 },
  { id: "silver-etf", parent: "commodities", label: "Silver ETF", value: 13 },
  { id: "oil-futures", parent: "commodities", label: "Oil Futures Fund", value: 11 },
  { id: "agri-commodities", parent: "commodities", label: "Agricultural Commodities", value: 9 },
  { id: "alternatives", parent: "portfolio", label: "Alternatives" },
  { id: "private-equity", parent: "alternatives", label: "Private Equity", value: 17 },
  { id: "hedge-funds", parent: "alternatives", label: "Hedge Funds", value: 12 },
  { id: "venture-capital", parent: "alternatives", label: "Venture Capital", value: 8 },
];

// Skip palette[4] (#AE3030) — reserved as the semantic anchor for loss/error,
// not needed here since no category carries that meaning.
const CATEGORY_COLORS = [t.palette[0], t.palette[1], t.palette[2], t.palette[3], t.palette[5]];

function buildTree(id) {
  const record = nodes.find((n) => n.id === id);
  const childRecords = nodes.filter((n) => n.parent === id);
  const node = { label: record.label, value: record.value };
  if (childRecords.length > 0) node.children = childRecords.map((c) => buildTree(c.id));
  return node;
}

const root = buildTree("portfolio");
root.children.forEach((category, i) => {
  category.color = CATEGORY_COLORS[i];
  category.children.forEach((leaf) => {
    leaf.color = CATEGORY_COLORS[i];
  });
});

// --- Circle packing layout ---------------------------------------------------
// Leaf circle area (radius²) is proportional to `value`. A container's radius
// comes from packing its children with a front-chain enclosure algorithm —
// each new circle is placed tangent to the two nearest circles already on the
// packed cluster's frontier, closest candidate to the center wins — the same
// idea behind D3's pack layout, reimplemented here without the dependency.
// World units are arbitrary; everything is rescaled to fit the canvas at
// draw time.
const LEAF_SCALE = 4.2;
const LEAF_GAP = 4;
const CATEGORY_GAP = 14;
const GROUP_MARGIN = 10;
const ROOT_MARGIN = 18;

// Both intersections of the two circles centered `gap`-plus-radius away from
// `a` and `b` respectively — the two points a third circle of radius `r` can
// sit at while staying tangent to both.
function tangentCandidates(a, b, r, gap) {
  const ra = a.radius + r + gap;
  const rb = b.radius + r + gap;
  const dx = b.x - a.x;
  const dy = b.y - a.y;
  const d2 = dx * dx + dy * dy;
  const d = Math.sqrt(d2);
  if (d < 1e-9) return [];
  const l = (d2 + ra * ra - rb * rb) / (2 * d);
  const hSq = ra * ra - l * l;
  if (hSq < 0) return [];
  const h = Math.sqrt(hSq);
  const ux = dx / d;
  const uy = dy / d;
  const px = a.x + ux * l;
  const py = a.y + uy * l;
  return [
    { x: px - uy * h, y: py + ux * h },
    { x: px + uy * h, y: py - ux * h },
  ];
}

function overlapsAny(candidate, r, placed, gap) {
  return placed.some((c) => Math.hypot(candidate.x - c.x, candidate.y - c.y) < c.radius + r + gap - 1e-6);
}

// Packs `children` around the origin with no overlaps, largest first. Each
// new circle is tried tangent to every consecutive pair on the current front
// chain; the valid candidate closest to the origin is kept, keeping the
// cluster tight instead of sprawling outward.
function packSiblings(children, gap) {
  const n = children.length;
  if (n === 0) return;
  if (n === 1) {
    children[0].x = 0;
    children[0].y = 0;
    return;
  }
  const order = children.slice().sort((a, b) => b.radius - a.radius);
  order[0].x = 0;
  order[0].y = 0;
  order[1].x = order[0].radius + order[1].radius + gap;
  order[1].y = 0;
  if (n === 2) return;

  const chain = [order[0], order[1]];
  for (let i = 2; i < n; i++) {
    const circle = order[i];
    let best = null;
    let bestDist = Infinity;
    for (let j = 0; j < chain.length; j++) {
      const a = chain[j];
      const b = chain[(j + 1) % chain.length];
      for (const candidate of tangentCandidates(a, b, circle.radius, gap)) {
        if (overlapsAny(candidate, circle.radius, chain, gap)) continue;
        const dist = Math.hypot(candidate.x, candidate.y);
        if (dist < bestDist) {
          bestDist = dist;
          best = { ...candidate, insertAfter: j };
        }
      }
    }
    if (!best) {
      // Degenerate fallback (collinear frontier) — practically unreached for
      // the modest, varied-radius sibling counts used in this chart.
      const cx = chain.reduce((sum, c) => sum + c.x, 0) / chain.length;
      const cy = chain.reduce((sum, c) => sum + c.y, 0) / chain.length;
      best = { x: cx, y: cy, insertAfter: chain.length - 1 };
    }
    circle.x = best.x;
    circle.y = best.y;
    chain.splice(best.insertAfter + 1, 0, circle);
  }
}

// Ritter-style bounding circle: grow a running circle to cover whichever
// packed circle currently sits farthest outside it, a few passes over the
// set. Used to recenter each cluster on its true center rather than the
// arbitrary point the packing started from.
function enclosingCircle(children) {
  let cx = children[0].x;
  let cy = children[0].y;
  let r = children[0].radius;
  const grow = (c) => {
    const d = Math.hypot(c.x - cx, c.y - cy);
    if (d + c.radius > r + 1e-6) {
      const newR = (r + d + c.radius) / 2;
      const k = d > 1e-6 ? (newR - r) / d : 0;
      cx += (c.x - cx) * k;
      cy += (c.y - cy) * k;
      r = newR;
    }
  };
  for (let pass = 0; pass < 4; pass++) children.forEach(grow);
  return { cx, cy, r };
}

function layout(node, depth) {
  if (!node.children) {
    node.radius = Math.sqrt(node.value) * LEAF_SCALE;
    return;
  }
  node.children.forEach((c) => layout(c, depth + 1));
  packSiblings(node.children, depth === 0 ? CATEGORY_GAP : LEAF_GAP);
  const { cx, cy, r } = enclosingCircle(node.children);
  node.children.forEach((c) => {
    c.x -= cx;
    c.y -= cy;
  });
  node.radius = r + (depth === 0 ? ROOT_MARGIN : GROUP_MARGIN);
  node.value = node.children.reduce((sum, c) => sum + c.value, 0);
}

function placeAbsolute(node, originX, originY) {
  node.absX = originX + (node.x || 0);
  node.absY = originY + (node.y || 0);
  if (node.children) node.children.forEach((c) => placeAbsolute(c, node.absX, node.absY));
}

layout(root, 0);
placeAbsolute(root, 0, 0);

// --- Drawing helpers ---------------------------------------------------------
const TEXT_DARK = "#1A1A17";
const TEXT_LIGHT = "#F0EFE8";

function withAlpha(hex, alpha) {
  const r = parseInt(hex.slice(1, 3), 16);
  const g = parseInt(hex.slice(3, 5), 16);
  const b = parseInt(hex.slice(5, 7), 16);
  return `rgba(${r}, ${g}, ${b}, ${alpha})`;
}

function contrastText(hex) {
  const [r, g, b] = [1, 3, 5].map((i) => parseInt(hex.slice(i, i + 2), 16) / 255);
  const lin = (c) => (c <= 0.03928 ? c / 12.92 : Math.pow((c + 0.055) / 1.055, 2.4));
  const luminance = 0.2126 * lin(r) + 0.7152 * lin(g) + 0.0722 * lin(b);
  return luminance > 0.45 ? TEXT_DARK : TEXT_LIGHT;
}

function fitText(ctx, text, maxWidth) {
  if (ctx.measureText(text).width <= maxWidth) return text;
  let truncated = text;
  while (truncated.length > 1 && ctx.measureText(truncated + "…").width > maxWidth) {
    truncated = truncated.slice(0, -1);
  }
  return truncated + "…";
}

// Transform from world units (node.absX/absY/radius) to canvas pixels: fit
// the root circle to the smaller chartArea dimension, centered. Shared by
// the manual draw pass and the synthetic hover points so both stay aligned.
function computeTransform(chart) {
  const { chartArea } = chart;
  const cx = (chartArea.left + chartArea.right) / 2;
  const cy = (chartArea.top + chartArea.bottom) / 2;
  const available = Math.min(chartArea.width, chartArea.height) / 2 - 8;
  const scale = available / root.radius;
  return { cx, cy, scale };
}

// Leaf nodes only — the smaller circles whose labels are most likely
// truncated in the static render, so a hover path is worth the most there.
function collectLeaves(node, depth, out) {
  if (depth === 2) out.push(node);
  else if (node.children) node.children.forEach((c) => collectLeaves(c, depth + 1, out));
  return out;
}

// --- Mount --------------------------------------------------------------
const canvas = document.createElement("canvas");
document.getElementById("container").appendChild(canvas);

// --- Chart --------------------------------------------------------------
// The bubble type hosts the canvas, title, and layout; the packed circles
// are drawn directly against the resolved `chartArea` in a plugin rather
// than through the dataset — that avoids remapping our already-final pixel
// radii through Chart.js's data-driven x/y scales. The dataset is used only
// below to place invisible hover targets on top of the leaf circles.
const circlePackingPlugin = {
  id: "circlePacking",
  afterDraw(chart) {
    const { ctx } = chart;
    const { cx, cy, scale } = computeTransform(chart);

    ctx.save();
    ctx.textAlign = "center";
    ctx.textBaseline = "middle";

    const drawNode = (node, depth) => {
      const x = cx + node.absX * scale;
      const y = cy + node.absY * scale;
      const r = node.radius * scale;

      ctx.beginPath();
      ctx.arc(x, y, r, 0, Math.PI * 2);
      if (depth === 0) {
        ctx.setLineDash([4, 4]);
        ctx.lineWidth = 1.5;
        ctx.strokeStyle = t.inkSoft;
        ctx.stroke();
        ctx.setLineDash([]);
      } else if (depth === 1) {
        ctx.fillStyle = withAlpha(node.color, 0.12);
        ctx.fill();
        ctx.lineWidth = 2;
        ctx.strokeStyle = node.color;
        ctx.stroke();
      } else {
        ctx.fillStyle = node.color;
        ctx.fill();
        ctx.lineWidth = 1.5;
        ctx.strokeStyle = t.pageBg;
        ctx.stroke();
      }

      if (node.children) node.children.forEach((c) => drawNode(c, depth + 1));
    };
    drawNode(root, 0);

    // Labels drawn after every circle so text always sits on top.
    const labelNode = (node, depth) => {
      const x = cx + node.absX * scale;
      const y = cy + node.absY * scale;
      const r = node.radius * scale;

      if (depth === 0) {
        ctx.font = "500 13px -apple-system, sans-serif";
        ctx.fillStyle = t.inkSoft;
        ctx.fillText("Total Portfolio", x, y - r + 16);
      } else if (depth === 1 && r > 46) {
        // Sits inside the GROUP_MARGIN ring around the packed leaves, which
        // by construction no leaf circle reaches — guaranteed clear of the
        // leaf labels drawn beneath it, regardless of how they're arranged.
        ctx.font = "600 14px -apple-system, sans-serif";
        ctx.fillStyle = t.ink;
        ctx.fillText(fitText(ctx, node.label, r * 1.3), x, y - r + 15);
      } else if (depth === 2 && r > 24) {
        // Shrink the font toward a legible floor before truncating, so
        // longer holding names survive whole more often than a fixed
        // radius-only font size would allow.
        const maxWidth = r * 1.8;
        let fontSize = Math.min(15, Math.max(11, Math.round(r * 0.42)));
        ctx.font = `500 ${fontSize}px -apple-system, sans-serif`;
        while (fontSize > 9 && ctx.measureText(node.label).width > maxWidth) {
          fontSize -= 1;
          ctx.font = `500 ${fontSize}px -apple-system, sans-serif`;
        }
        ctx.fillStyle = contrastText(node.color);
        ctx.fillText(fitText(ctx, node.label, maxWidth), x, y);
      }

      if (node.children) node.children.forEach((c) => labelNode(c, depth + 1));
    };
    labelNode(root, 0);

    ctx.restore();
  },
};

// Leaf circles are hand-drawn pixels with no data points of their own, so
// hovering them natively needs an invisible bubble dataset placed exactly on
// top. `data`/`min`/`max` stay empty/[-1,1] for the first render; once the
// chart has laid out once we know the real chartArea and back-map every
// leaf's already-drawn pixel center through the live scale (getValueForPixel)
// so the two coordinate systems line up exactly, then redraw.
const chart = new Chart(canvas, {
  type: "bubble",
  data: { datasets: [{ data: [], backgroundColor: "transparent", hoverBackgroundColor: "transparent", borderWidth: 0, hoverBorderWidth: 0 }] },
  options: {
    responsive: true,
    maintainAspectRatio: false,
    animation: false,
    layout: { padding: 24 },
    interaction: { mode: "nearest", intersect: true },
    scales: {
      x: { display: false, min: -1, max: 1 },
      y: { display: false, min: -1, max: 1 },
    },
    plugins: {
      legend: { display: false },
      tooltip: {
        enabled: true,
        backgroundColor: t.elevatedBg,
        titleColor: t.ink,
        bodyColor: t.ink,
        borderColor: t.grid,
        borderWidth: 1,
        callbacks: {
          title: (items) => items[0]?.raw?.label ?? "",
          label: (item) => `$${item.raw.value}M`,
        },
      },
      title: {
        display: true,
        text: "Investment Portfolio Composition · circlepacking-basic · javascript · chartjs · anyplot.ai",
        color: t.ink,
        font: { size: 16, weight: "500" },
        padding: { bottom: 16 },
      },
    },
  },
  plugins: [circlePackingPlugin],
});

const { cx, cy, scale } = computeTransform(chart);
const leafHoverPoints = collectLeaves(root, 0, []).map((leaf) => ({
  x: chart.scales.x.getValueForPixel(cx + leaf.absX * scale),
  y: chart.scales.y.getValueForPixel(cy + leaf.absY * scale),
  r: leaf.radius * scale,
  label: leaf.label,
  value: leaf.value,
}));
chart.data.datasets[0].data = leafHoverPoints;
chart.update("none");
Runnable source as JSON, for any HTTP client: https://api.anyplot.ai/specs/circlepacking-basic/chartjs/code. Any spec id and library id listed in llms-full.txt fit the same URL shape; every URL below is complete and callable.
{
  "spec_id": "circlepacking-basic",
  "language": "javascript",
  "library": "chartjs",
  "page": "https://anyplot.ai/circlepacking-basic/javascript/chartjs",
  "hub": "https://anyplot.ai/circlepacking-basic",
  "code_json": "https://api.anyplot.ai/specs/circlepacking-basic/chartjs/code",
  "spec_json": "https://api.anyplot.ai/specs/circlepacking-basic",
  "render_light_png": "https://storage.googleapis.com/anyplot-images/plots/circlepacking-basic/javascript/chartjs/plot-light.png",
  "render_dark_png": "https://storage.googleapis.com/anyplot-images/plots/circlepacking-basic/javascript/chartjs/plot-dark.png",
  "interactive_light_html": "https://storage.googleapis.com/anyplot-images/plots/circlepacking-basic/javascript/chartjs/plot-light.html",
  "interactive_dark_html": "https://storage.googleapis.com/anyplot-images/plots/circlepacking-basic/javascript/chartjs/plot-dark.html",
  "quality_score": 91.0,
  "license": "MIT",
  "guide": "https://anyplot.ai/llms.txt"
}
Part of Circle Packing Chart on anyplot.ai.