The same plot in 14 other libraries — JavaScript: D3.js, Apache ECharts, Highcharts, MUI X Charts; Python: Altair, Bokeh, lets-plot, Matplotlib, Plotly, plotnine, Pygal, Seaborn; R: ggplot2; Julia: Makie.jl. Compare all 15 side by side: Basic ECDF Plot in Python, R, Julia and JavaScript.
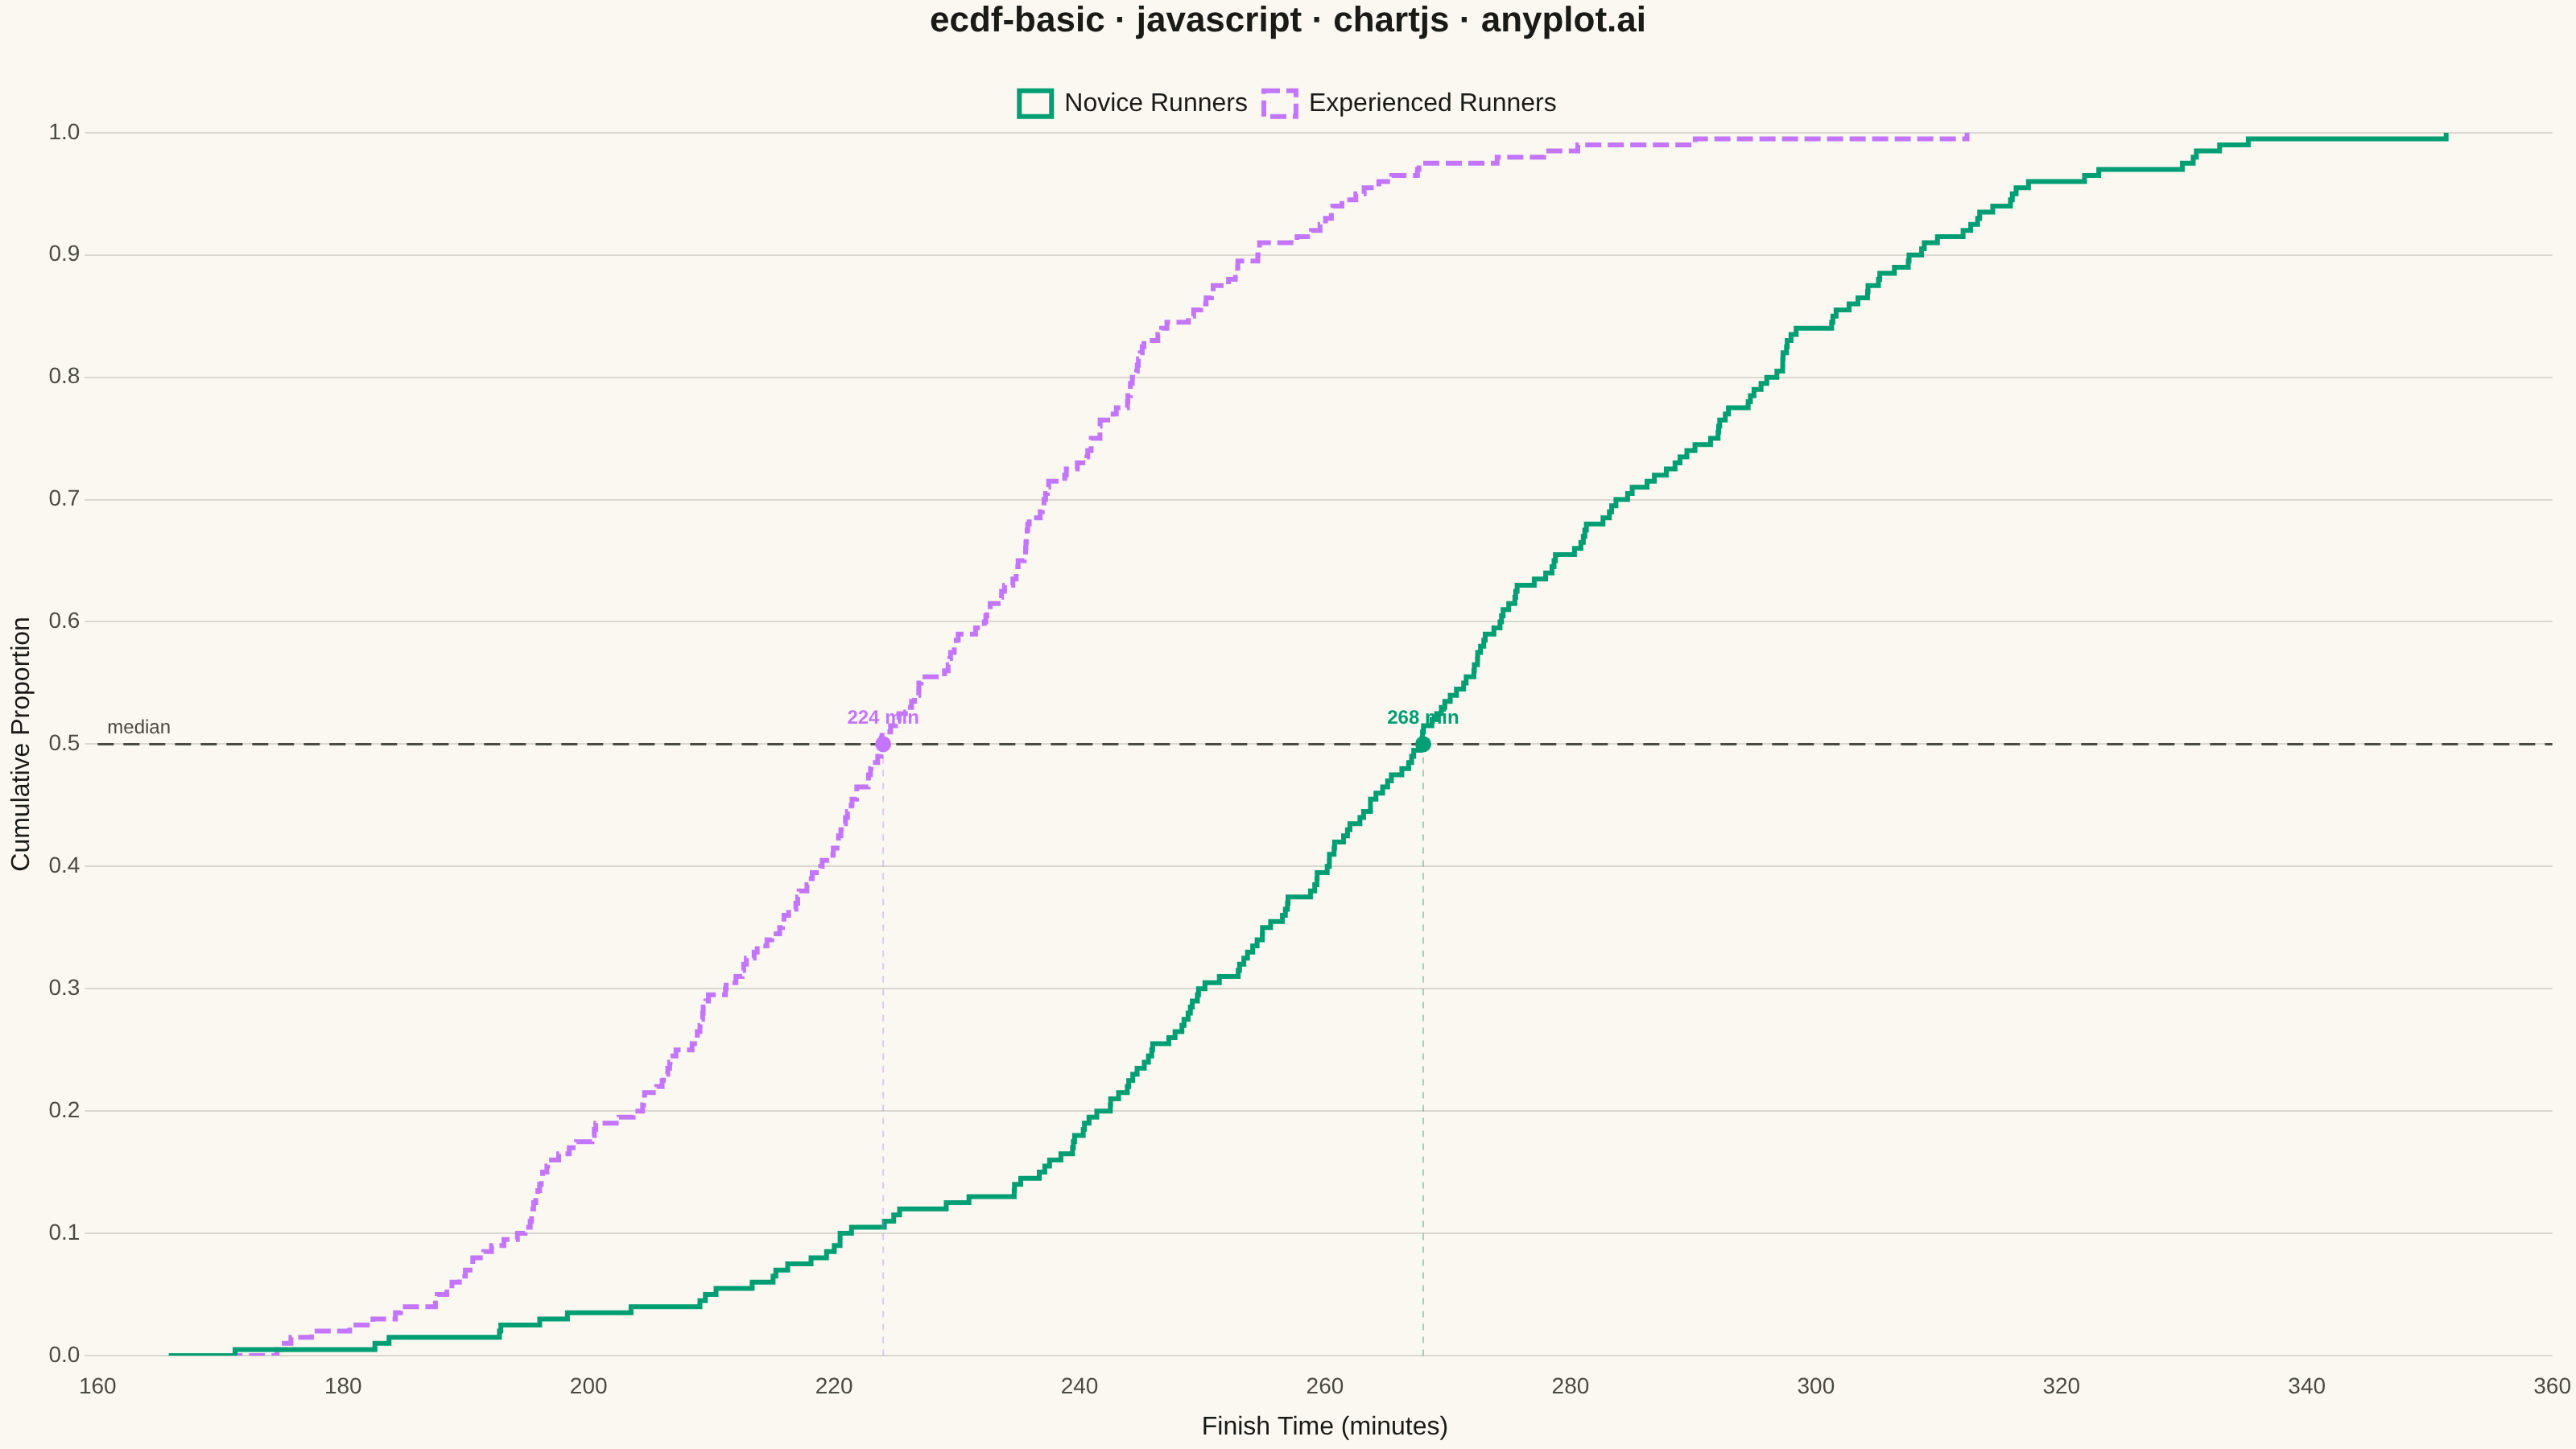
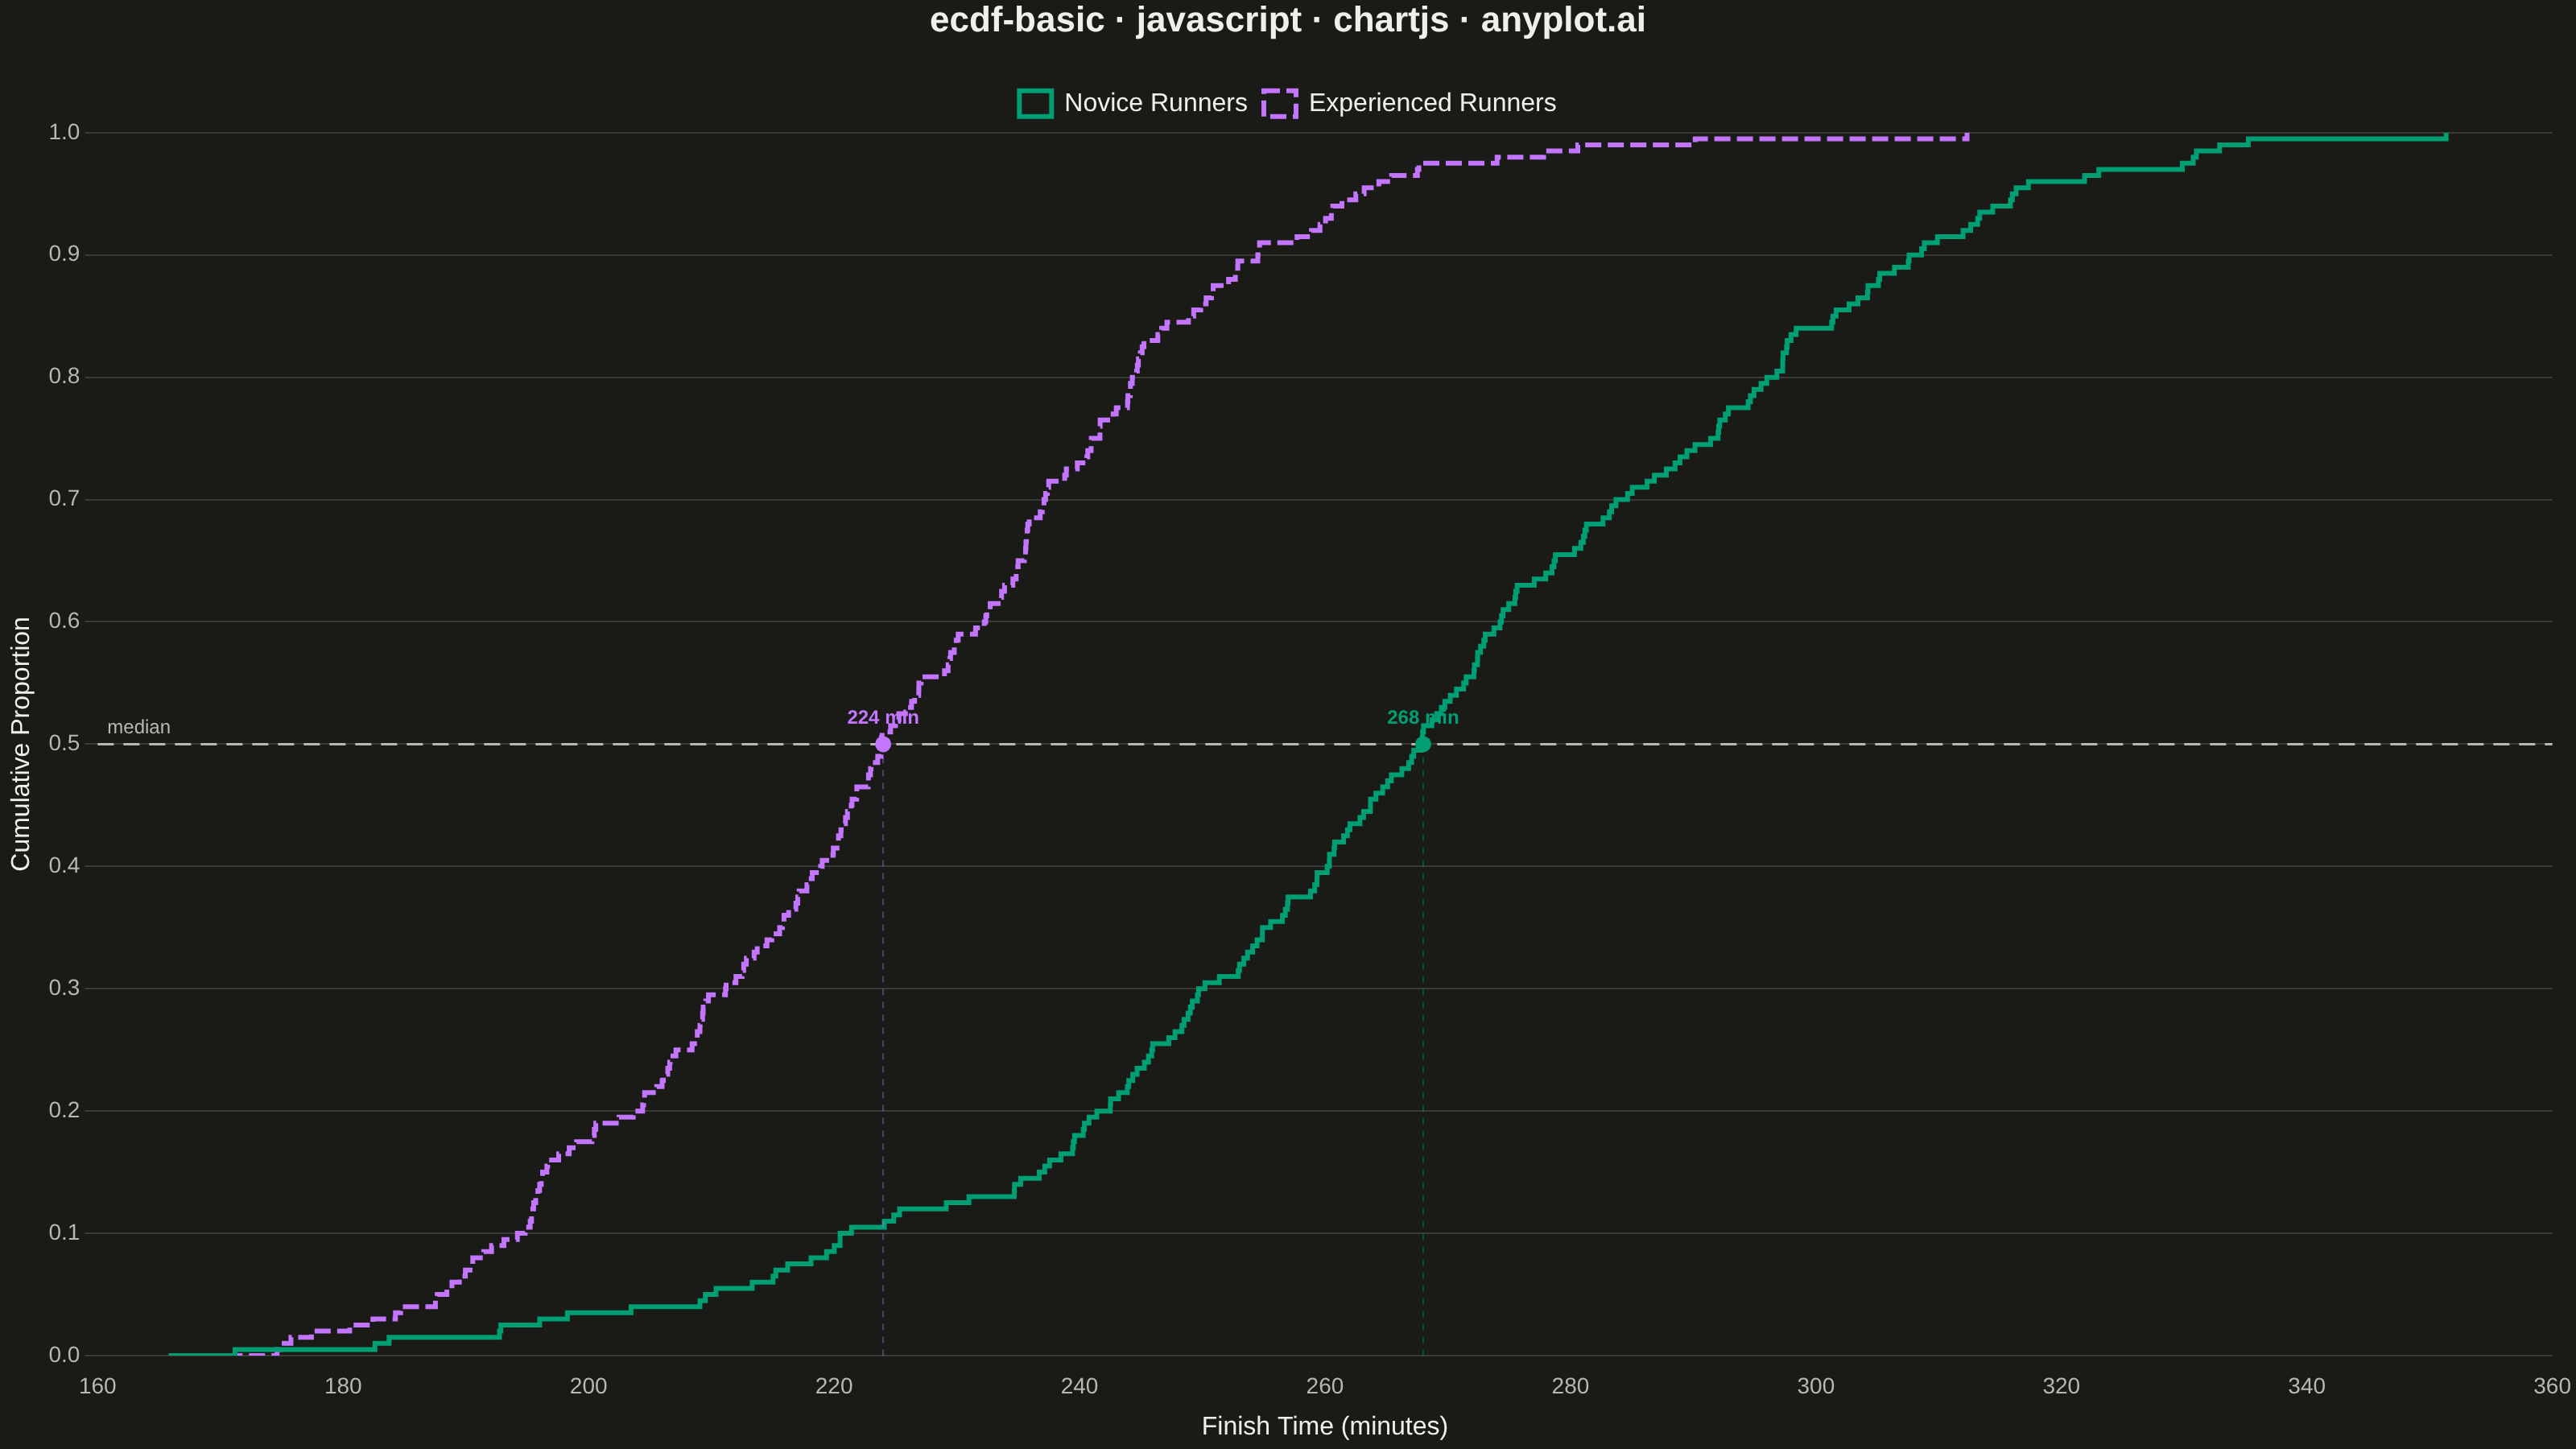
An ECDF (Empirical Cumulative Distribution Function) plot displays a step function that shows the proportion of observations less than or equal to each value. Unlike histograms, ECDF plots require no binning or smoothing, providing a non-parametric estimate of the cumulative distribution. The y-axis ranges from 0 to 1, allowing direct reading of percentiles and quantiles from the visualization.
// anyplot.ai
// ecdf-basic: Basic ECDF Plot
// Library: chartjs 4.4.7 | JavaScript 22.23.0
// Quality: 88/100 | Created: 2026-06-25

const t = window.ANYPLOT_TOKENS;

// LCG for reproducible pseudo-random numbers (no seeded RNG in the browser)
let seed = 42;
function lcg() {
  seed = (seed * 1664525 + 1013904223) & 0xffffffff;
  return (seed >>> 0) / 0xffffffff;
}
function randNormal(mean, std) {
  const u1 = lcg() + 1e-10;
  const u2 = lcg();
  return mean + std * Math.sqrt(-2 * Math.log(u1)) * Math.cos(2 * Math.PI * u2);
}

// Marathon finish times (minutes) — novice vs experienced runners
const N = 200;
const noviceTimes = Array.from({ length: N }, () => randNormal(265, 35));
const experiencedTimes = Array.from({ length: N }, () => randNormal(225, 25));

// ECDF: sort values and compute cumulative proportions (i+1)/n
function computeECDF(values) {
  const sorted = [...values].sort((a, b) => a - b);
  const range = sorted[sorted.length - 1] - sorted[0];
  const ecdf = sorted.map((x, i) => ({ x, y: (i + 1) / sorted.length }));
  ecdf.unshift({ x: sorted[0] - range * 0.03, y: 0 });
  return ecdf;
}

const noviceECDF = computeECDF(noviceTimes);
const experiencedECDF = computeECDF(experiencedTimes);

// Median: x where ECDF first reaches 0.5
function findMedian(ecdf) {
  const pt = ecdf.find((p) => p.y >= 0.5);
  return pt ? Math.round(pt.x) : null;
}
const noviceMedian = findMedian(noviceECDF);
const experiencedMedian = findMedian(experiencedECDF);

// Mount
const canvas = document.createElement("canvas");
document.getElementById("container").appendChild(canvas);

// Fill canvas with theme surface color before all drawing
const bgPlugin = {
  id: "bg",
  beforeDraw(chart) {
    const { ctx } = chart;
    ctx.save();
    ctx.fillStyle = t.pageBg;
    ctx.fillRect(0, 0, chart.width, chart.height);
    ctx.restore();
  },
};

// Draw median reference line at y=0.5 with per-group callouts
const medianPlugin = {
  id: "medianRef",
  afterDatasetsDraw(chart) {
    const { ctx, chartArea, scales } = chart;
    if (!chartArea) return;
    const y50 = scales.y.getPixelForValue(0.5);
    ctx.save();

    // Dashed horizontal reference line across full chart area
    ctx.beginPath();
    ctx.setLineDash([10, 6]);
    ctx.lineWidth = 1.5;
    ctx.strokeStyle = t.inkSoft;
    ctx.moveTo(chartArea.left, y50);
    ctx.lineTo(chartArea.right, y50);
    ctx.stroke();
    ctx.setLineDash([]);

    // "median" label inside the chart above the reference line on the left
    ctx.font = "12px sans-serif";
    ctx.fillStyle = t.inkSoft;
    ctx.textAlign = "left";
    ctx.textBaseline = "bottom";
    ctx.fillText("median", chartArea.left + 6, y50 - 4);

    // Per-group callouts: dot at crossing + subtle vertical drop + minute label
    [
      { value: noviceMedian, color: t.palette[0] },
      { value: experiencedMedian, color: t.palette[1] },
    ].forEach(({ value, color }) => {
      if (value == null) return;
      const xPx = scales.x.getPixelForValue(value);

      // Subtle vertical drop line from reference line to x-axis
      ctx.beginPath();
      ctx.setLineDash([4, 4]);
      ctx.lineWidth = 1;
      ctx.strokeStyle = color;
      ctx.globalAlpha = 0.4;
      ctx.moveTo(xPx, y50);
      ctx.lineTo(xPx, chartArea.bottom);
      ctx.stroke();
      ctx.setLineDash([]);
      ctx.globalAlpha = 1;

      // Filled dot at the median crossing
      ctx.beginPath();
      ctx.arc(xPx, y50, 5, 0, 2 * Math.PI);
      ctx.fillStyle = color;
      ctx.fill();

      // Minute label above the dot
      ctx.font = "bold 12px sans-serif";
      ctx.fillStyle = color;
      ctx.textAlign = "center";
      ctx.textBaseline = "bottom";
      ctx.fillText(`${value} min`, xPx, y50 - 10);
    });

    ctx.restore();
  },
};

new Chart(canvas, {
  type: "line",
  plugins: [bgPlugin, medianPlugin],
  data: {
    datasets: [
      {
        label: "Novice Runners",
        data: noviceECDF,
        borderColor: t.palette[0],
        backgroundColor: "transparent",
        borderWidth: 3,
        stepped: "before",
        pointRadius: 0,
      },
      {
        label: "Experienced Runners",
        data: experiencedECDF,
        borderColor: t.palette[1],
        backgroundColor: "transparent",
        borderWidth: 3,
        borderDash: [10, 4],
        stepped: "before",
        pointRadius: 0,
      },
    ],
  },
  options: {
    responsive: true,
    maintainAspectRatio: false,
    animation: false,
    plugins: {
      title: {
        display: true,
        text: "ecdf-basic · javascript · chartjs · anyplot.ai",
        color: t.ink,
        font: { size: 22 },
        padding: { bottom: 20 },
      },
      legend: {
        labels: { color: t.ink, font: { size: 16 }, boxWidth: 20 },
      },
    },
    scales: {
      x: {
        type: "linear",
        border: { display: false },
        title: {
          display: true,
          text: "Finish Time (minutes)",
          color: t.ink,
          font: { size: 16 },
        },
        ticks: { color: t.inkSoft, font: { size: 14 } },
        grid: { display: false },
      },
      y: {
        min: 0,
        max: 1,
        border: { display: false },
        title: {
          display: true,
          text: "Cumulative Proportion",
          color: t.ink,
          font: { size: 16 },
        },
        ticks: {
          color: t.inkSoft,
          font: { size: 14 },
          callback: (v) => v.toFixed(1),
        },
        grid: { color: t.grid },
      },
    },
  },
});
Runnable source as JSON, for any HTTP client: https://api.anyplot.ai/specs/ecdf-basic/chartjs/code. Any spec id and library id listed in llms-full.txt fit the same URL shape; every URL below is complete and callable.
{
  "spec_id": "ecdf-basic",
  "language": "javascript",
  "library": "chartjs",
  "page": "https://anyplot.ai/ecdf-basic/javascript/chartjs",
  "hub": "https://anyplot.ai/ecdf-basic",
  "code_json": "https://api.anyplot.ai/specs/ecdf-basic/chartjs/code",
  "spec_json": "https://api.anyplot.ai/specs/ecdf-basic",
  "render_light_png": "https://storage.googleapis.com/anyplot-images/plots/ecdf-basic/javascript/chartjs/plot-light.png",
  "render_dark_png": "https://storage.googleapis.com/anyplot-images/plots/ecdf-basic/javascript/chartjs/plot-dark.png",
  "interactive_light_html": "https://storage.googleapis.com/anyplot-images/plots/ecdf-basic/javascript/chartjs/plot-light.html",
  "interactive_dark_html": "https://storage.googleapis.com/anyplot-images/plots/ecdf-basic/javascript/chartjs/plot-dark.html",
  "quality_score": 88.0,
  "license": "MIT",
  "guide": "https://anyplot.ai/llms.txt"
}
Part of Basic ECDF Plot on anyplot.ai.