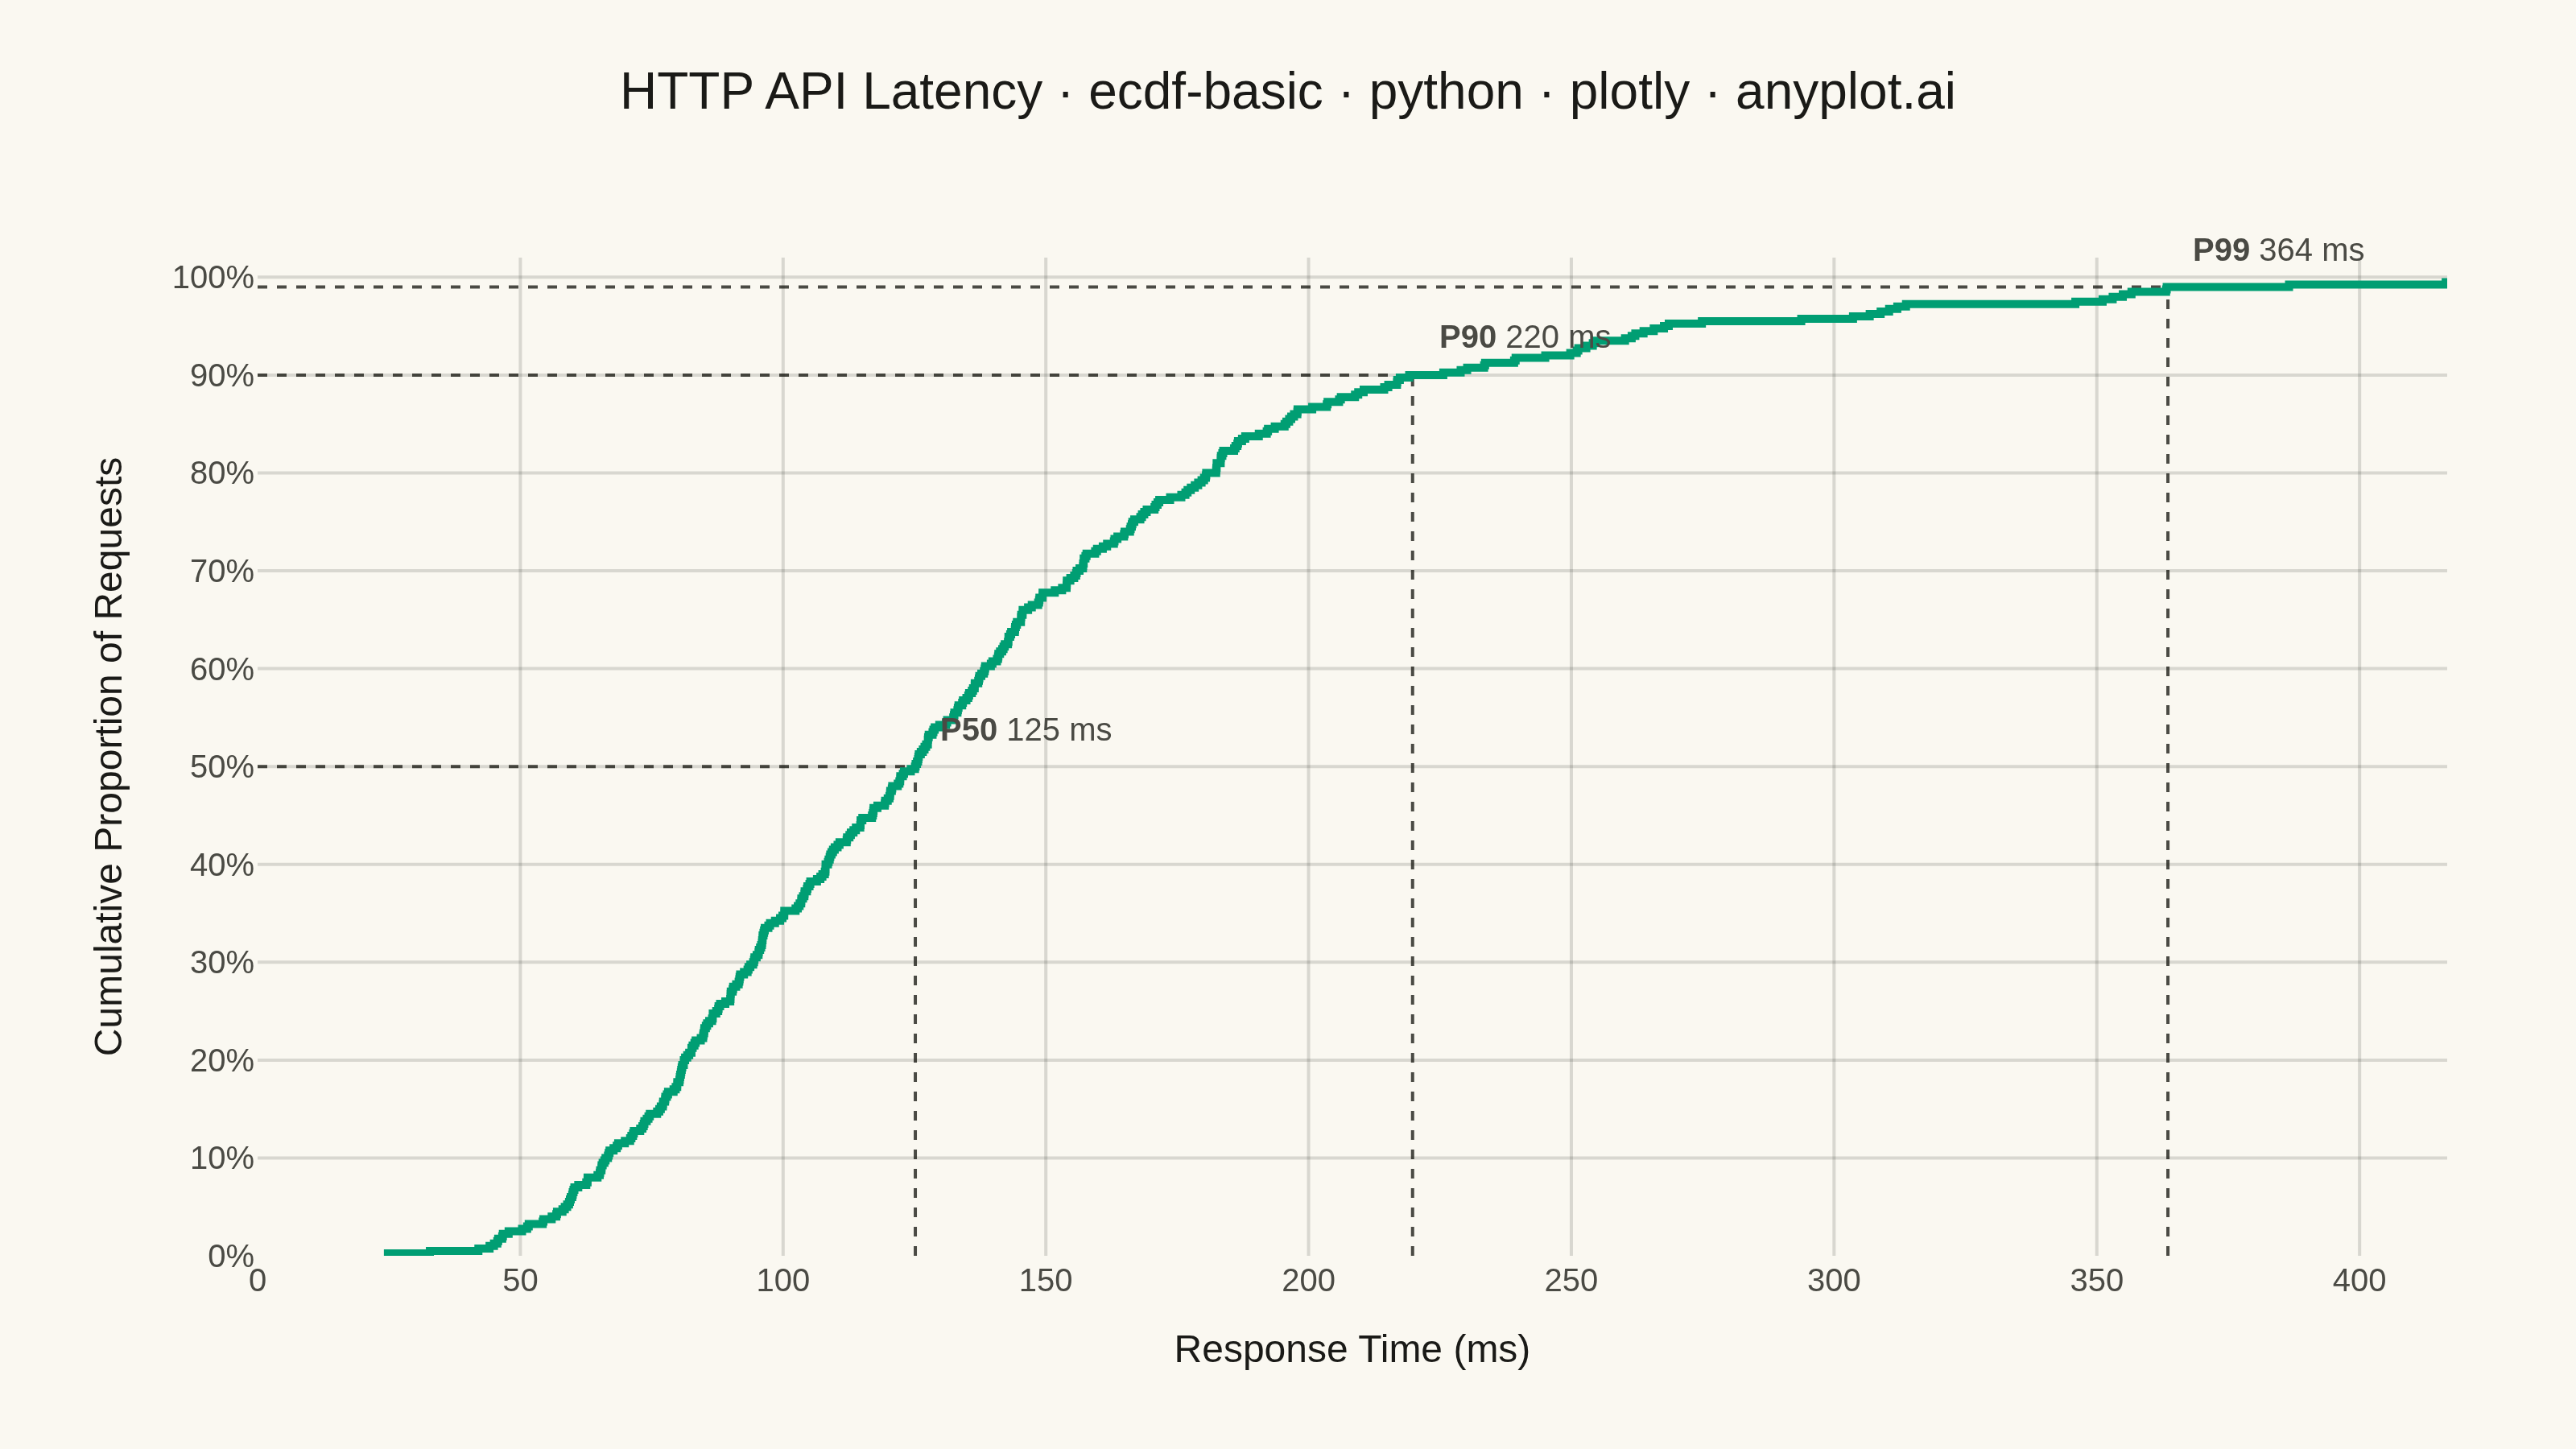
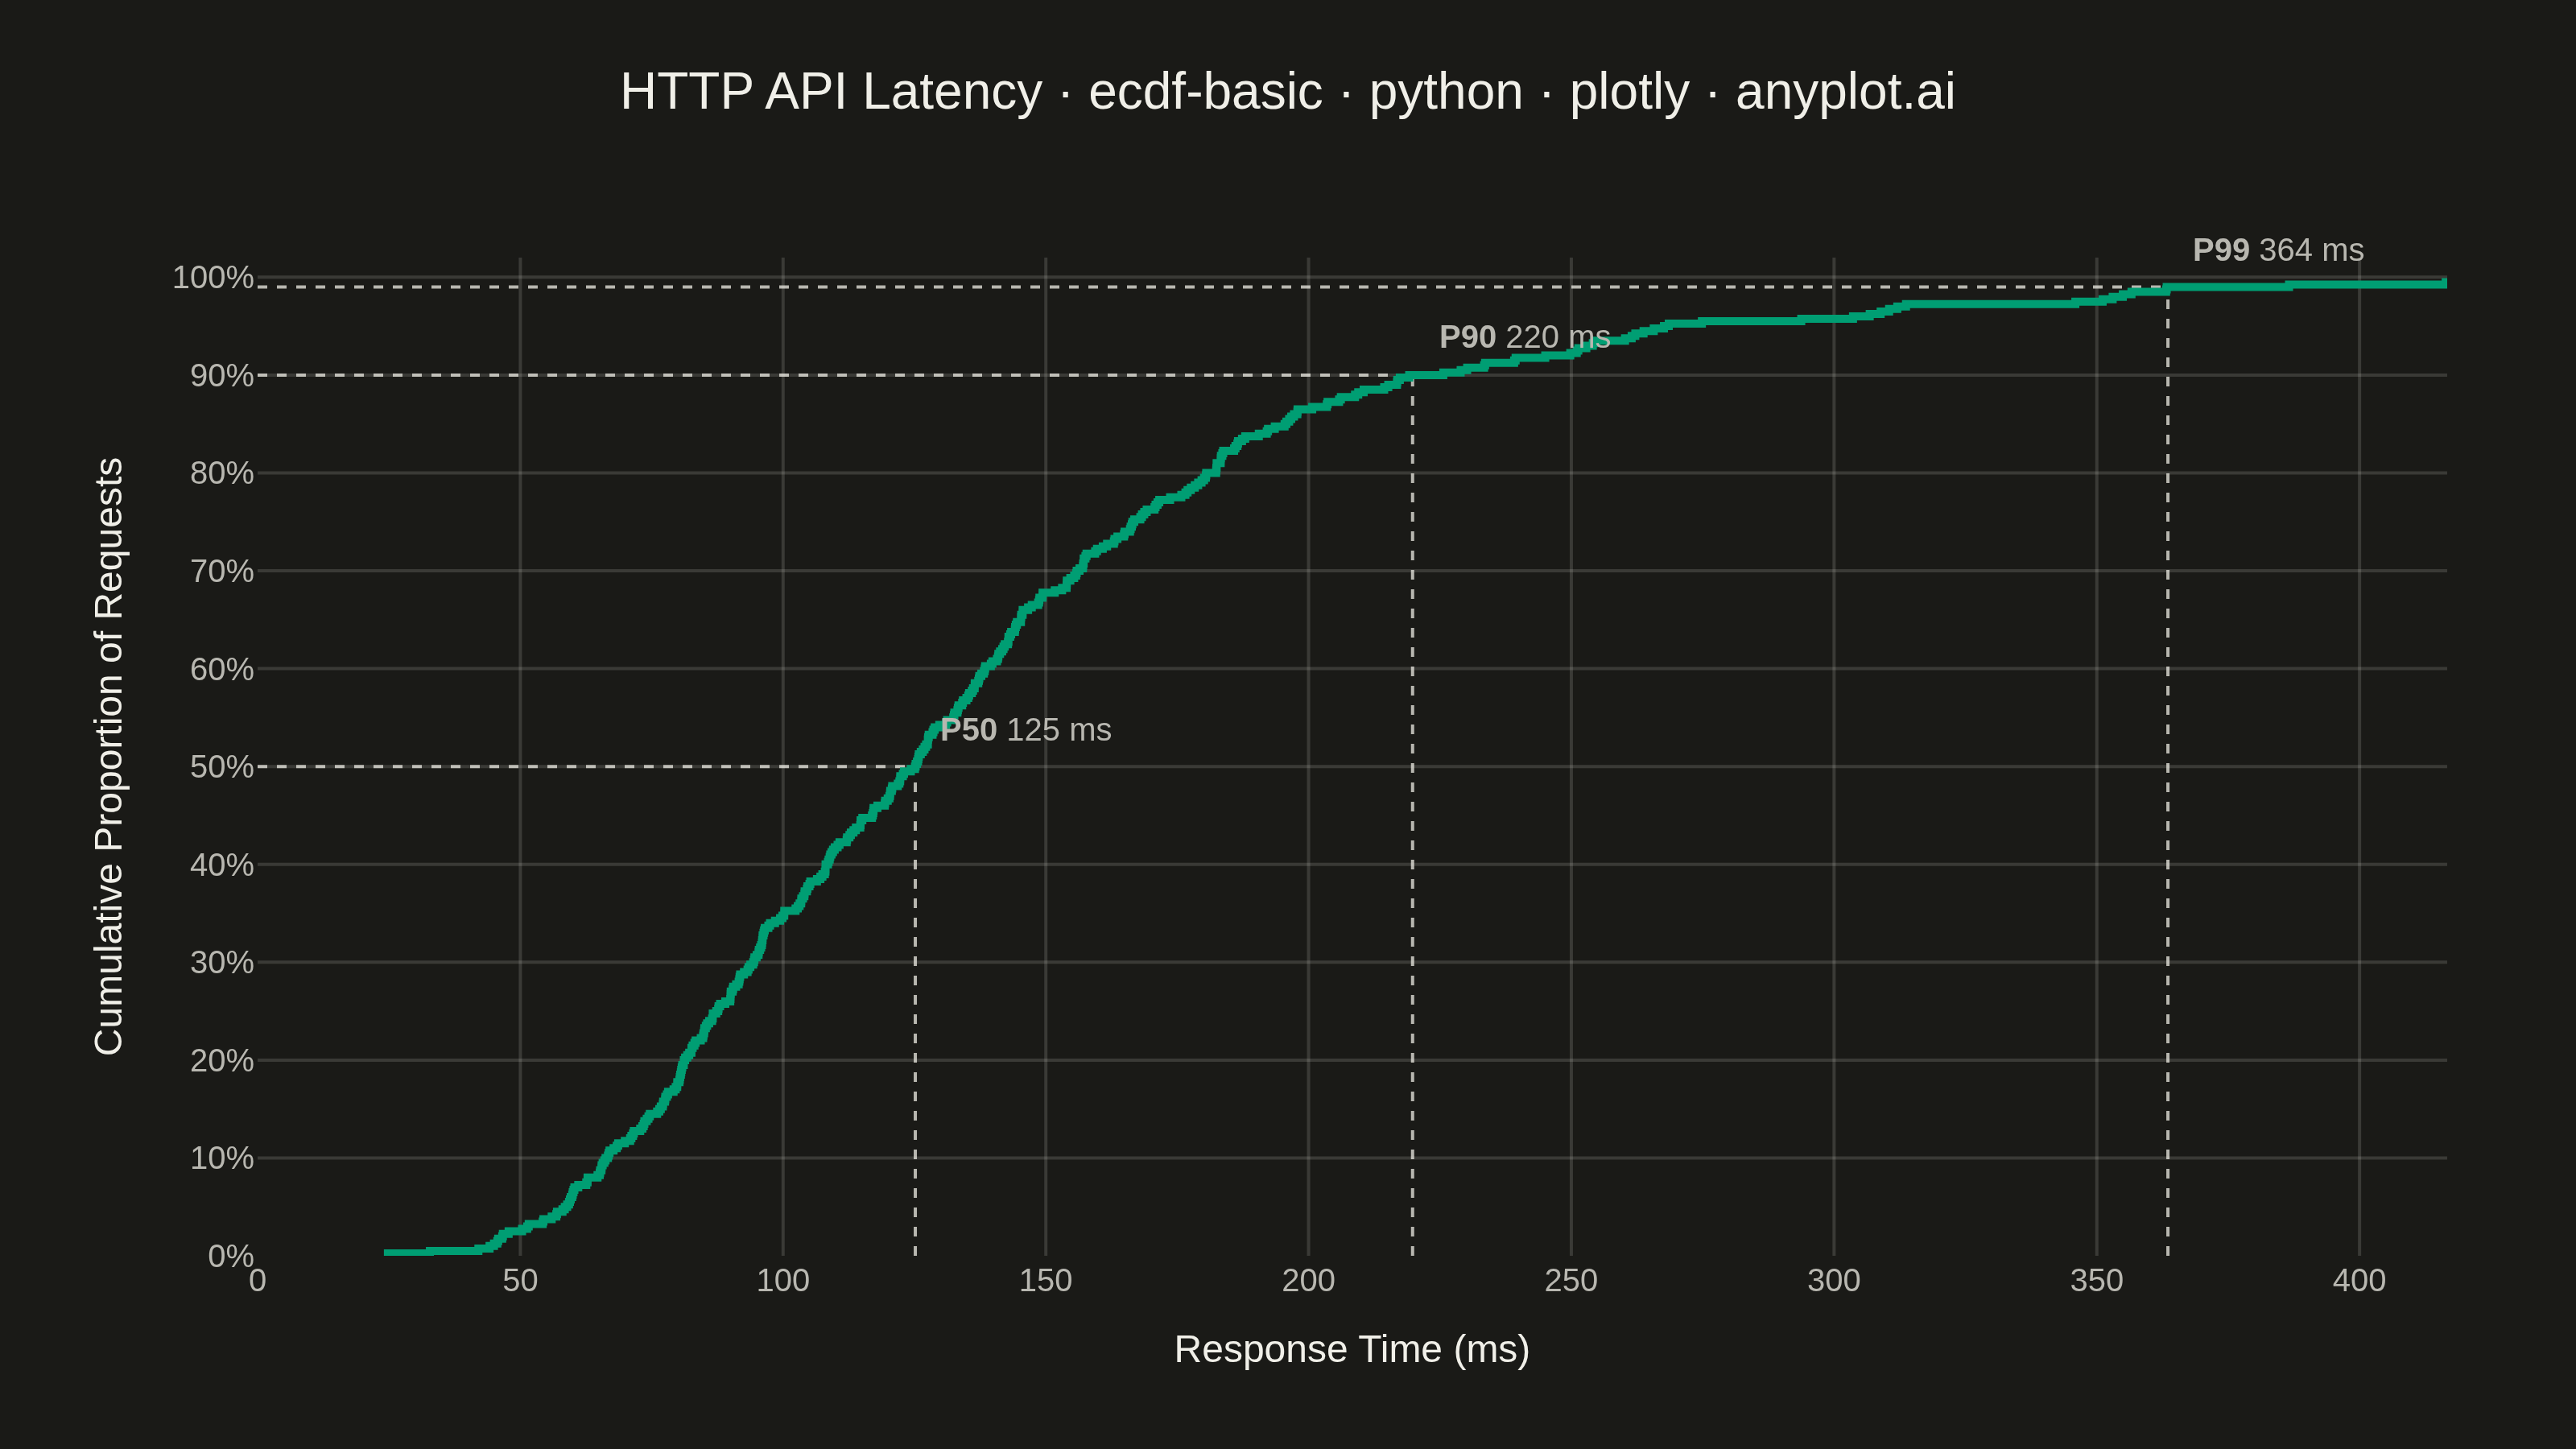
An ECDF (Empirical Cumulative Distribution Function) plot displays a step function that shows the proportion of observations less than or equal to each value. Unlike histograms, ECDF plots require no binning or smoothing, providing a non-parametric estimate of the cumulative distribution. The y-axis ranges from 0 to 1, allowing direct reading of percentiles and quantiles from the visualization.
""" anyplot.ai
ecdf-basic: Basic ECDF Plot
Library: plotly 6.8.0 | Python 3.13.14
Quality: 88/100 | Updated: 2026-06-25
"""

import os
import sys


# Remove the script's own directory from sys.path so this file doesn't shadow
# the installed plotly package (script is named plotly.py).
sys.path = [p for p in sys.path if p not in ("", os.path.dirname(os.path.abspath(__file__)))]

import numpy as np
import plotly.graph_objects as go


# Theme tokens
THEME = os.getenv("ANYPLOT_THEME", "light")
PAGE_BG = "#FAF8F1" if THEME == "light" else "#1A1A17"
ELEVATED_BG = "#FFFDF6" if THEME == "light" else "#242420"
INK = "#1A1A17" if THEME == "light" else "#F0EFE8"
INK_SOFT = "#4A4A44" if THEME == "light" else "#B8B7B0"
GRID = "rgba(26,26,23,0.15)" if THEME == "light" else "rgba(240,239,232,0.15)"
BRAND = "#009E73"  # Imprint palette position 1 — always first series
ANYPLOT_AMBER = "#DDCC77"  # annotation accent

# Data: HTTP API response latencies (ms) for 400 requests to a web service
np.random.seed(42)
n_requests = 400
# Lognormal distribution models real-world latency well (long right tail)
latency_ms = np.random.lognormal(mean=4.8, sigma=0.5, size=n_requests)

# ECDF
sorted_latency = np.sort(latency_ms)
cumulative_proportion = np.arange(1, n_requests + 1) / n_requests

# Key percentiles
p50 = np.percentile(sorted_latency, 50)
p90 = np.percentile(sorted_latency, 90)
p99 = np.percentile(sorted_latency, 99)
x_max = np.percentile(sorted_latency, 99.5)

# Plot
fig = go.Figure()

# ECDF line
fig.add_trace(
    go.Scatter(
        x=sorted_latency,
        y=cumulative_proportion,
        mode="lines",
        line={"color": BRAND, "width": 2.5, "shape": "hv"},
        hovertemplate="<b>Latency</b>: %{x:.1f} ms<br><b>Cumulative</b>: %{y:.1%}<extra></extra>",
        showlegend=False,
    )
)

# Percentile reference lines (dashed horizontal)
for pct_val, pct_label, y_pct in [(p50, "P50", 0.50), (p90, "P90", 0.90), (p99, "P99", 0.99)]:
    fig.add_shape(
        type="line",
        x0=0,
        x1=pct_val,
        y0=y_pct,
        y1=y_pct,
        line={"color": INK_SOFT, "width": 1, "dash": "dot"},
        layer="below",
    )
    fig.add_shape(
        type="line",
        x0=pct_val,
        x1=pct_val,
        y0=0,
        y1=y_pct,
        line={"color": INK_SOFT, "width": 1, "dash": "dot"},
        layer="below",
    )
    fig.add_annotation(
        x=pct_val,
        y=y_pct,
        text=f"<b>{pct_label}</b> {pct_val:.0f} ms",
        showarrow=False,
        xanchor="left",
        yanchor="bottom",
        xshift=6,
        yshift=4,
        font={"size": 10, "color": INK_SOFT},
    )

# Style
title_text = "HTTP API Latency · ecdf-basic · python · plotly · anyplot.ai"
fig.update_layout(
    autosize=False,
    title={"text": title_text, "font": {"size": 16, "color": INK}, "x": 0.5, "xanchor": "center", "y": 0.95},
    xaxis={
        "title": {"text": "Response Time (ms)", "font": {"size": 12, "color": INK}, "standoff": 12},
        "tickfont": {"size": 10, "color": INK_SOFT},
        "gridcolor": GRID,
        "gridwidth": 1,
        "linecolor": INK_SOFT,
        "zeroline": False,
        "showline": False,
        "mirror": False,
        "range": [0, x_max],
    },
    yaxis={
        "title": {"text": "Cumulative Proportion of Requests", "font": {"size": 12, "color": INK}, "standoff": 12},
        "tickfont": {"size": 10, "color": INK_SOFT},
        "gridcolor": GRID,
        "gridwidth": 1,
        "linecolor": INK_SOFT,
        "zeroline": False,
        "showline": False,
        "mirror": False,
        "range": [0, 1.02],
        "tickformat": ".0%",
        "dtick": 0.1,
    },
    paper_bgcolor=PAGE_BG,
    plot_bgcolor=PAGE_BG,
    font={"color": INK, "family": "Inter, Helvetica Neue, Arial, sans-serif"},
    margin={"l": 80, "r": 40, "t": 80, "b": 60},
    hovermode="x unified",
    hoverlabel={"bgcolor": ELEVATED_BG, "bordercolor": INK_SOFT, "font": {"color": INK, "size": 12}, "align": "left"},
)

# Save
fig.write_image(f"plot-{THEME}.png", width=800, height=450, scale=4)
fig.write_html(
    f"plot-{THEME}.html",
    include_plotlyjs="cdn",
    config={
        "displaylogo": False,
        "modeBarButtonsToRemove": ["lasso2d", "select2d", "autoScale2d"],
        "toImageButtonOptions": {"format": "png", "filename": "ecdf-basic-plotly"},
    },
)
Runnable source as JSON, for any HTTP client: https://api.anyplot.ai/specs/ecdf-basic/plotly/code. Any spec id and library id listed in llms-full.txt fit the same URL shape; every URL below is complete and callable.
{
  "spec_id": "ecdf-basic",
  "language": "python",
  "library": "plotly",
  "page": "https://anyplot.ai/ecdf-basic/python/plotly",
  "hub": "https://anyplot.ai/ecdf-basic",
  "code_json": "https://api.anyplot.ai/specs/ecdf-basic/plotly/code",
  "spec_json": "https://api.anyplot.ai/specs/ecdf-basic",
  "render_light_png": "https://storage.googleapis.com/anyplot-images/plots/ecdf-basic/python/plotly/plot-light.png",
  "render_dark_png": "https://storage.googleapis.com/anyplot-images/plots/ecdf-basic/python/plotly/plot-dark.png",
  "interactive_light_html": "https://storage.googleapis.com/anyplot-images/plots/ecdf-basic/python/plotly/plot-light.html",
  "interactive_dark_html": "https://storage.googleapis.com/anyplot-images/plots/ecdf-basic/python/plotly/plot-dark.html",
  "quality_score": 88.0,
  "license": "MIT",
  "guide": "https://anyplot.ai/llms.txt"
}
Part of Basic ECDF Plot on anyplot.ai.