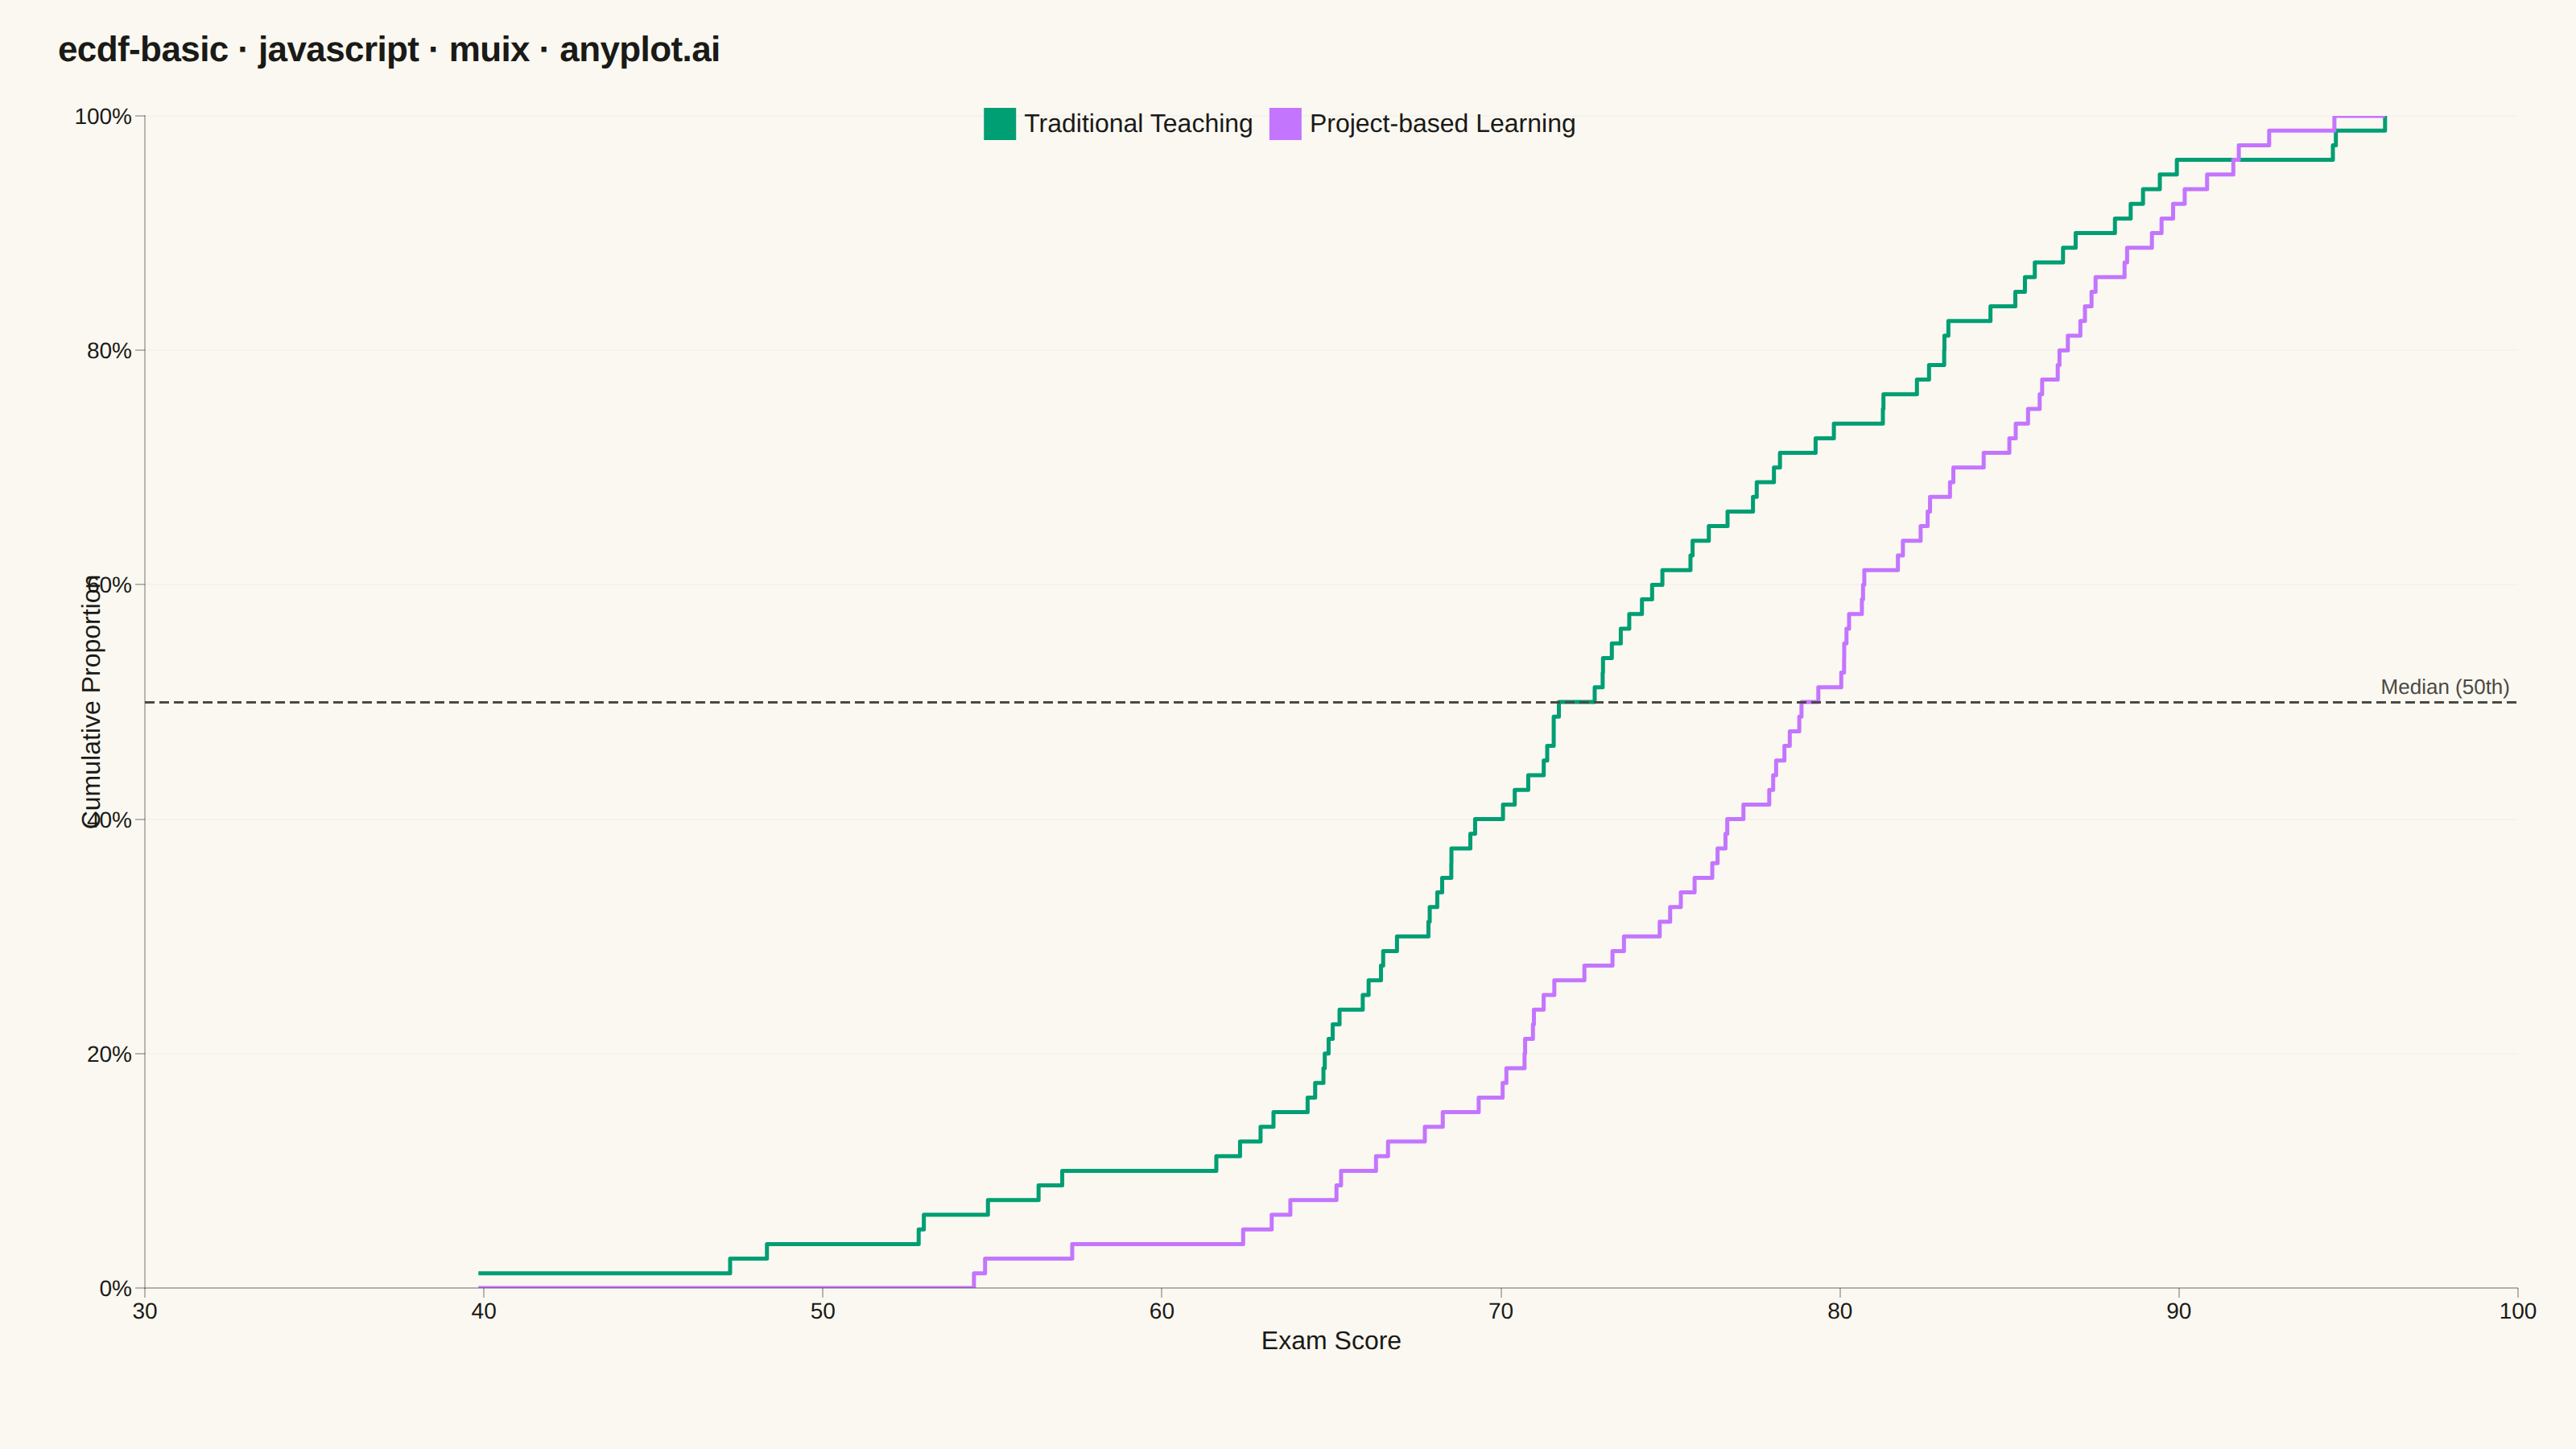
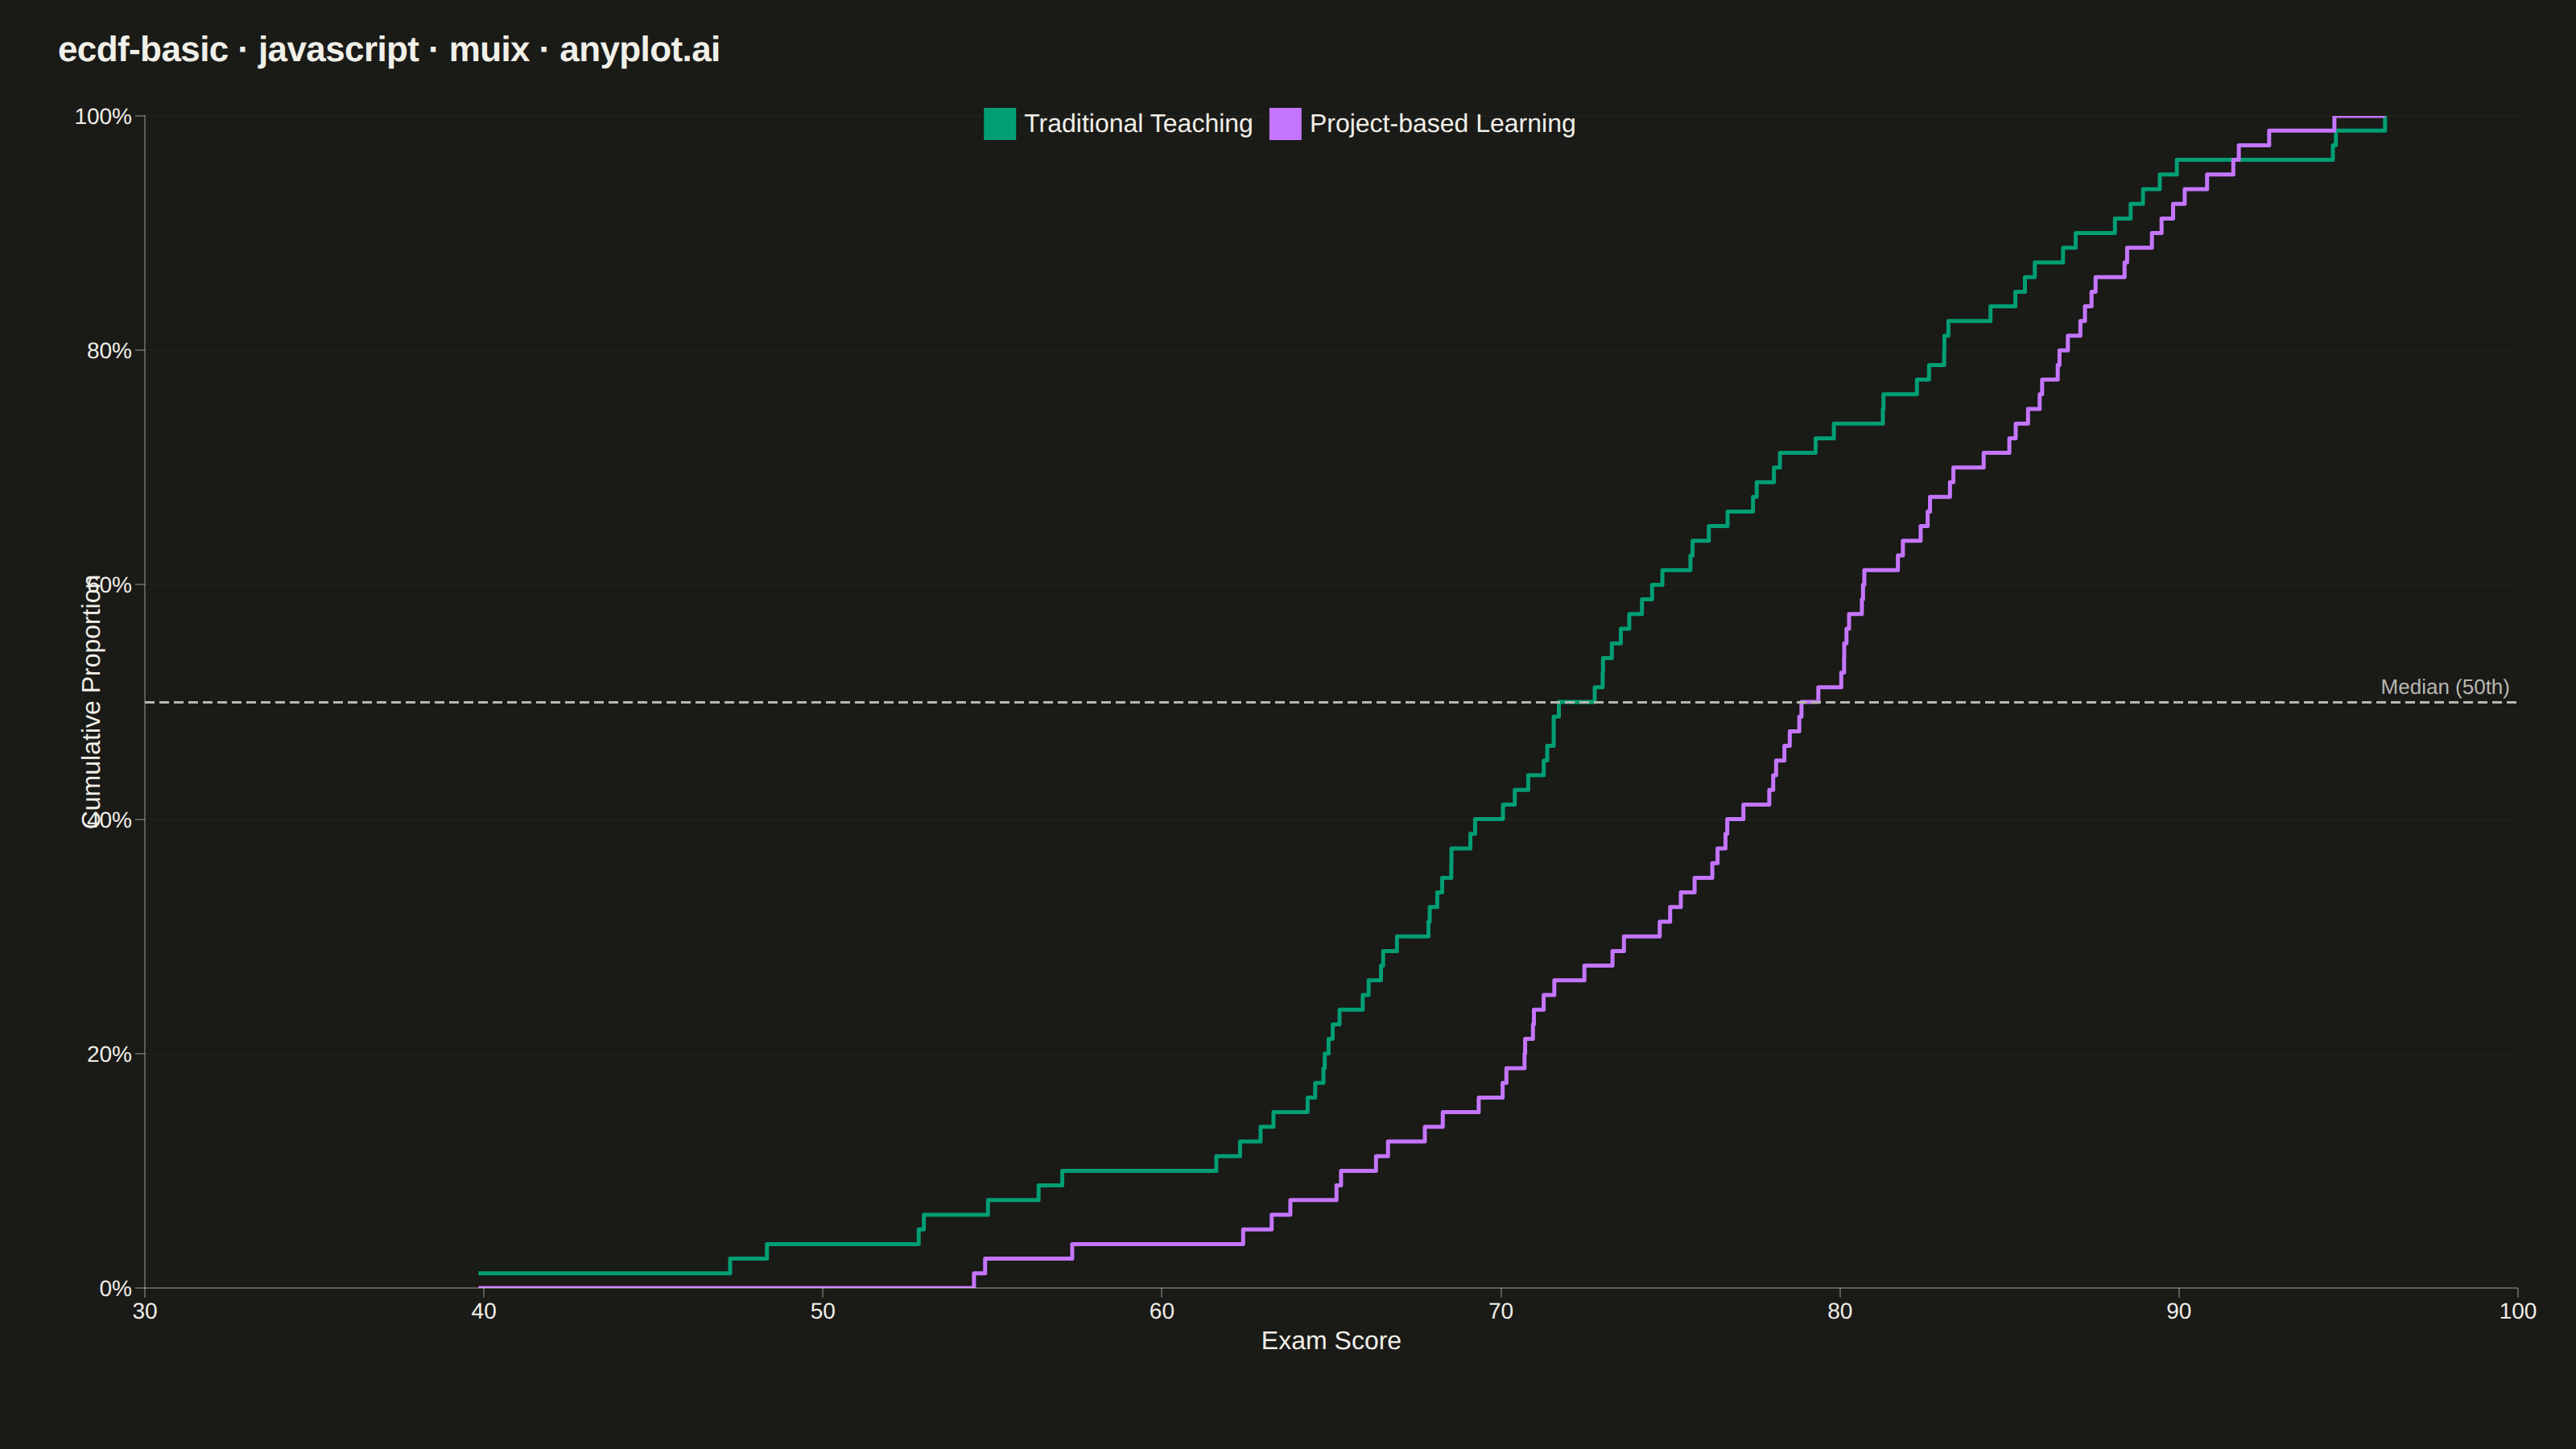
The same plot in 14 other libraries — JavaScript: Chart.js, D3.js, Apache ECharts, Highcharts; Python: Altair, Bokeh, lets-plot, Matplotlib, Plotly, plotnine, Pygal, Seaborn; R: ggplot2; Julia: Makie.jl. Compare all 15 side by side: Basic ECDF Plot in Python, R, Julia and JavaScript.
An ECDF (Empirical Cumulative Distribution Function) plot displays a step function that shows the proportion of observations less than or equal to each value. Unlike histograms, ECDF plots require no binning or smoothing, providing a non-parametric estimate of the cumulative distribution. The y-axis ranges from 0 to 1, allowing direct reading of percentiles and quantiles from the visualization.
// anyplot.ai
// ecdf-basic: Basic ECDF Plot
// Library: muix 7.29.1 | JavaScript 22.22.3
// Quality: 88/100 | Created: 2026-06-25
//# anyplot-orientation: landscape
// anyplot.ai
// ecdf-basic: Basic ECDF Plot
// Library: MUI X Charts | React | Node 22
// License: @mui/x-charts — MIT (community). Pro/Premium are out of scope.
// Quality: pending | Created: 2026-06-25

import { LineChart } from "@mui/x-charts/LineChart";
import { ChartsReferenceLine } from "@mui/x-charts/ChartsReferenceLine";

const t = window.ANYPLOT_TOKENS;

// Seeded LCG for deterministic data generation (no seeded RNG in browser)
let seed = 42;
function rand() {
  seed = (Math.imul(1664525, seed) + 1013904223) | 0;
  return (seed >>> 0) / 4294967296;
}
function randn() {
  const u = Math.max(rand(), 1e-10);
  return Math.sqrt(-2 * Math.log(u)) * Math.cos(2 * Math.PI * rand());
}
function normalSorted(mean, std, n) {
  return Array.from({ length: n }, () => mean + std * randn()).sort((a, b) => a - b);
}

// Exam scores from two teaching methods, 80 students each
const N = 80;
const traditional = normalSorted(72, 12, N);   // Traditional instruction: μ=72, σ=12
const projectBased = normalSorted(78, 10, N);  // Project-based learning:  μ=78, σ=10

// Merge and sort all x-values to build a shared axis for both ECDF curves
const allX = [...traditional, ...projectBased].sort((a, b) => a - b);

// ECDF: fraction of observations ≤ x evaluated at every merged x-value
function computeEcdf(sorted, xValues) {
  let j = 0;
  return xValues.map((x) => {
    while (j < sorted.length && sorted[j] <= x) j++;
    return j / sorted.length;
  });
}

const ecdfTrad = computeEcdf(traditional, allX);
const ecdfProj = computeEcdf(projectBased, allX);

const TITLE_H = 52;

export default function Chart() {
  const W = window.ANYPLOT_SIZE.width;
  const H = window.ANYPLOT_SIZE.height;

  return (
    <div
      style={{
        width: W,
        height: H,
        display: "flex",
        flexDirection: "column",
        backgroundColor: t.pageBg,
      }}
    >
      <div
        style={{
          padding: "18px 36px 0",
          fontSize: 22,
          fontWeight: 600,
          color: t.ink,
          height: TITLE_H,
          boxSizing: "border-box",
          fontFamily: "sans-serif",
          letterSpacing: "-0.3px",
        }}
      >
        ecdf-basic · javascript · muix · anyplot.ai
      </div>
      <LineChart
        width={W}
        height={H - TITLE_H}
        skipAnimation
        series={[
          {
            data: ecdfTrad,
            curve: "stepAfter",
            label: "Traditional Teaching",
            showMark: false,
            color: t.palette[0],
          },
          {
            data: ecdfProj,
            curve: "stepAfter",
            label: "Project-based Learning",
            showMark: false,
            color: t.palette[1],
          },
        ]}
        xAxis={[
          {
            data: allX,
            label: "Exam Score",
            tickMinStep: 10,
            valueFormatter: (v) => String(Math.round(v)),
            tickLabelStyle: { fontSize: 14 },
            labelStyle: { fontSize: 16 },
          },
        ]}
        yAxis={[
          {
            min: 0,
            max: 1,
            label: "Cumulative Proportion",
            tickMinStep: 0.25,
            valueFormatter: (v) => `${Math.round(v * 100)}%`,
            tickLabelStyle: { fontSize: 14 },
            labelStyle: { fontSize: 16 },
          },
        ]}
        grid={{ horizontal: true }}
        sx={{
          "& .MuiLineElement-root": { strokeWidth: 2.5 },
          "& .MuiChartsGrid-line": { strokeOpacity: 0.15 },
          "& .MuiChartsAxis-line": { strokeOpacity: 0.3 },
          "& .MuiChartsAxis-tick": { strokeOpacity: 0.3 },
        }}
        margin={{ left: 90, right: 36, top: 20, bottom: 100 }}
      >
        <ChartsReferenceLine
          y={0.5}
          label="Median (50th)"
          labelAlign="end"
          lineStyle={{
            stroke: t.inkSoft,
            strokeDasharray: "6 3",
            strokeWidth: 1.5,
          }}
          labelStyle={{ fontSize: 13, fill: t.inkSoft }}
        />
      </LineChart>
    </div>
  );
}
Runnable source as JSON, for any HTTP client: https://api.anyplot.ai/specs/ecdf-basic/muix/code. Any spec id and library id listed in llms-full.txt fit the same URL shape; every URL below is complete and callable.
{
  "spec_id": "ecdf-basic",
  "language": "javascript",
  "library": "muix",
  "page": "https://anyplot.ai/ecdf-basic/javascript/muix",
  "hub": "https://anyplot.ai/ecdf-basic",
  "code_json": "https://api.anyplot.ai/specs/ecdf-basic/muix/code",
  "spec_json": "https://api.anyplot.ai/specs/ecdf-basic",
  "render_light_png": "https://storage.googleapis.com/anyplot-images/plots/ecdf-basic/javascript/muix/plot-light.png",
  "render_dark_png": "https://storage.googleapis.com/anyplot-images/plots/ecdf-basic/javascript/muix/plot-dark.png",
  "interactive_light_html": "https://storage.googleapis.com/anyplot-images/plots/ecdf-basic/javascript/muix/plot-light.html",
  "interactive_dark_html": "https://storage.googleapis.com/anyplot-images/plots/ecdf-basic/javascript/muix/plot-dark.html",
  "quality_score": 88.0,
  "license": "MIT",
  "guide": "https://anyplot.ai/llms.txt"
}
Part of Basic ECDF Plot on anyplot.ai.