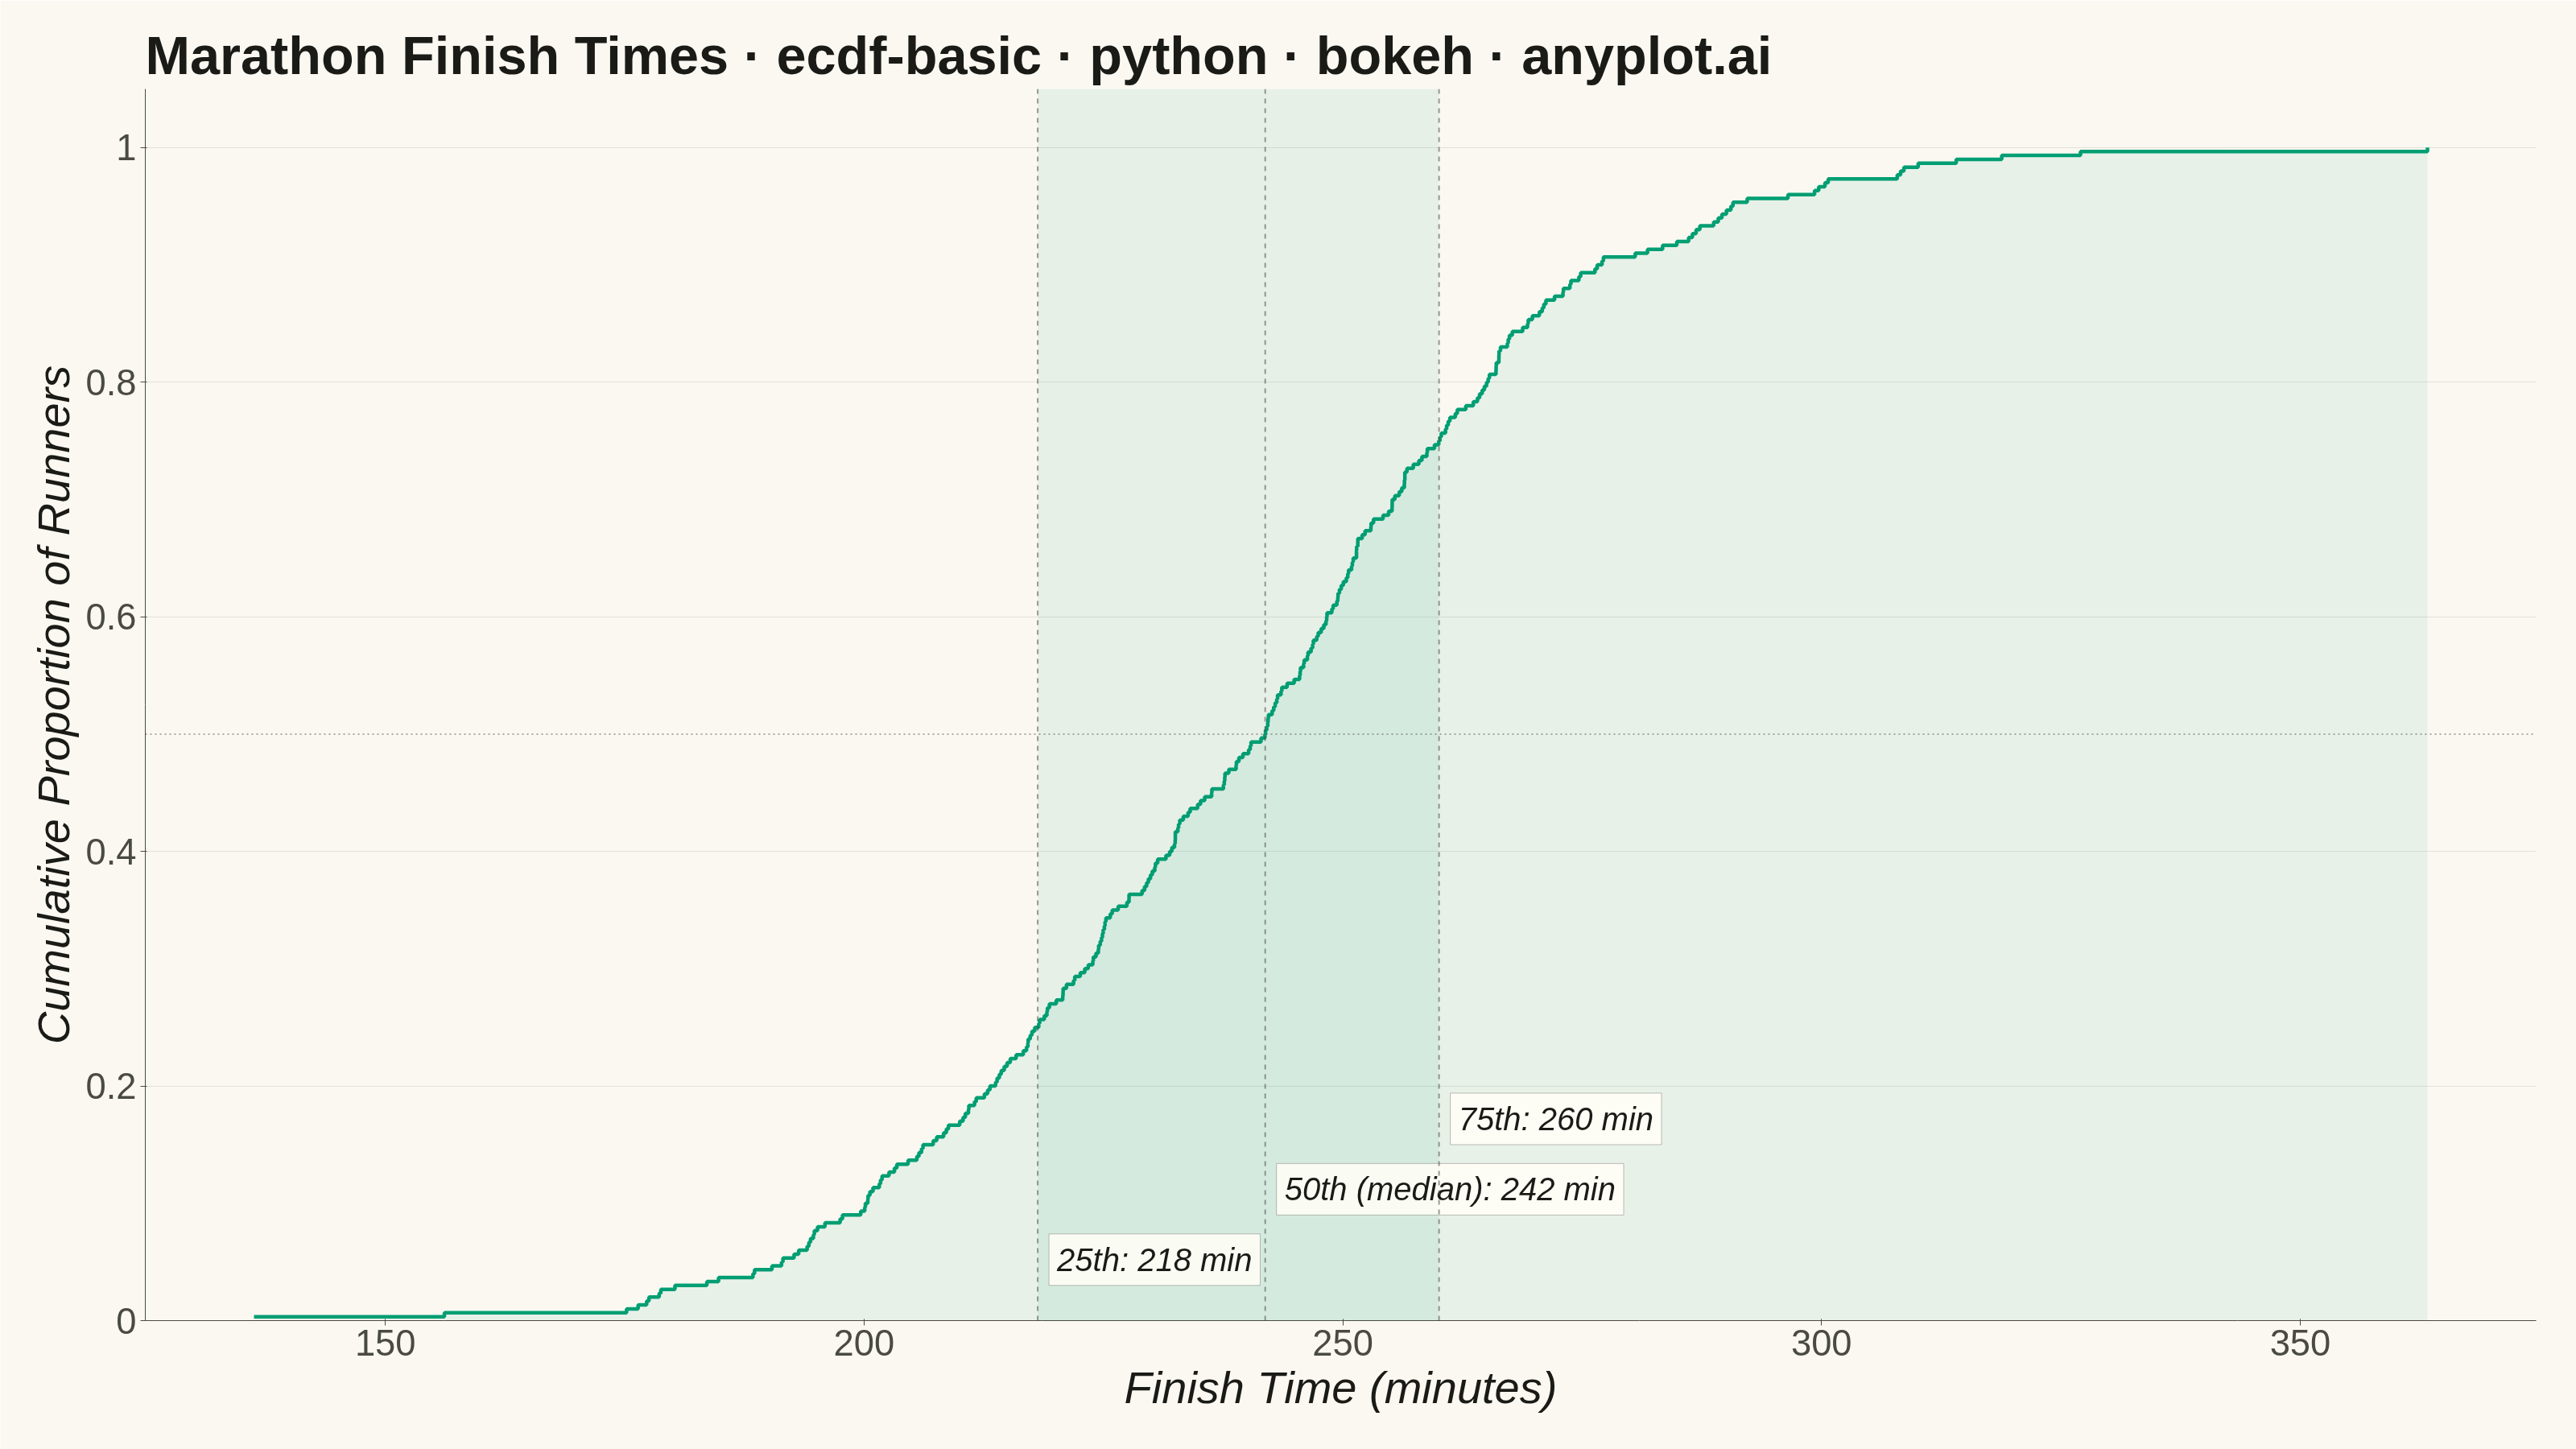
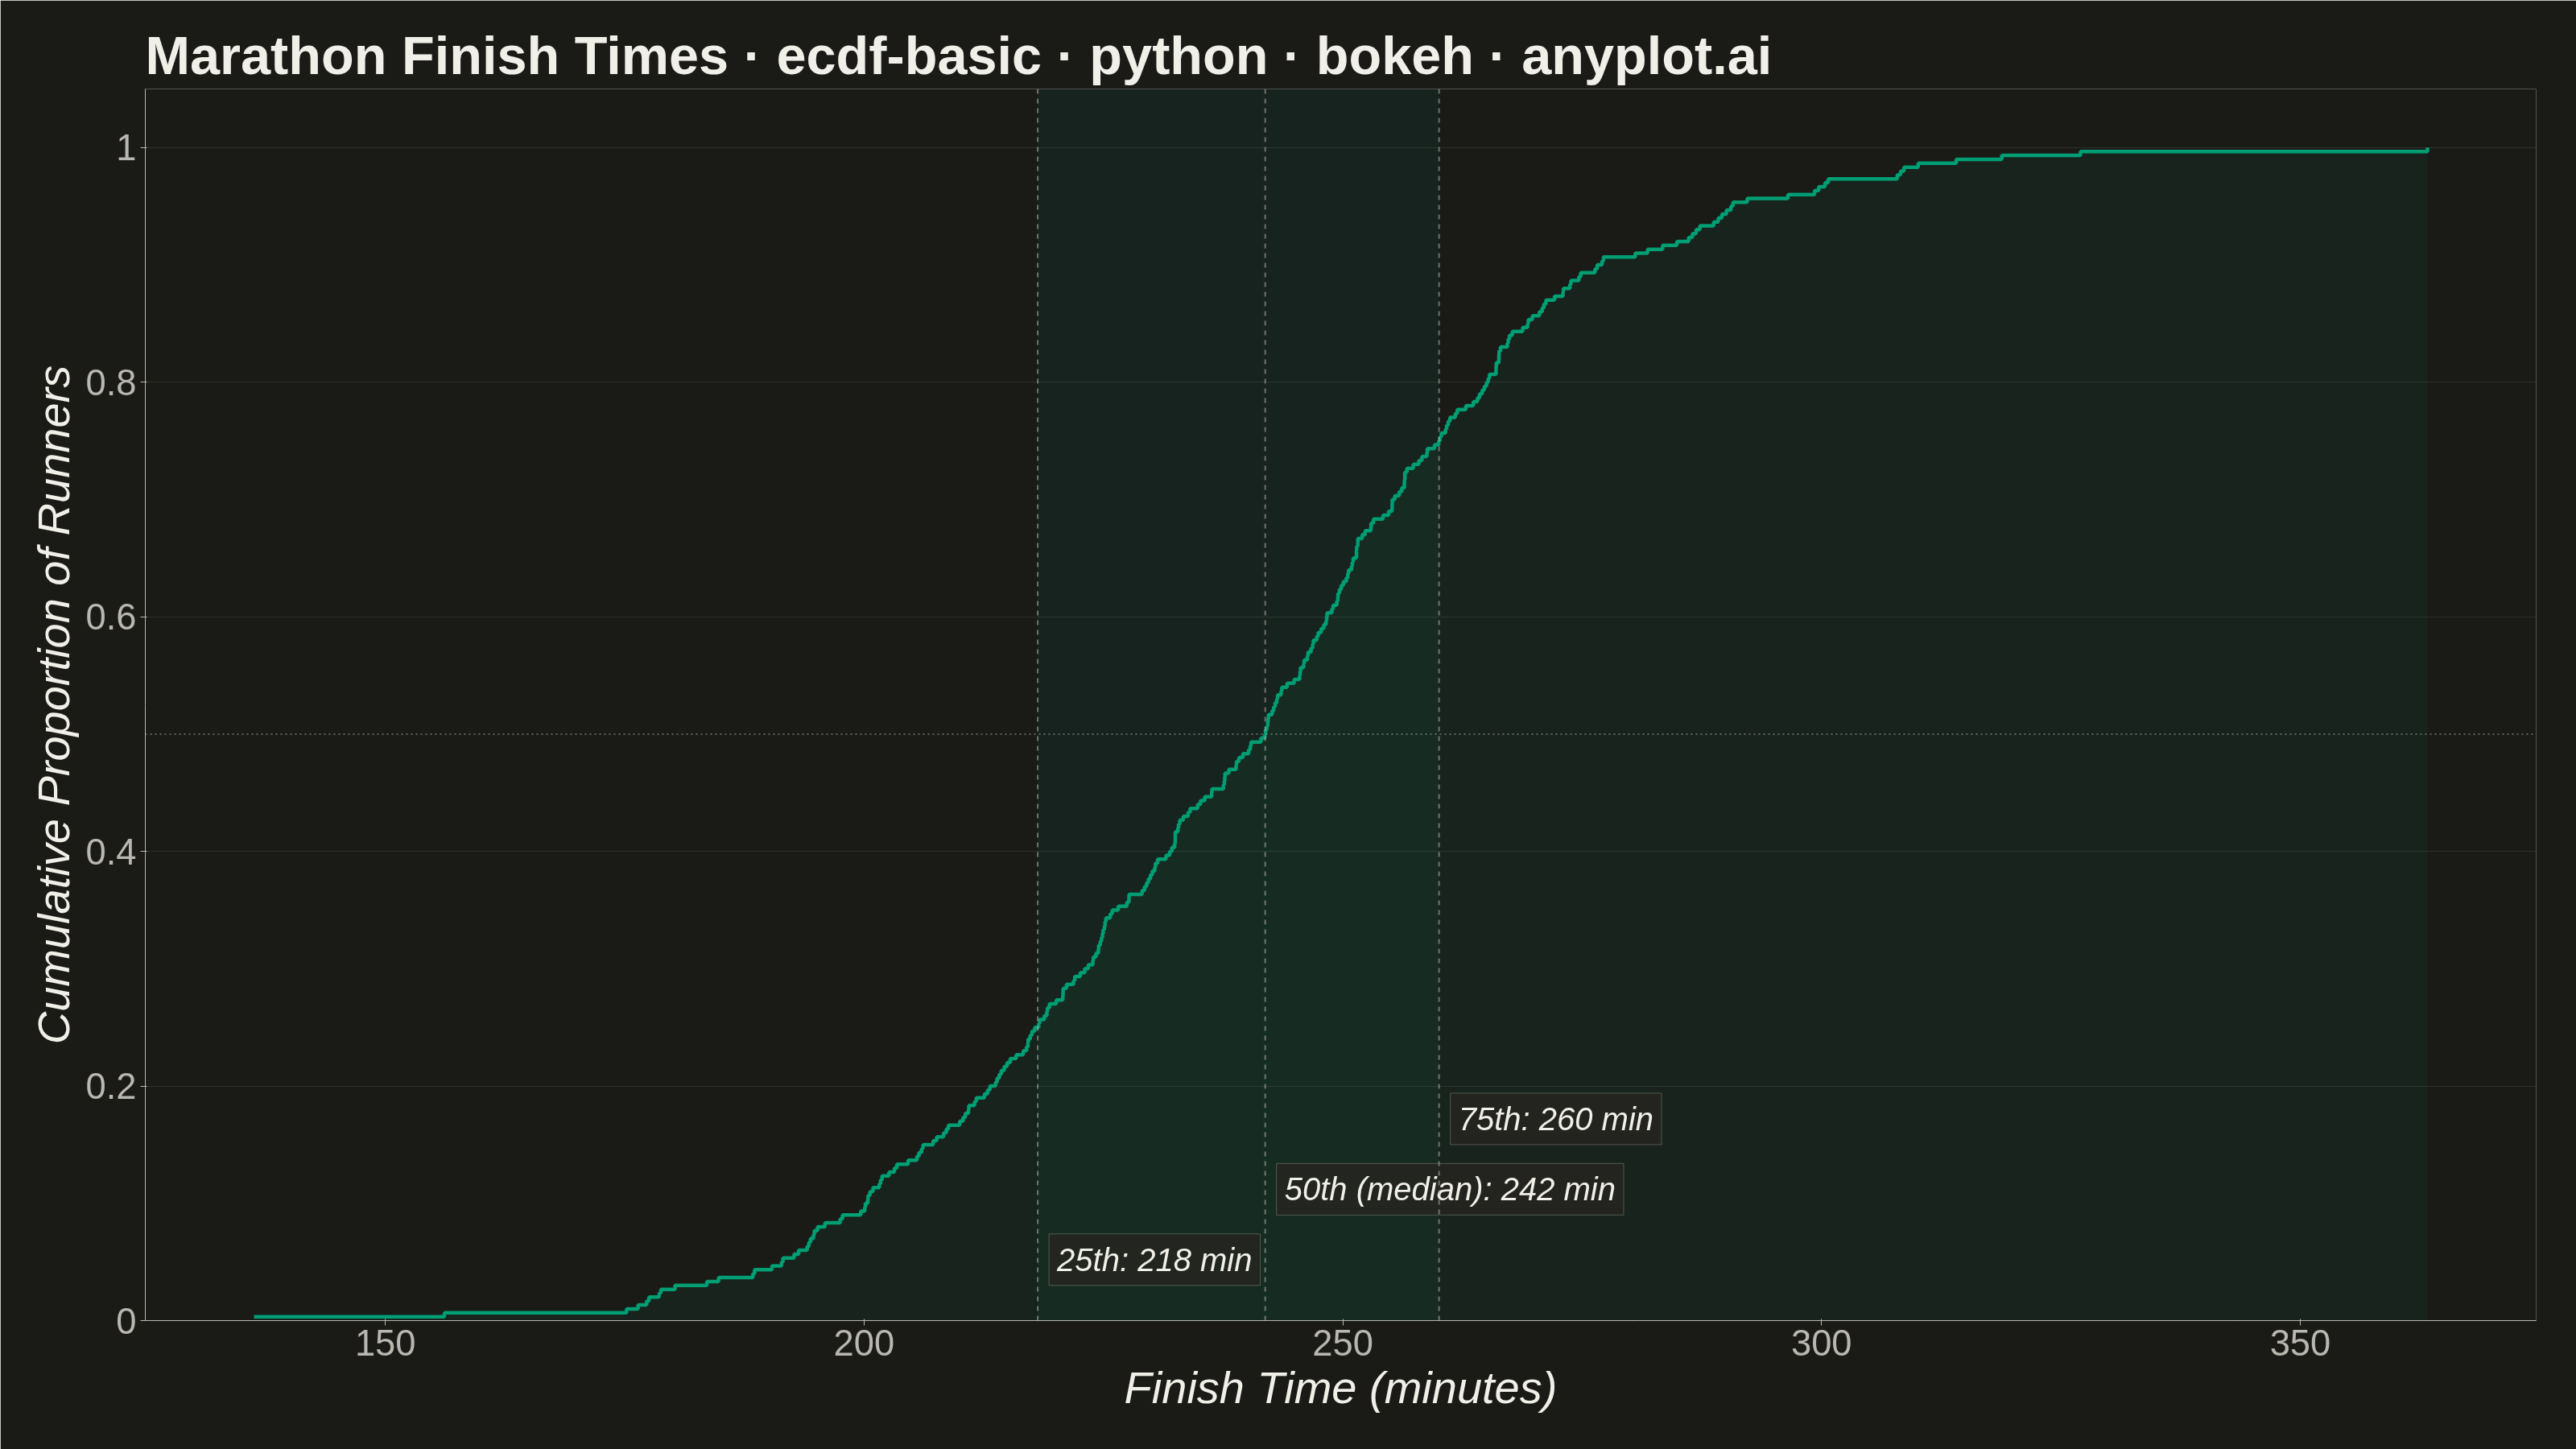
An ECDF (Empirical Cumulative Distribution Function) plot displays a step function that shows the proportion of observations less than or equal to each value. Unlike histograms, ECDF plots require no binning or smoothing, providing a non-parametric estimate of the cumulative distribution. The y-axis ranges from 0 to 1, allowing direct reading of percentiles and quantiles from the visualization.
""" anyplot.ai
ecdf-basic: Basic ECDF Plot
Library: bokeh 3.9.1 | Python 3.13.14
Quality: 89/100 | Updated: 2026-06-25
"""

import io
import os
import sys
import time
from pathlib import Path


# Remove script directory from sys.path to avoid shadowing the bokeh package
sys.path = [p for p in sys.path if Path(p).resolve() != Path(__file__).resolve().parent]

import numpy as np
from bokeh.io import output_file, save
from bokeh.models import BoxAnnotation, ColumnDataSource, CrosshairTool, CustomJSHover, HoverTool, Label, Span
from bokeh.plotting import figure
from PIL import Image
from selenium import webdriver
from selenium.webdriver.chrome.options import Options


# Theme tokens
THEME = os.getenv("ANYPLOT_THEME", "light")
PAGE_BG = "#FAF8F1" if THEME == "light" else "#1A1A17"
ELEVATED_BG = "#FFFDF6" if THEME == "light" else "#242420"
INK = "#1A1A17" if THEME == "light" else "#F0EFE8"
INK_SOFT = "#4A4A44" if THEME == "light" else "#B8B7B0"
BRAND = "#009E73"  # Imprint palette position 1 — always first series

# Data: marathon finish times (minutes) for 300 recreational runners
np.random.seed(42)
n_runners = 300
finish_times = np.random.normal(loc=240, scale=32, size=n_runners)

# ECDF calculation
sorted_times = np.sort(finish_times)
cumulative = np.arange(1, n_runners + 1) / n_runners

# Key percentiles
q25, q50, q75 = np.percentile(sorted_times, [25, 50, 75])

# Staircase x/y for area fill matching step-after mode exactly
step_x_fill = np.concatenate([[sorted_times[0]], np.repeat(sorted_times[1:], 2)])
step_y_fill = np.repeat(cumulative, 2)[:-1]

source = ColumnDataSource(data={"x": sorted_times, "y": cumulative})

# Plot — 3200×1800 landscape canvas (hard rule)
title = "Marathon Finish Times · ecdf-basic · python · bokeh · anyplot.ai"
p = figure(
    width=3200,
    height=1800,
    title=title,
    x_axis_label="Finish Time (minutes)",
    y_axis_label="Cumulative Proportion of Runners",
    y_range=(0, 1.05),
    background_fill_color=PAGE_BG,
    border_fill_color=PAGE_BG,
    toolbar_location=None,
    min_border_bottom=160,
    min_border_left=180,
    min_border_top=110,
    min_border_right=50,
)

# IQR shaded band (Q1–Q3): focal emphasis for distribution spread
iqr_band = BoxAnnotation(left=q25, right=q75, fill_color=BRAND, fill_alpha=0.08, line_color=None)
p.add_layout(iqr_band)

# Subtle area fill under the ECDF step curve
p.varea(x=step_x_fill, y1=np.zeros_like(step_x_fill), y2=step_y_fill, fill_color=BRAND, fill_alpha=0.07)

# ECDF step line — step-after matches the 1/n jump at each observation
step_renderer = p.step(x="x", y="y", source=source, line_width=4.5, line_color=BRAND, mode="after")

# Horizontal reference at y=0.5 — makes median reading effortless
p.add_layout(
    Span(location=0.5, dimension="width", line_color=INK_SOFT, line_dash="dotted", line_width=2, line_alpha=0.45)
)

# Percentile vertical reference lines with staggered labels to avoid overlap
percentile_annotations = [(q25, "25th", 0.03), (q50, "50th (median)", 0.09), (q75, "75th", 0.15)]
for q_val, q_lbl, y_pos in percentile_annotations:
    p.add_layout(
        Span(location=q_val, dimension="height", line_color=INK_SOFT, line_dash="dashed", line_width=2, line_alpha=0.55)
    )
    p.add_layout(
        Label(
            x=q_val,
            y=y_pos,
            text=f"{q_lbl}: {q_val:.0f} min",
            text_font_size="30pt",
            text_color=INK,
            text_font_style="italic",
            x_offset=14,
            background_fill_color=ELEVATED_BG,
            background_fill_alpha=0.88,
            border_line_color=INK_SOFT,
            border_line_alpha=0.35,
            padding=10,
        )
    )

# Custom JS hover formatters — distinctively Bokeh: show runner count alongside percentage
fmt_time = CustomJSHover(code="return value.toFixed(0) + ' min'")
fmt_pct = CustomJSHover(
    code=f"""
    const pct = (value * 100).toFixed(1);
    const runners = Math.round(value * {n_runners});
    return pct + '% — ' + runners + '/{n_runners} runners';
"""
)

# Interactive tools — Bokeh strengths
p.add_tools(
    HoverTool(
        renderers=[step_renderer],
        tooltips=[("Finish Time", "@x{custom}"), ("Cumulative", "@y{custom}")],
        formatters={"@x": fmt_time, "@y": fmt_pct},
        mode="vline",
    )
)
p.add_tools(CrosshairTool(dimensions="both", line_color=INK_SOFT, line_alpha=0.45))

# Typography — canonical Bokeh sizing for 3200×1800
p.title.text_font_size = "50pt"
p.title.text_color = INK
p.title.text_font_style = "bold"
p.xaxis.axis_label_text_font_size = "42pt"
p.yaxis.axis_label_text_font_size = "42pt"
p.xaxis.major_label_text_font_size = "34pt"
p.yaxis.major_label_text_font_size = "34pt"

# Chrome colors
p.xaxis.axis_label_text_color = INK
p.yaxis.axis_label_text_color = INK
p.xaxis.major_label_text_color = INK_SOFT
p.yaxis.major_label_text_color = INK_SOFT
p.xaxis.axis_line_color = INK_SOFT
p.yaxis.axis_line_color = INK_SOFT
p.xaxis.major_tick_line_color = INK_SOFT
p.yaxis.major_tick_line_color = INK_SOFT
p.xaxis.minor_tick_line_color = None
p.yaxis.minor_tick_line_color = None

# Grid: y-only, subtle; no box outline
p.outline_line_color = None
p.xgrid.grid_line_color = None
p.ygrid.grid_line_color = INK
p.ygrid.grid_line_alpha = 0.10

# Save — HTML artifact, then screenshot via headless Chrome (Selenium 4)
output_file(f"plot-{THEME}.html", title=title)
save(p)

# H+200 gives Chrome UI overhead headroom; PIL crops to exact canvas dims after.
W, H = 3200, 1800
opts = Options()
for arg in (
    "--headless=new",
    "--no-sandbox",
    "--disable-dev-shm-usage",
    "--disable-gpu",
    f"--window-size={W},{H + 200}",
    "--hide-scrollbars",
    "--force-device-scale-factor=1",
):
    opts.add_argument(arg)
driver = webdriver.Chrome(options=opts)
driver.set_window_size(W, H + 200)
driver.get(f"file://{Path(f'plot-{THEME}.html').resolve()}")
time.sleep(3)
raw = driver.get_screenshot_as_png()
driver.quit()
Image.open(io.BytesIO(raw)).crop((0, 0, W, H)).save(f"plot-{THEME}.png")
Runnable source as JSON, for any HTTP client: https://api.anyplot.ai/specs/ecdf-basic/bokeh/code. Any spec id and library id listed in llms-full.txt fit the same URL shape; every URL below is complete and callable.
{
  "spec_id": "ecdf-basic",
  "language": "python",
  "library": "bokeh",
  "page": "https://anyplot.ai/ecdf-basic/python/bokeh",
  "hub": "https://anyplot.ai/ecdf-basic",
  "code_json": "https://api.anyplot.ai/specs/ecdf-basic/bokeh/code",
  "spec_json": "https://api.anyplot.ai/specs/ecdf-basic",
  "render_light_png": "https://storage.googleapis.com/anyplot-images/plots/ecdf-basic/python/bokeh/plot-light.png",
  "render_dark_png": "https://storage.googleapis.com/anyplot-images/plots/ecdf-basic/python/bokeh/plot-dark.png",
  "interactive_light_html": "https://storage.googleapis.com/anyplot-images/plots/ecdf-basic/python/bokeh/plot-light.html",
  "interactive_dark_html": "https://storage.googleapis.com/anyplot-images/plots/ecdf-basic/python/bokeh/plot-dark.html",
  "quality_score": 89.0,
  "license": "MIT",
  "guide": "https://anyplot.ai/llms.txt"
}
Part of Basic ECDF Plot on anyplot.ai.