The same plot in 14 other libraries — JavaScript: Chart.js, D3.js, Apache ECharts, MUI X Charts; Python: Altair, Bokeh, lets-plot, Matplotlib, Plotly, plotnine, Pygal, Seaborn; R: ggplot2; Julia: Makie.jl. Compare all 15 side by side: Basic ECDF Plot in Python, R, Julia and JavaScript.
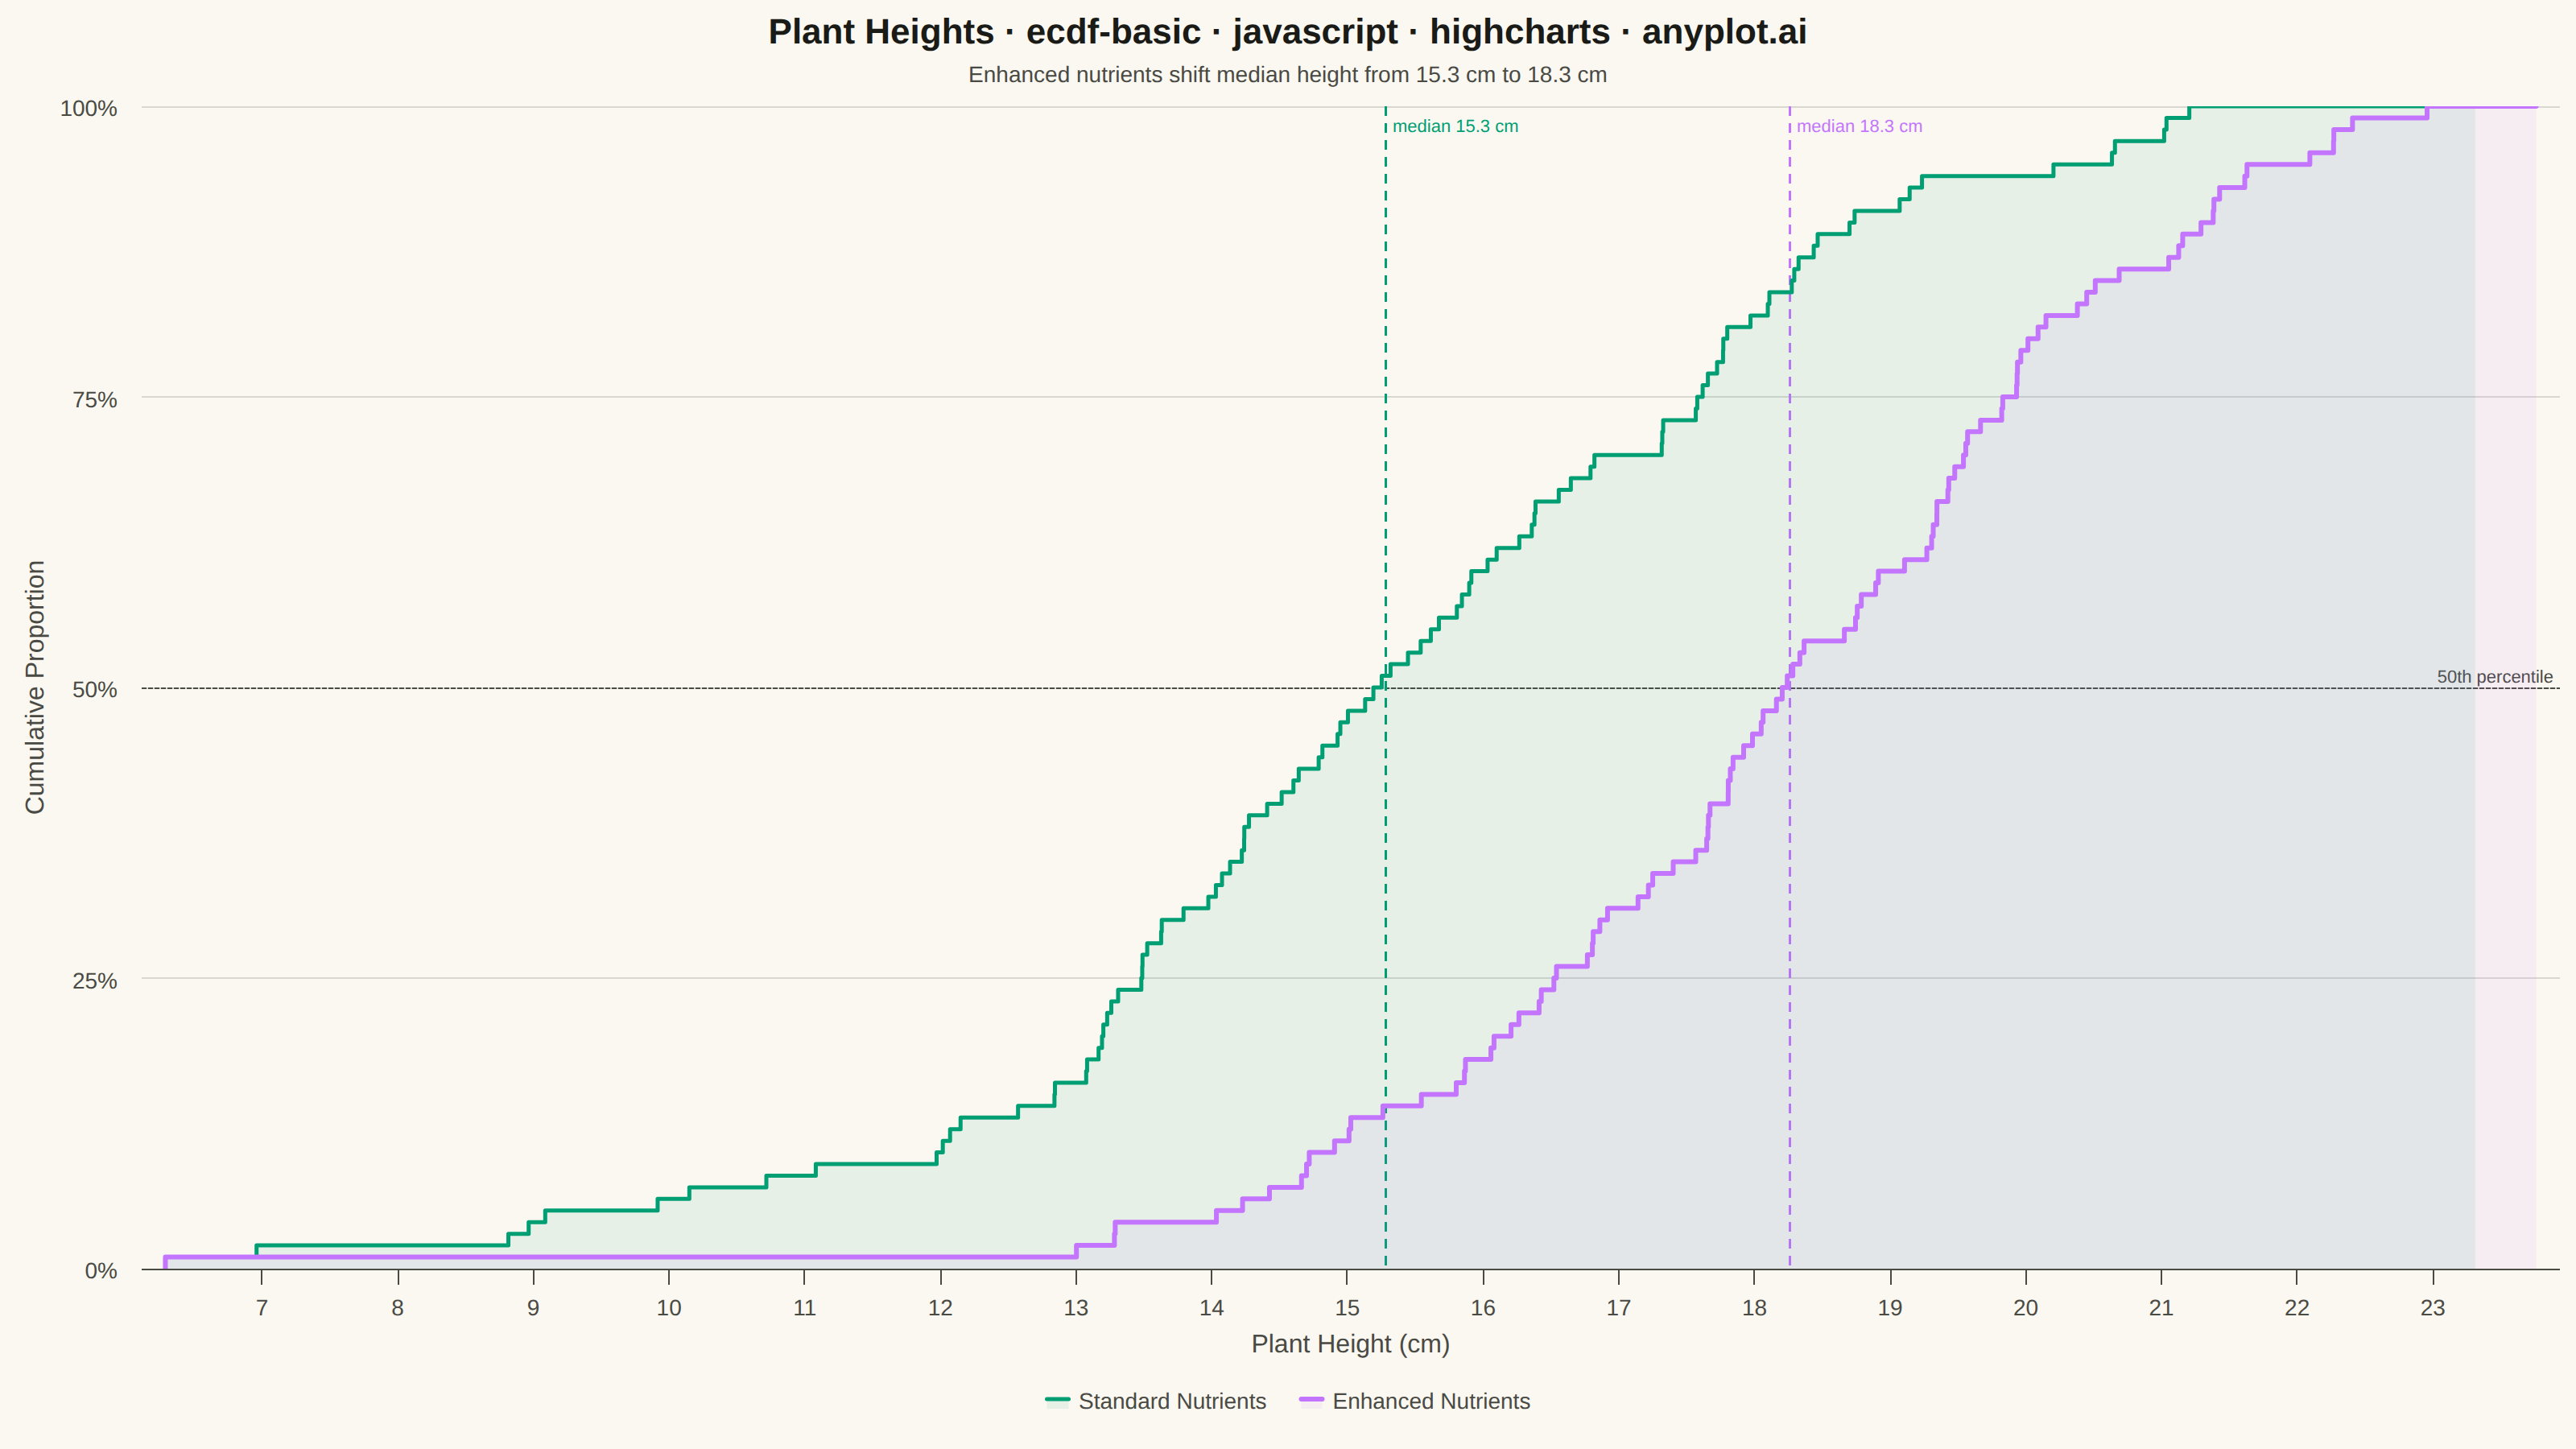
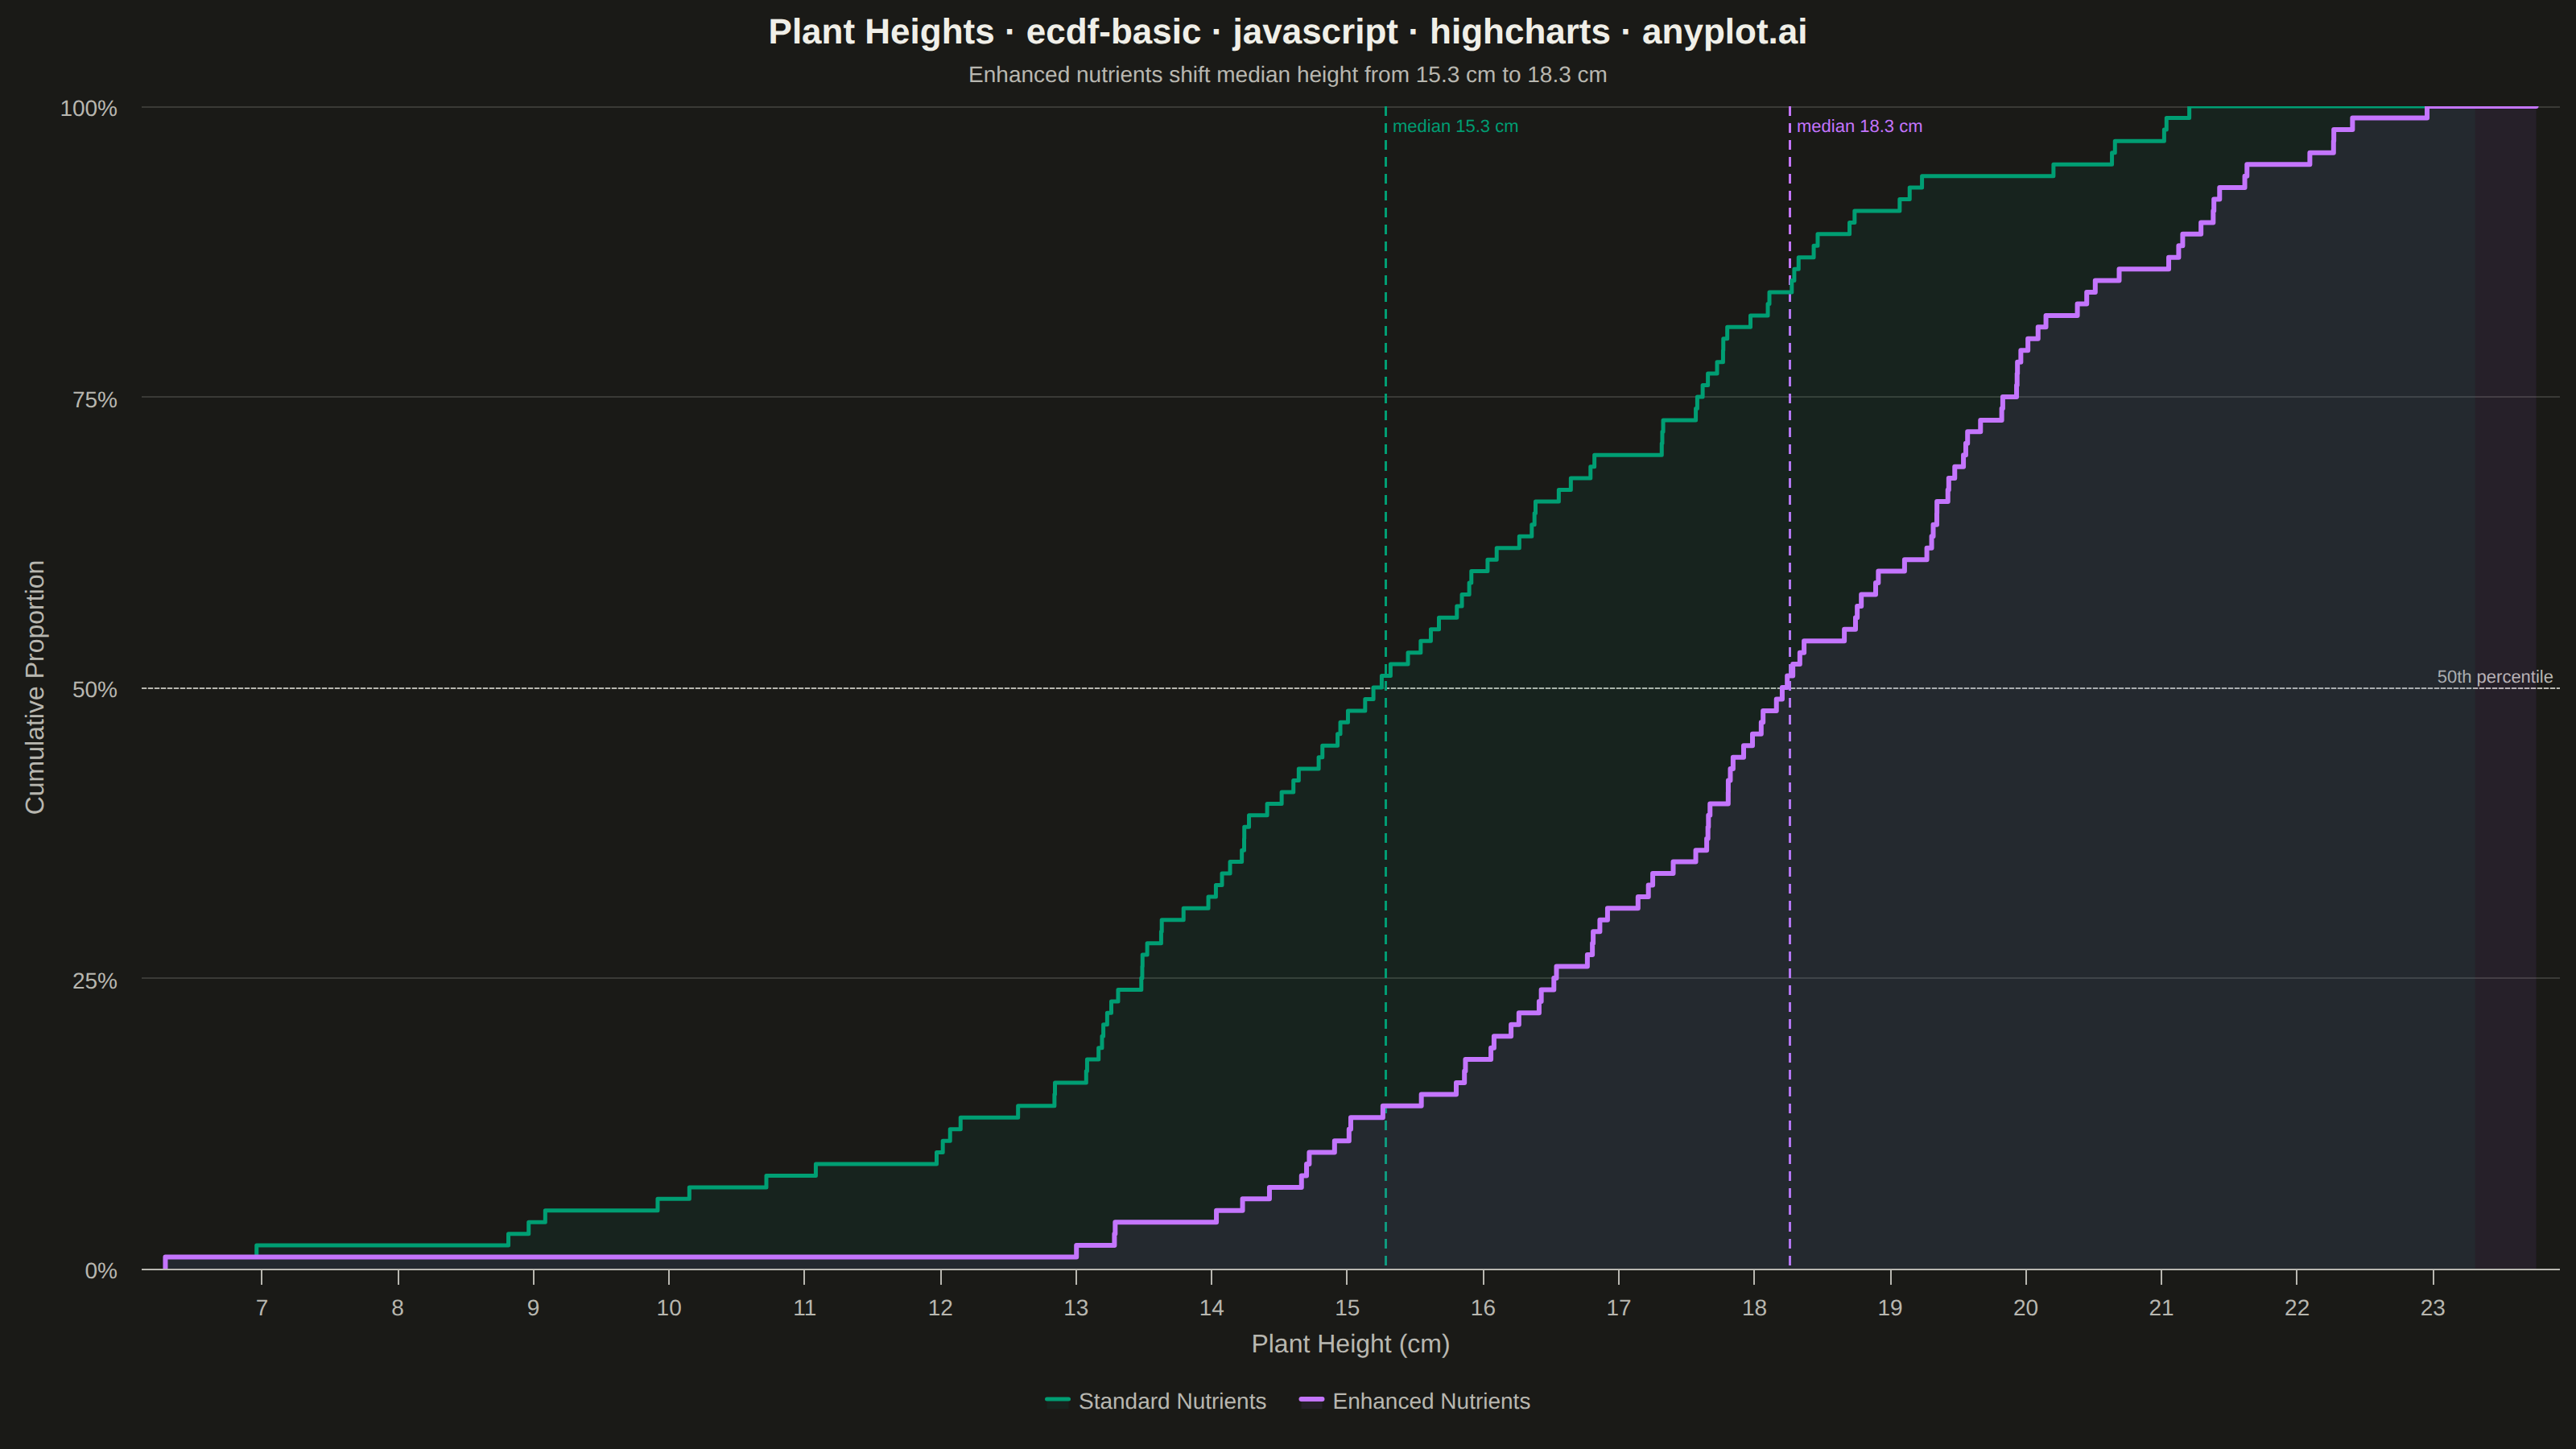
An ECDF (Empirical Cumulative Distribution Function) plot displays a step function that shows the proportion of observations less than or equal to each value. Unlike histograms, ECDF plots require no binning or smoothing, providing a non-parametric estimate of the cumulative distribution. The y-axis ranges from 0 to 1, allowing direct reading of percentiles and quantiles from the visualization.
// anyplot.ai
// ecdf-basic: Basic ECDF Plot
// Library: highcharts 12.6.0 | JavaScript 22.23.0
// Quality: 87/100 | Created: 2026-06-25

//# anyplot-orientation: landscape

const t = window.ANYPLOT_TOKENS;

// Deterministic LCG random number generator
function lcg(seed) {
    let s = seed >>> 0;
    return () => {
        s = (Math.imul(1664525, s) + 1013904223) >>> 0;
        return s / 4294967296;
    };
}

// Box-Muller transform — normally distributed samples
function normalSamples(rng, mu, sigma, n) {
    const out = [];
    while (out.length < n) {
        const u1 = Math.max(rng(), 1e-10);
        const u2 = rng();
        const mag = sigma * Math.sqrt(-2 * Math.log(u1));
        out.push(mu + mag * Math.cos(2 * Math.PI * u2));
        if (out.length < n) out.push(mu + mag * Math.sin(2 * Math.PI * u2));
    }
    return out;
}

// ECDF as [x, proportion] step-function points (right-continuous convention)
// startX is a virtual point at proportion=0 before the first data value
function ecdfSeries(data, startX) {
    const sorted = [...data].sort((a, b) => a - b);
    const n = sorted.length;
    const pts = [[startX, 0]];
    sorted.forEach((x, i) => pts.push([x, (i + 1) / n]));
    return pts;
}

// Plant height (cm) under two growing conditions — 100 plants each
const standard = normalSamples(lcg(42), 15.0, 3.0, 100);
const enhanced = normalSamples(lcg(137), 18.5, 2.5, 100);

const allX = [...standard, ...enhanced];
const xMin = Math.min(...allX);
const xMax = Math.max(...allX);
const startX = xMin - (xMax - xMin) * 0.04;

const seriesStandard = ecdfSeries(standard, startX);
const seriesEnhanced = ecdfSeries(enhanced, startX);

// Actual sample medians for annotation (average of 50th and 51st values in 100-item sorted array)
const sortedStd = [...standard].sort((a, b) => a - b);
const sortedEnh = [...enhanced].sort((a, b) => a - b);
const medStd = (sortedStd[49] + sortedStd[50]) / 2;
const medEnh = (sortedEnh[49] + sortedEnh[50]) / 2;

// Title fits within 67 chars — use default 22px
const titleText = 'Plant Heights · ecdf-basic · javascript · highcharts · anyplot.ai';

Highcharts.chart('container', {
    chart: {
        type: 'area',
        backgroundColor: 'transparent',
        animation: false,
        style: { fontFamily: 'inherit' },
    },
    credits: { enabled: false },
    colors: t.palette,
    title: {
        text: titleText,
        style: { color: t.ink, fontSize: '22px', fontWeight: '600' },
    },
    subtitle: {
        text: `Enhanced nutrients shift median height from ${medStd.toFixed(1)} cm to ${medEnh.toFixed(1)} cm`,
        style: { color: t.inkSoft, fontSize: '14px' },
    },
    xAxis: {
        title: {
            text: 'Plant Height (cm)',
            style: { color: t.inkSoft, fontSize: '16px' },
        },
        lineColor: t.inkSoft,
        tickColor: t.inkSoft,
        gridLineColor: t.grid,
        labels: { style: { color: t.inkSoft, fontSize: '14px' } },
        plotLines: [
            {
                value: medStd,
                color: t.palette[0],
                dashStyle: 'Dash',
                width: 1.5,
                zIndex: 3,
                label: {
                    text: `median ${medStd.toFixed(1)} cm`,
                    style: { color: t.palette[0], fontSize: '11px' },
                    rotation: 0,
                    y: 16,
                    x: 4,
                },
            },
            {
                value: medEnh,
                color: t.palette[1],
                dashStyle: 'Dash',
                width: 1.5,
                zIndex: 3,
                label: {
                    text: `median ${medEnh.toFixed(1)} cm`,
                    style: { color: t.palette[1], fontSize: '11px' },
                    rotation: 0,
                    y: 16,
                    x: 4,
                },
            },
        ],
    },
    yAxis: {
        title: {
            text: 'Cumulative Proportion',
            style: { color: t.inkSoft, fontSize: '16px' },
        },
        min: 0,
        max: 1,
        tickInterval: 0.25,
        gridLineColor: t.grid,
        lineColor: t.inkSoft,
        tickColor: t.inkSoft,
        labels: {
            style: { color: t.inkSoft, fontSize: '14px' },
            formatter() { return `${Math.round(this.value * 100)}%`; },
        },
        plotLines: [
            {
                value: 0.5,
                color: t.inkSoft,
                dashStyle: 'ShortDash',
                width: 1,
                zIndex: 2,
                label: {
                    text: '50th percentile',
                    style: { color: t.inkSoft, fontSize: '11px' },
                    align: 'right',
                    x: -4,
                    y: -4,
                },
            },
        ],
    },
    legend: {
        enabled: true,
        itemStyle: { color: t.inkSoft, fontSize: '14px' },
        itemHoverStyle: { color: t.ink },
    },
    plotOptions: {
        series: {
            animation: false,
            step: 'right',
            marker: { enabled: false },
        },
    },
    series: [
        {
            name: 'Standard Nutrients',
            data: seriesStandard,
            color: t.palette[0],
            lineWidth: 2.5,
            fillOpacity: 0.08,
        },
        {
            name: 'Enhanced Nutrients',
            data: seriesEnhanced,
            color: t.palette[1],
            lineWidth: 3.0,
            fillOpacity: 0.08,
        },
    ],
});
Runnable source as JSON, for any HTTP client: https://api.anyplot.ai/specs/ecdf-basic/highcharts/code. Any spec id and library id listed in llms-full.txt fit the same URL shape; every URL below is complete and callable.
{
  "spec_id": "ecdf-basic",
  "language": "javascript",
  "library": "highcharts",
  "page": "https://anyplot.ai/ecdf-basic/javascript/highcharts",
  "hub": "https://anyplot.ai/ecdf-basic",
  "code_json": "https://api.anyplot.ai/specs/ecdf-basic/highcharts/code",
  "spec_json": "https://api.anyplot.ai/specs/ecdf-basic",
  "render_light_png": "https://storage.googleapis.com/anyplot-images/plots/ecdf-basic/javascript/highcharts/plot-light.png",
  "render_dark_png": "https://storage.googleapis.com/anyplot-images/plots/ecdf-basic/javascript/highcharts/plot-dark.png",
  "interactive_light_html": "https://storage.googleapis.com/anyplot-images/plots/ecdf-basic/javascript/highcharts/plot-light.html",
  "interactive_dark_html": "https://storage.googleapis.com/anyplot-images/plots/ecdf-basic/javascript/highcharts/plot-dark.html",
  "quality_score": 87.0,
  "license": "MIT",
  "guide": "https://anyplot.ai/llms.txt"
}
Part of Basic ECDF Plot on anyplot.ai.