The same plot in 14 other libraries — JavaScript: Chart.js, Apache ECharts, Highcharts, MUI X Charts; Python: Altair, Bokeh, lets-plot, Matplotlib, Plotly, plotnine, Pygal, Seaborn; R: ggplot2; Julia: Makie.jl. Compare all 15 side by side: Model Lift Chart in Python, R, Julia and JavaScript.
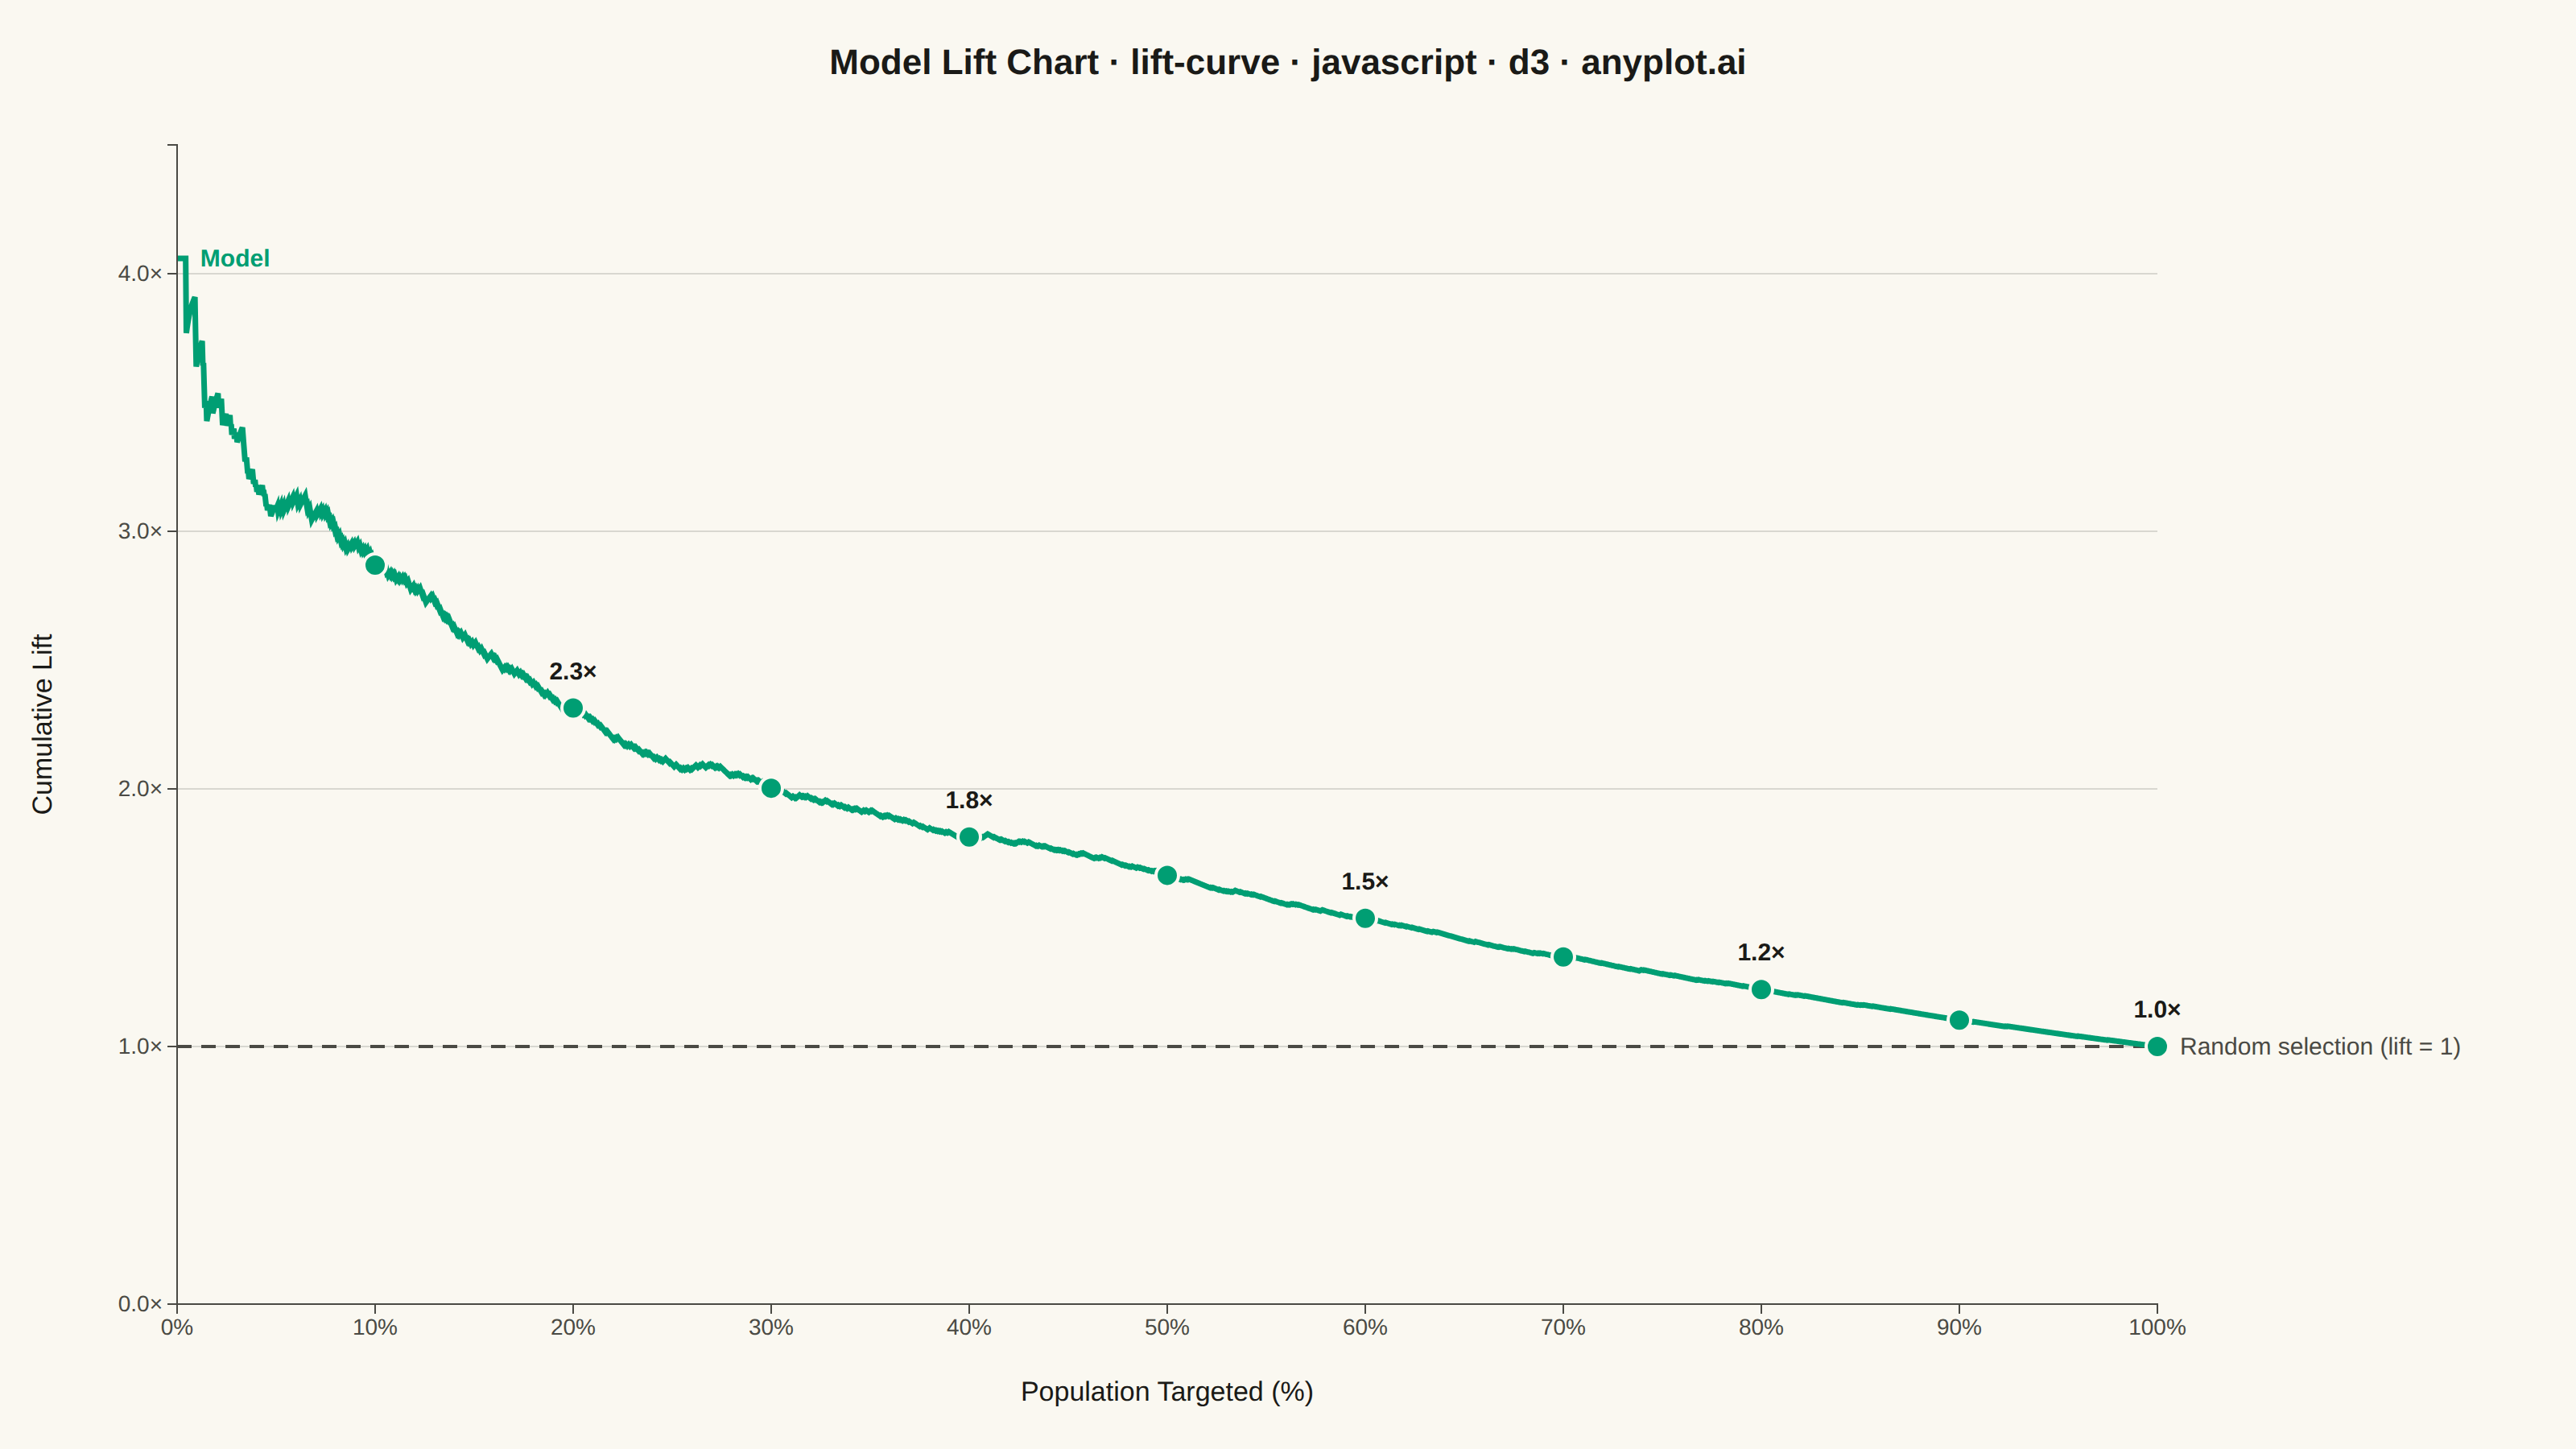
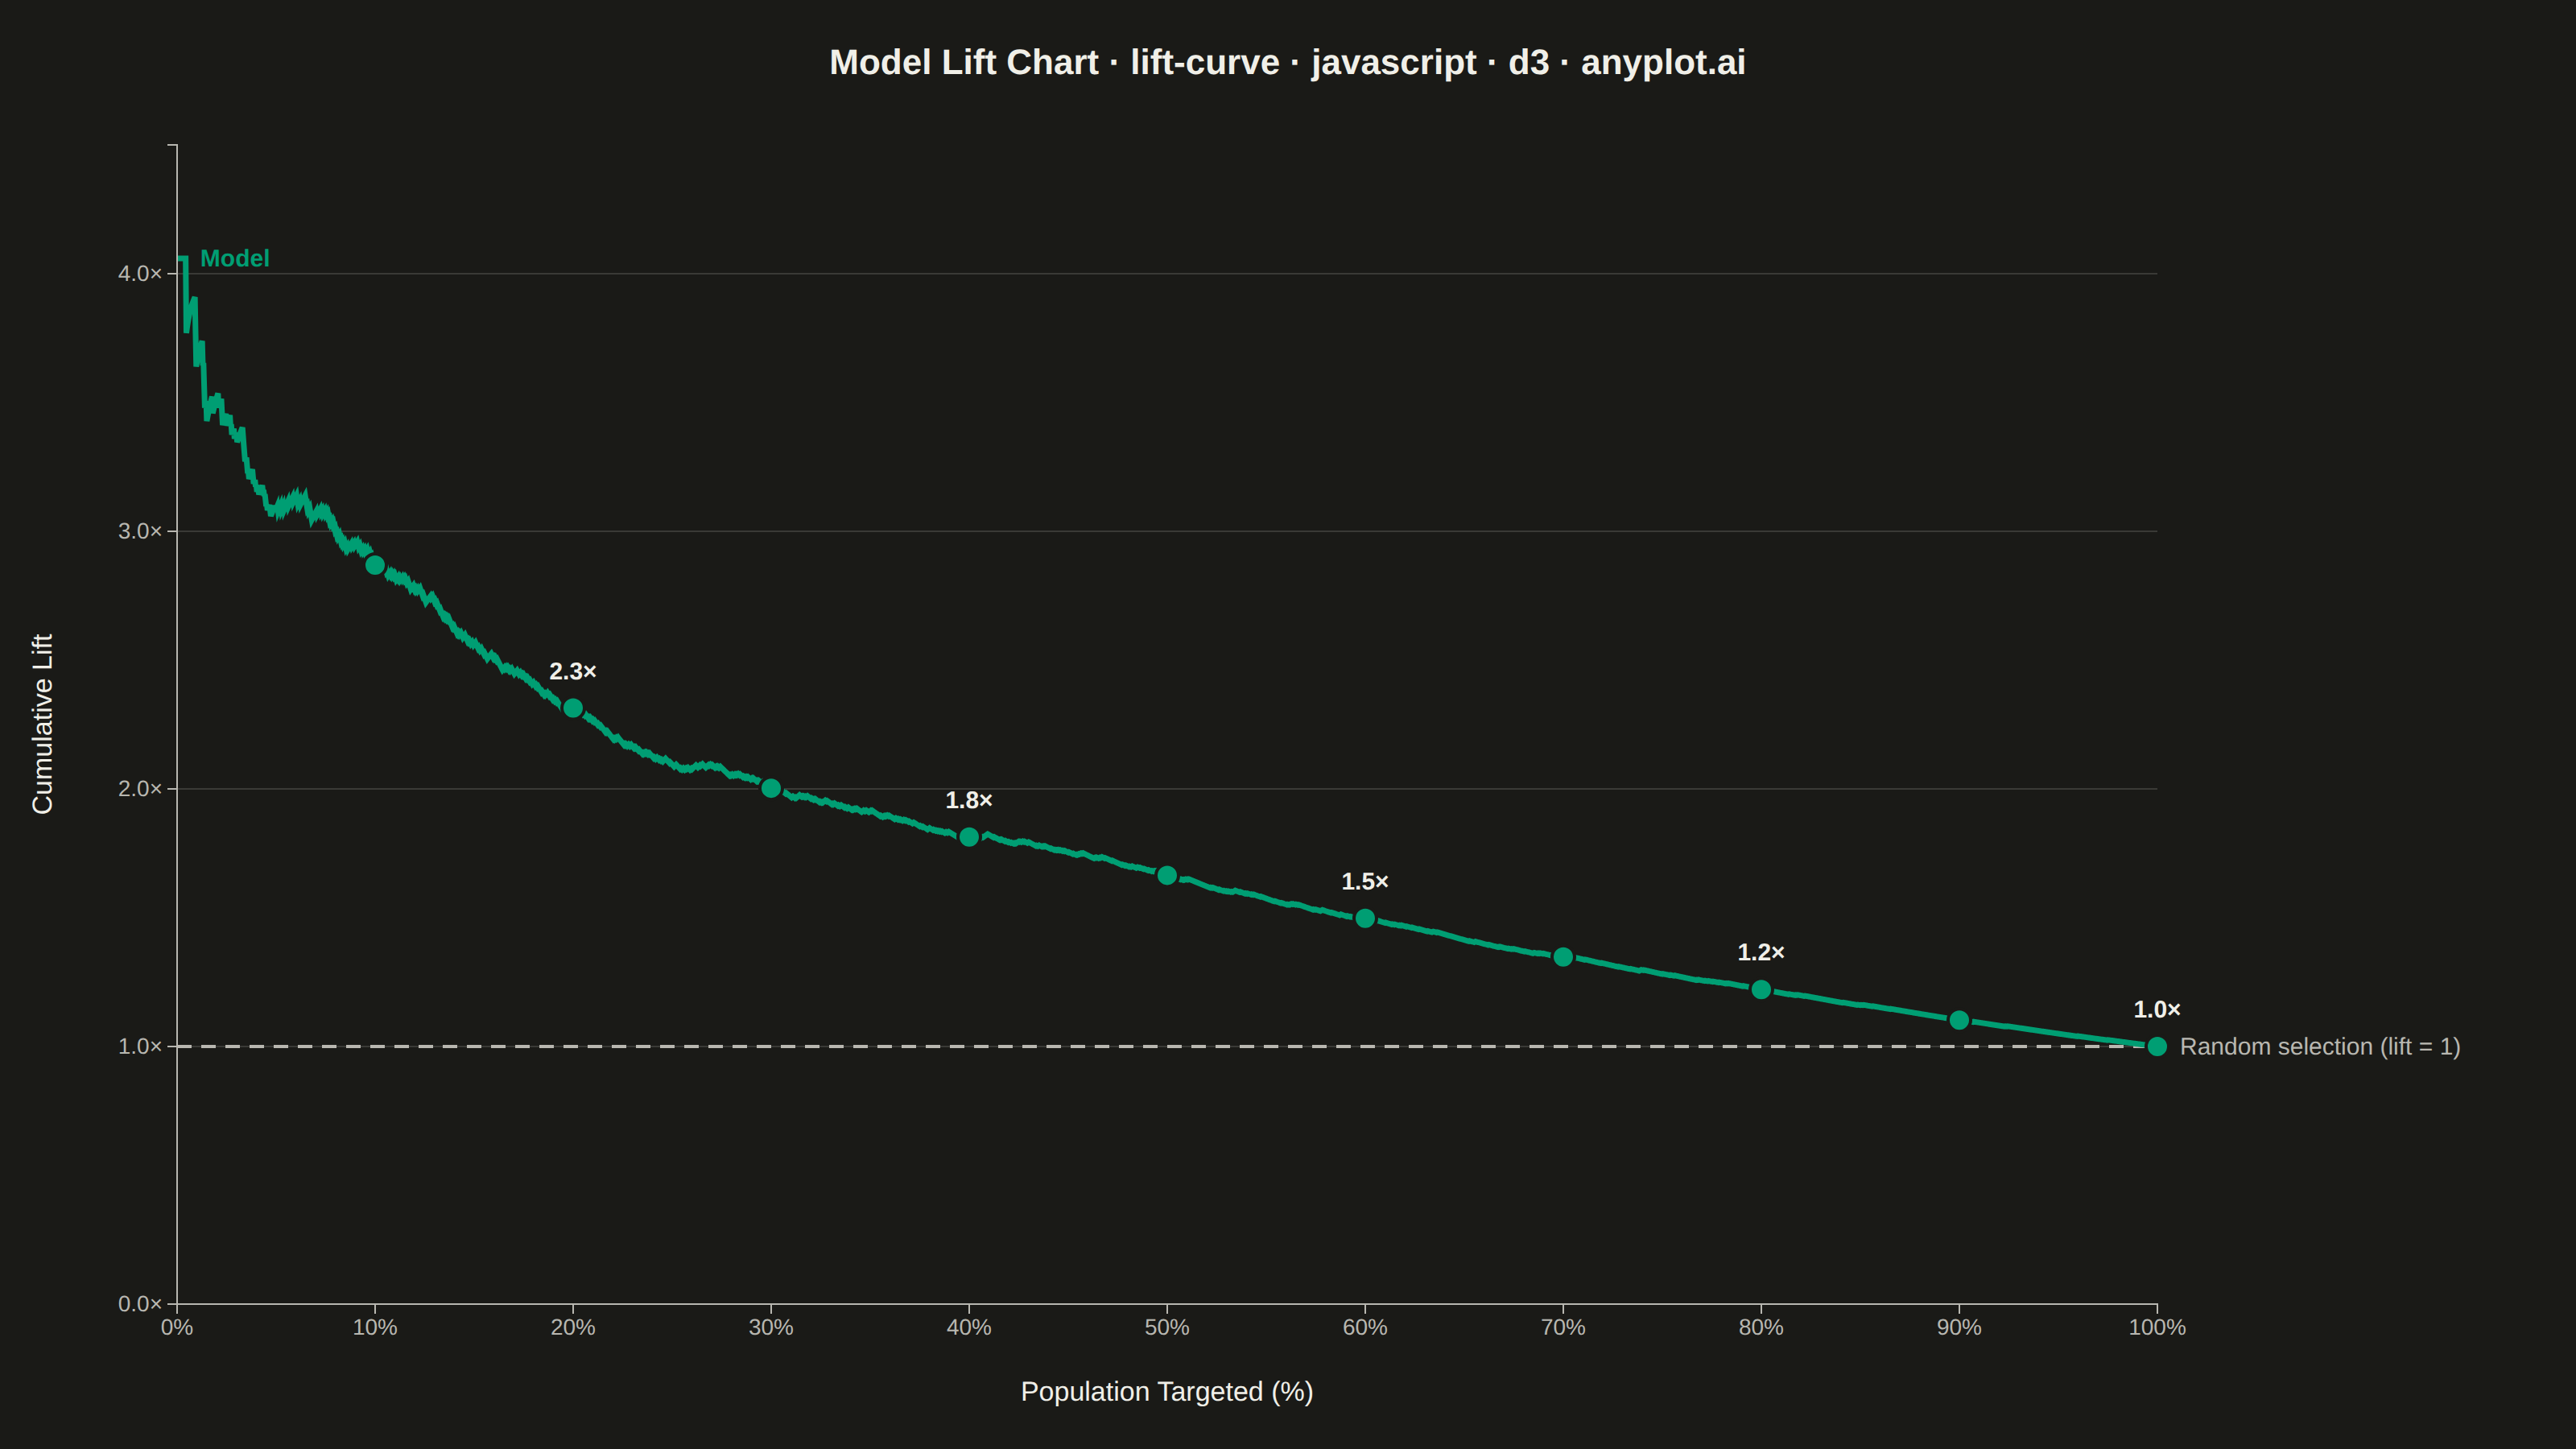
A lift curve visualizes how much better a predictive model performs compared to random selection, showing the cumulative lift ratio as you target increasing percentages of the population. It answers the question: "If I target the top X% of predictions, how many times more responders will I capture than random targeting?" This plot is essential for evaluating and comparing classification models in scenarios where targeting efficiency matters.
// anyplot.ai
// lift-curve: Model Lift Chart
// Library: d3 7.9.0 | JavaScript 22.23.2
// Quality: 91/100 | Created: 2026-09-05

const t = window.ANYPLOT_TOKENS;
const { width, height } = window.ANYPLOT_SIZE;
const margin = { top: 90, right: 260, bottom: 90, left: 110 };
const iw = width - margin.left - margin.right;
const ih = height - margin.top - margin.bottom;

// --- Data (in-memory, deterministic) ----------------------------------------
// Simulates a churn-prediction model: each customer has a latent quality score
// `q` driving the true churn probability, and the model's predicted score is a
// noisy observation of `q` — an imperfect but informative ranking signal.
function lcg(seed) {
  let s = seed >>> 0;
  return () => {
    s = (Math.imul(s, 1664525) + 1013904223) >>> 0;
    return s / 4294967296;
  };
}
const rand = lcg(42);
function randNormal() {
  const u1 = Math.max(rand(), 1e-9);
  const u2 = rand();
  return Math.sqrt(-2 * Math.log(u1)) * Math.cos(2 * Math.PI * u2);
}

const n = 3000;
const customers = [];
for (let i = 0; i < n; i++) {
  const q = randNormal();
  const churnProb = 1 / (1 + Math.exp(-(1.8 * q - 1.75)));
  const churned = rand() < churnProb ? 1 : 0;
  const score = q + 0.65 * randNormal();
  customers.push({ churned, score });
}
customers.sort((a, b) => b.score - a.score);

const overallRate = customers.reduce((s, c) => s + c.churned, 0) / n;
let cumChurned = 0;
const curve = customers.map((c, i) => {
  cumChurned += c.churned;
  return { pct: ((i + 1) / n) * 100, lift: cumChurned / (i + 1) / overallRate };
});

const bisectPct = d3.bisector((d) => d.pct).left;
const deciles = d3.range(1, 11).map((k) => {
  const idx = Math.min(bisectPct(curve, k * 10), n - 1);
  return { pct: curve[idx].pct, lift: curve[idx].lift, decile: k * 10 };
});
const labeledDeciles = new Set([20, 40, 60, 80, 100]);

// --- SVG mount ---------------------------------------------------------------
const svg = d3
  .select("#container")
  .append("svg")
  .attr("width", width)
  .attr("height", height);
const g = svg
  .append("g")
  .attr("transform", `translate(${margin.left},${margin.top})`);

// --- Scales -------------------------------------------------------------------
const x = d3.scaleLinear().domain([0, 100]).range([0, iw]);
const y = d3
  .scaleLinear()
  .domain([0, d3.max(curve, (d) => d.lift) * 1.08])
  .nice()
  .range([ih, 0]);

// --- Gridlines (y-axis only) --------------------------------------------------
g.append("g")
  .selectAll("line")
  .data(y.ticks(6))
  .join("line")
  .attr("x1", 0)
  .attr("x2", iw)
  .attr("y1", (d) => y(d))
  .attr("y2", (d) => y(d))
  .attr("stroke", t.grid);

// --- Reference line: y = 1 (random selection, no lift) -----------------------
g.append("line")
  .attr("x1", 0)
  .attr("x2", iw)
  .attr("y1", y(1))
  .attr("y2", y(1))
  .attr("stroke", t.inkSoft)
  .attr("stroke-width", 2)
  .attr("stroke-dasharray", "9,6");

g.append("text")
  .attr("x", iw + 14)
  .attr("y", y(1))
  .attr("dy", "0.32em")
  .attr("fill", t.inkSoft)
  .style("font-size", "15px")
  .text("Random selection (lift = 1)");

// --- Lift curve ---------------------------------------------------------------
const line = d3
  .line()
  .x((d) => x(d.pct))
  .y((d) => y(d.lift));

g.append("path")
  .datum(curve)
  .attr("fill", "none")
  .attr("stroke", t.palette[0])
  .attr("stroke-width", 3.5)
  .attr("d", line);

// --- Decile markers ------------------------------------------------------------
g.selectAll("circle.decile")
  .data(deciles)
  .join("circle")
  .attr("class", "decile")
  .attr("cx", (d) => x(d.pct))
  .attr("cy", (d) => y(d.lift))
  .attr("r", 7)
  .attr("fill", t.palette[0])
  .attr("stroke", t.pageBg)
  .attr("stroke-width", 2);

g.selectAll("text.decile-label")
  .data(deciles.filter((d) => labeledDeciles.has(d.decile)))
  .join("text")
  .attr("class", "decile-label")
  .attr("x", (d) => x(d.pct))
  .attr("y", (d) => y(d.lift) - 18)
  .attr("text-anchor", "middle")
  .attr("fill", t.ink)
  .style("font-size", "15px")
  .style("font-weight", "600")
  .text((d) => `${d.lift.toFixed(1)}×`);

// --- Model curve label ---------------------------------------------------------
g.append("text")
  .attr("x", x(curve[0].pct) + 14)
  .attr("y", y(curve[0].lift))
  .attr("dy", "0.32em")
  .attr("fill", t.palette[0])
  .style("font-size", "15px")
  .style("font-weight", "600")
  .text("Model");

// --- Axes -----------------------------------------------------------------------
const xAxis = g
  .append("g")
  .attr("transform", `translate(0,${ih})`)
  .call(
    d3
      .axisBottom(x)
      .ticks(10)
      .tickFormat((d) => `${d}%`),
  );
const yAxis = g.append("g").call(
  d3
    .axisLeft(y)
    .ticks(6)
    .tickFormat((d) => `${d.toFixed(1)}×`),
);
for (const ax of [xAxis, yAxis]) {
  ax.selectAll("text").attr("fill", t.inkSoft).style("font-size", "14px");
  ax.selectAll("line").attr("stroke", t.inkSoft);
  ax.select(".domain").attr("stroke", t.inkSoft);
}

// --- Axis labels ------------------------------------------------------------
g.append("text")
  .attr("x", iw / 2)
  .attr("y", ih + 60)
  .attr("text-anchor", "middle")
  .attr("fill", t.ink)
  .style("font-size", "17px")
  .text("Population Targeted (%)");

g.append("text")
  .attr("transform", "rotate(-90)")
  .attr("x", -ih / 2)
  .attr("y", -78)
  .attr("text-anchor", "middle")
  .attr("fill", t.ink)
  .style("font-size", "17px")
  .text("Cumulative Lift");

// --- Title --------------------------------------------------------------------
svg
  .append("text")
  .attr("x", width / 2)
  .attr("y", 46)
  .attr("text-anchor", "middle")
  .attr("fill", t.ink)
  .style("font-size", "22px")
  .style("font-weight", "600")
  .text("Model Lift Chart · lift-curve · javascript · d3 · anyplot.ai");
Runnable source as JSON, for any HTTP client: https://api.anyplot.ai/specs/lift-curve/d3/code. Any spec id and library id listed in llms-full.txt fit the same URL shape; every URL below is complete and callable.
{
  "spec_id": "lift-curve",
  "language": "javascript",
  "library": "d3",
  "page": "https://anyplot.ai/lift-curve/javascript/d3",
  "hub": "https://anyplot.ai/lift-curve",
  "code_json": "https://api.anyplot.ai/specs/lift-curve/d3/code",
  "spec_json": "https://api.anyplot.ai/specs/lift-curve",
  "render_light_png": "https://storage.googleapis.com/anyplot-images/plots/lift-curve/javascript/d3/plot-light.png",
  "render_dark_png": "https://storage.googleapis.com/anyplot-images/plots/lift-curve/javascript/d3/plot-dark.png",
  "interactive_light_html": "https://storage.googleapis.com/anyplot-images/plots/lift-curve/javascript/d3/plot-light.html",
  "interactive_dark_html": "https://storage.googleapis.com/anyplot-images/plots/lift-curve/javascript/d3/plot-dark.html",
  "quality_score": 91.0,
  "license": "MIT",
  "guide": "https://anyplot.ai/llms.txt"
}
Part of Model Lift Chart on anyplot.ai.