The same plot in 14 other libraries — JavaScript: Chart.js, D3.js, Apache ECharts, Highcharts; Python: Altair, Bokeh, lets-plot, Matplotlib, Plotly, plotnine, Pygal, Seaborn; R: ggplot2; Julia: Makie.jl. Compare all 15 side by side: Model Lift Chart in Python, R, Julia and JavaScript.
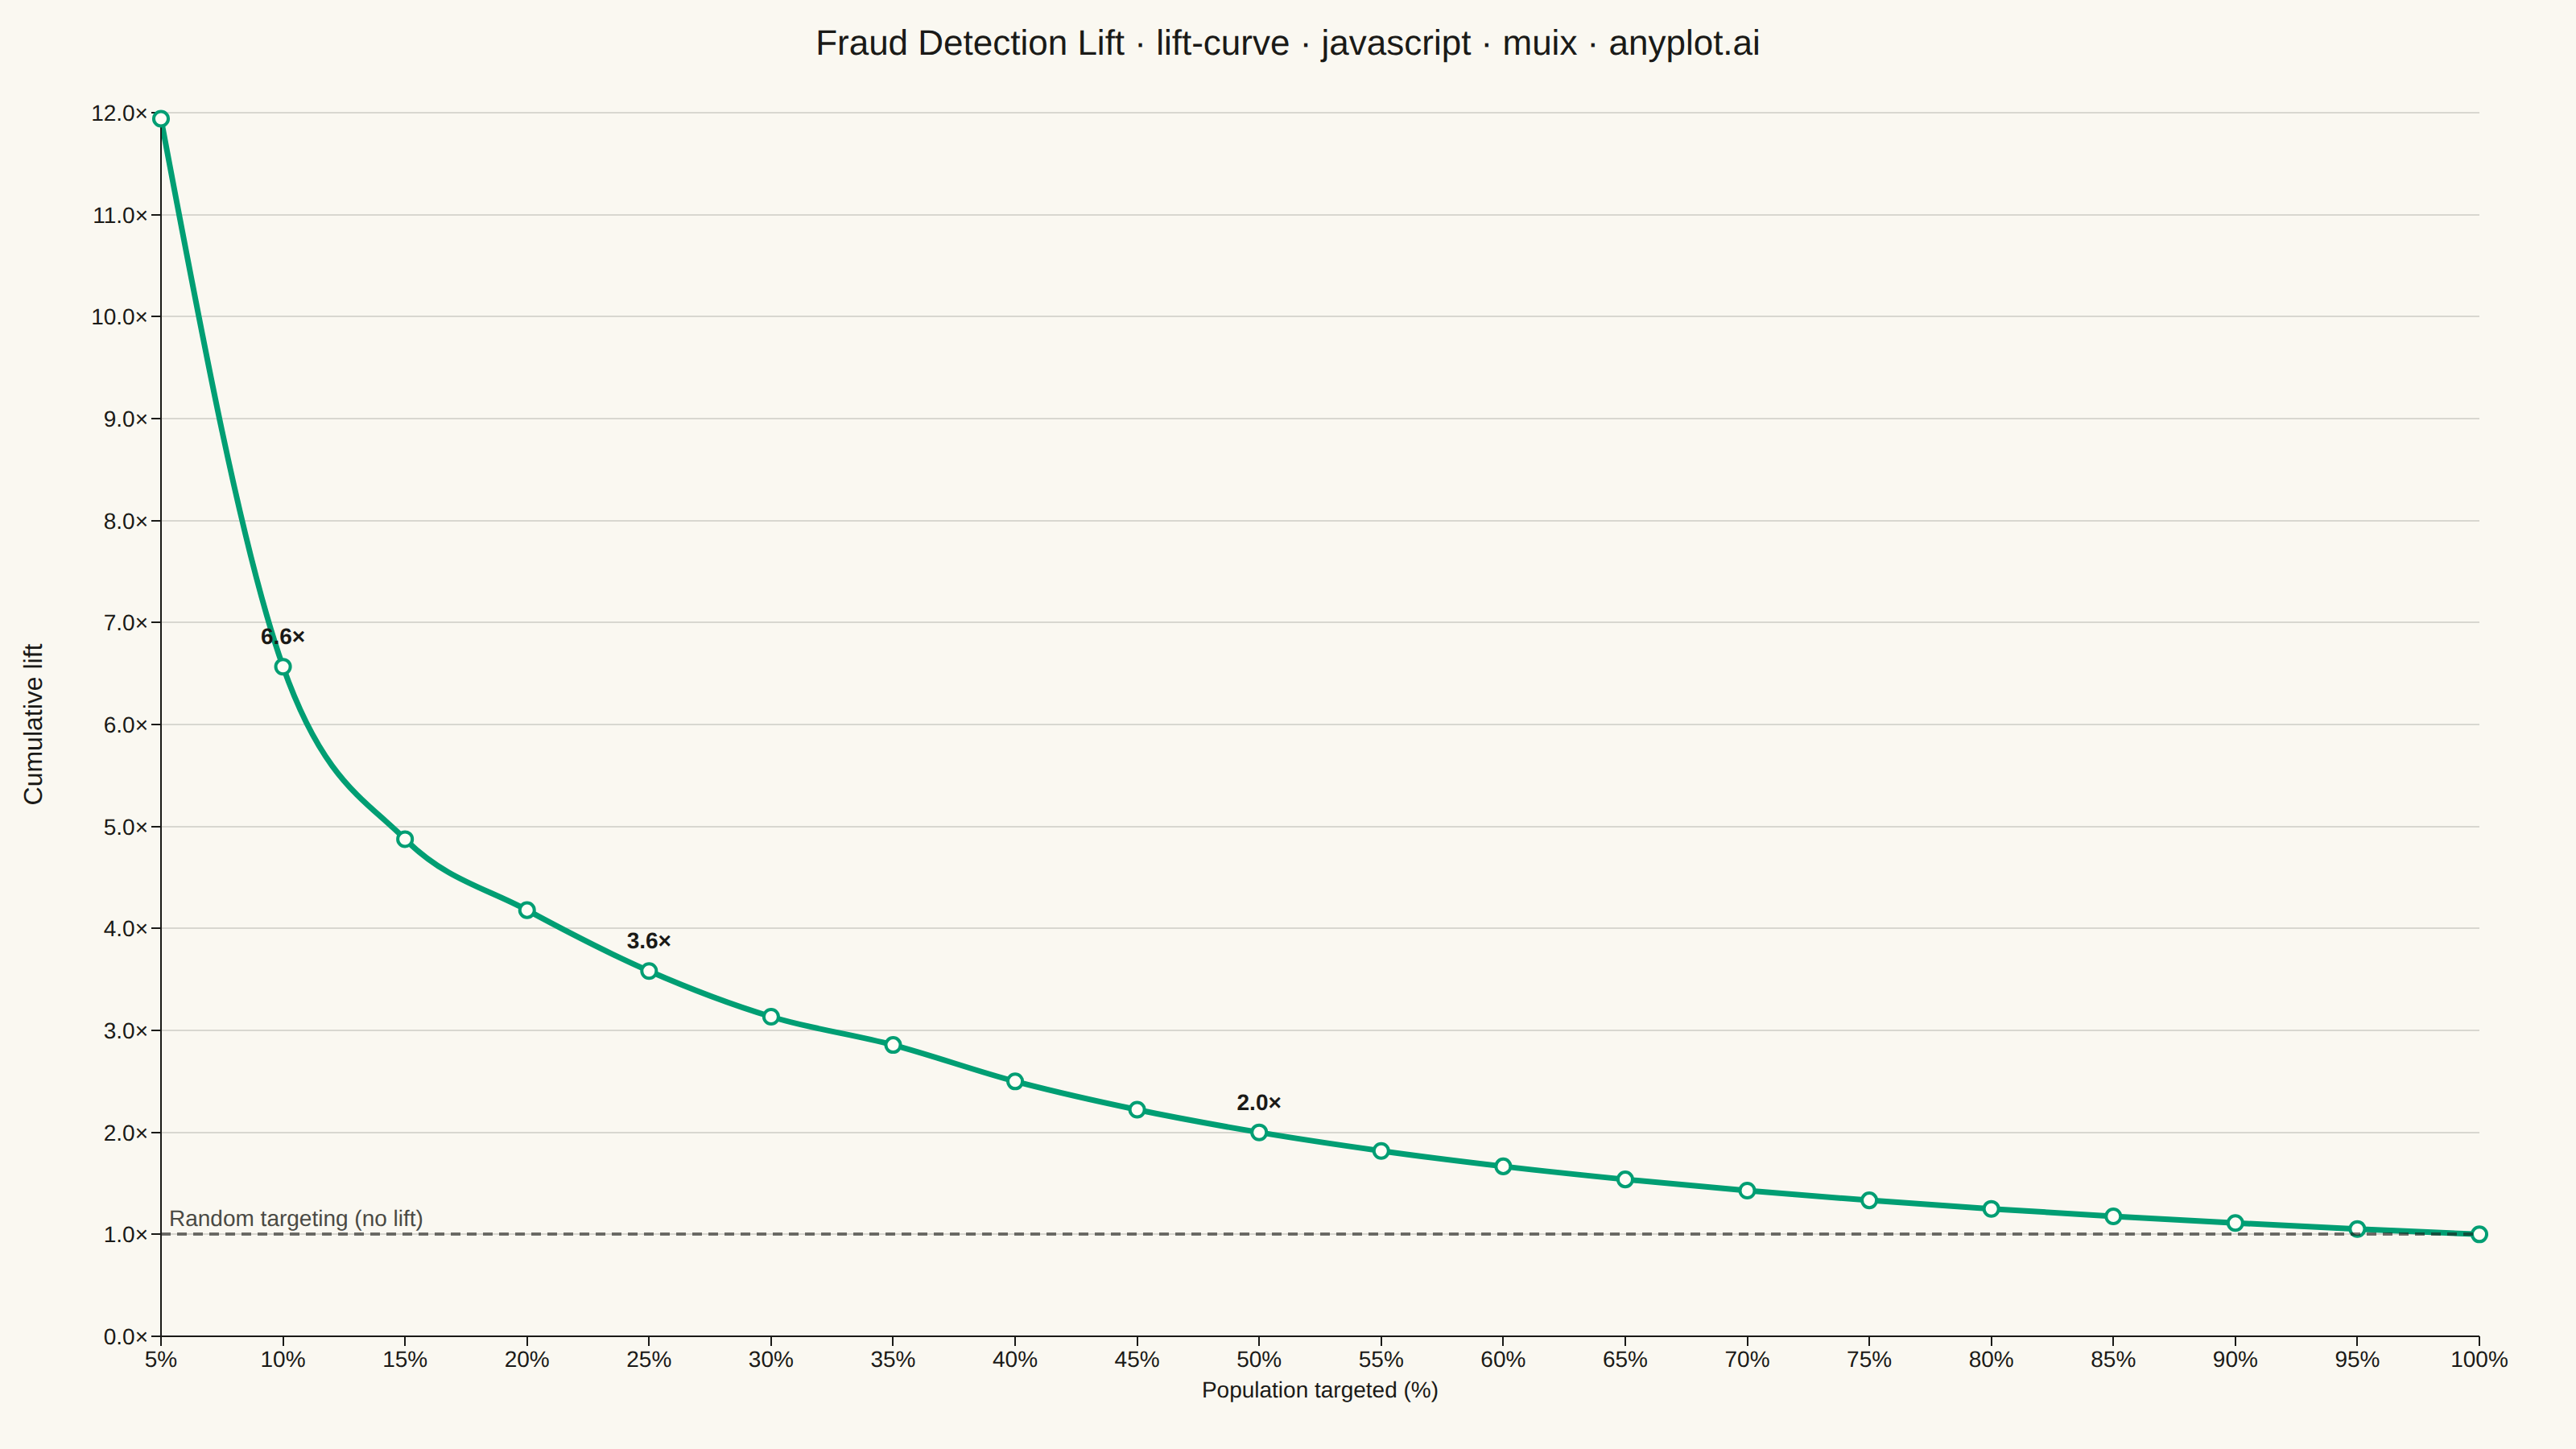
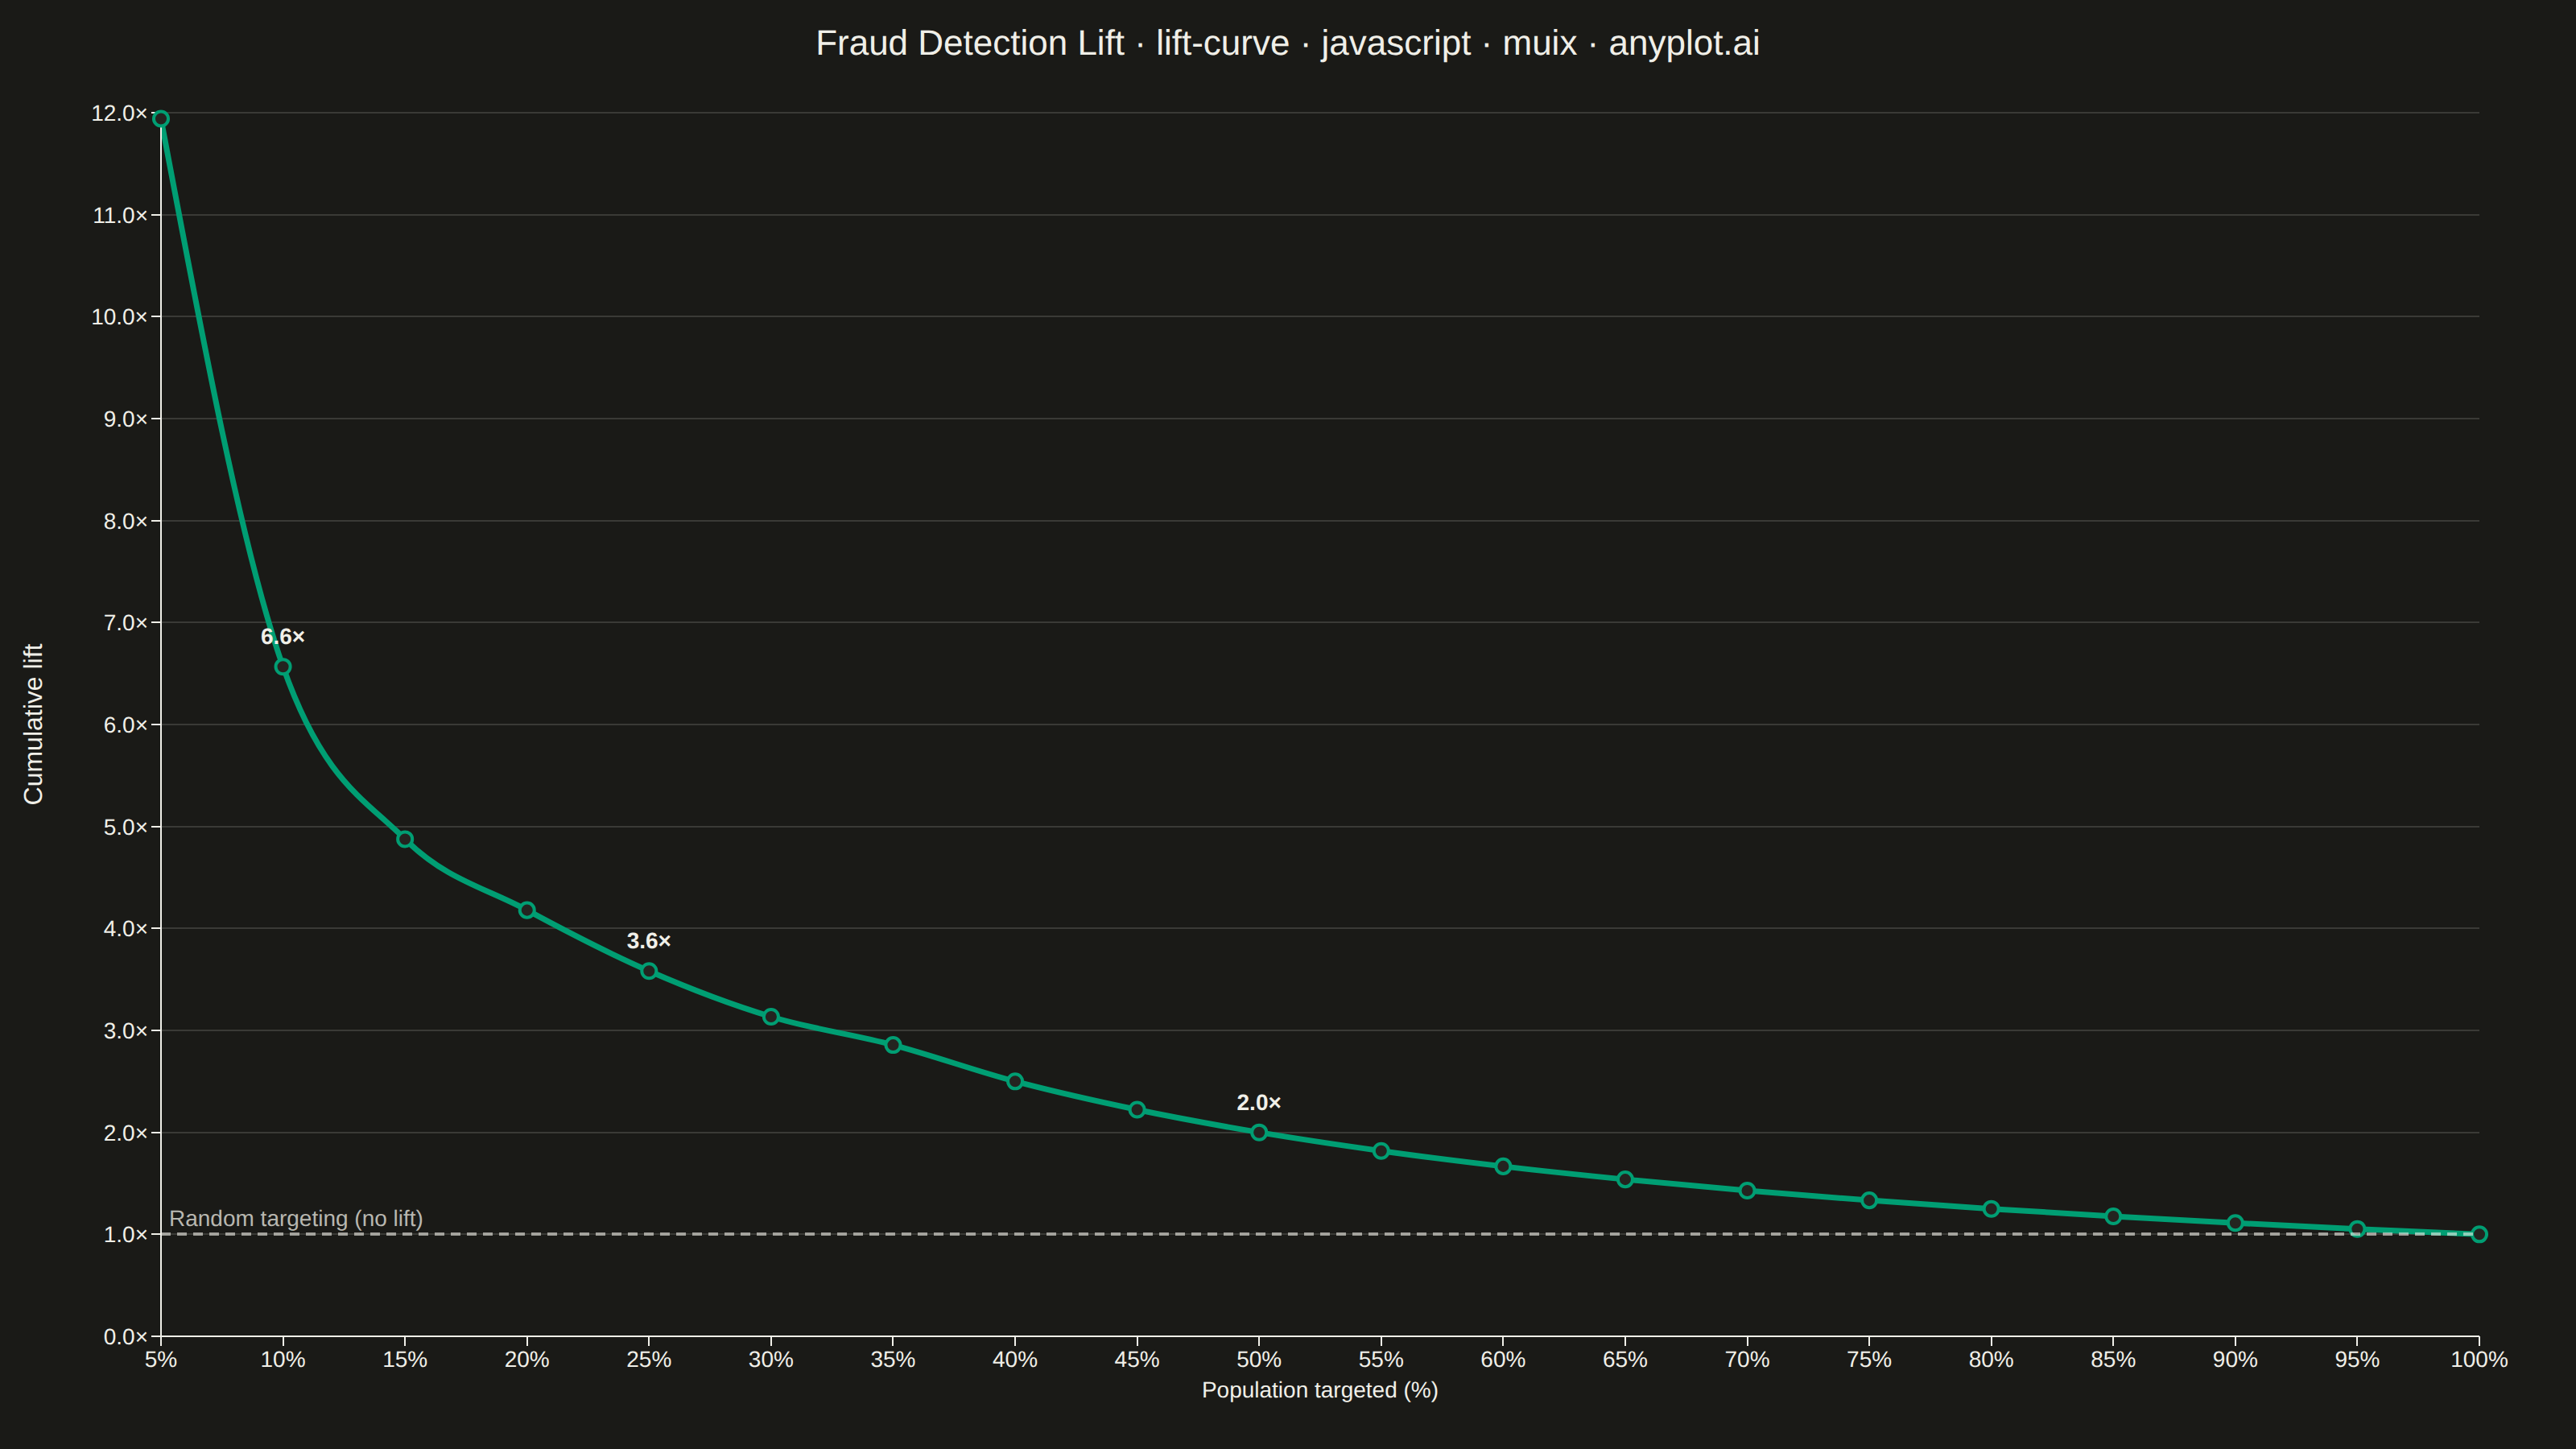
A lift curve visualizes how much better a predictive model performs compared to random selection, showing the cumulative lift ratio as you target increasing percentages of the population. It answers the question: "If I target the top X% of predictions, how many times more responders will I capture than random targeting?" This plot is essential for evaluating and comparing classification models in scenarios where targeting efficiency matters.
// anyplot.ai
// lift-curve: Model Lift Chart
// Library: muix 7.29.1 | JavaScript 22.23.2
// Quality: 87/100 | Created: 2026-09-05
//# anyplot-orientation: landscape
// anyplot.ai
// lift-curve: Model Lift Chart
// Library: MUI X Charts | React | Node 22
// License: @mui/x-charts — MIT (community). Pro/Premium are out of scope.
// Quality: pending | Created: 2026-09-05

import { LineChart } from "@mui/x-charts/LineChart";
import { ChartsReferenceLine } from "@mui/x-charts/ChartsReferenceLine";
import { useXScale, useYScale, useDrawingArea } from "@mui/x-charts/hooks";

const t = window.ANYPLOT_TOKENS;

// --- Data (in-memory, deterministic) ----------------------------------------
// Deterministic LCG — the browser has no seeded RNG, and Math.random() isn't reproducible.
let seed = 42;
function nextRandom() {
  seed = (seed * 1103515245 + 12345) & 0x7fffffff;
  return seed / 0x7fffffff;
}

// Simulated transaction population: fraud flag + model's predicted fraud score.
// Fraudulent cases skew toward higher scores, but with enough noise that the
// model isn't perfect — a realistic imperfect classifier. 3% base rate is in
// line with real-world card-fraud incidence (well under the 8% used earlier).
const populationSize = 2000;
const fraudRate = 0.03;
const trueLabels = [];
const modelScores = [];
for (let i = 0; i < populationSize; i += 1) {
  const isFraud = nextRandom() < fraudRate ? 1 : 0;
  const signal = isFraud ? 0.75 : 0.3;
  const noise = (nextRandom() - 0.5) * 0.7;
  modelScores.push(Math.min(1, Math.max(0, signal + noise)));
  trueLabels.push(isFraud);
}

// Rank transactions by predicted score, descending — the order the model would target.
const ranked = trueLabels
  .map((label, i) => ({ label, score: modelScores[i] }))
  .sort((a, b) => b.score - a.score);

let running = 0;
const cumulativeFraud = ranked.map((r) => {
  running += r.label;
  return running;
});
const baselineRate = running / populationSize;

// Cumulative lift ratio at each 5% slice of the targeted population.
const percentages = Array.from({ length: 20 }, (_, i) => (i + 1) * 5);
const liftByPct = percentages.map((pct) => {
  const cutoff = Math.round((pct / 100) * populationSize);
  const targetedRate = cumulativeFraud[cutoff - 1] / cutoff;
  return targetedRate / baselineRate;
});

// Key deciles called out with their exact lift value, per the spec's
// suggestion to surface actual values at a few percentiles.
const keyPercentiles = [10, 25, 50];
const maxLift = liftByPct[0];

// Labels the curve's own points at a few key deciles (must be a LineChart
// child so useXScale/useYScale resolve against the chart's own axes).
function KeyPercentileLabels() {
  const xScale = useXScale();
  const yScale = useYScale();
  if (!xScale || !yScale) return null;

  return (
    <g>
      {keyPercentiles.map((pct) => {
        const idx = percentages.indexOf(pct);
        const value = liftByPct[idx];
        const x = xScale(pct);
        const y = yScale(value);
        // Points near the curve's peak sit close to the top margin — flip
        // the label below the point there so it never runs off-canvas.
        const below = value > maxLift * 0.85;
        return (
          <text
            key={pct}
            x={x}
            y={below ? y + 22 : y - 14}
            textAnchor="middle"
            fontSize={14}
            fontWeight={600}
            fill={t.ink}
          >
            {value.toFixed(1)}×
          </text>
        );
      })}
    </g>
  );
}

// A rotated y-axis title, positioned explicitly to clear the "×"-suffixed
// tick labels — drawn by hand instead of leaning on the built-in `yAxis.label`,
// whose only offset lever (the deprecated `tickFontSize`) also resizes the
// tick text itself, forcing a fight between the two concerns.
function YAxisTitle() {
  const { left, top, height } = useDrawingArea();
  const x = left - 78;
  const y = top + height / 2;
  return (
    <text
      x={x}
      y={y}
      textAnchor="middle"
      dominantBaseline="middle"
      fontSize={16}
      fill={t.ink}
      transform={`rotate(-90 ${x} ${y})`}
    >
      Cumulative lift
    </text>
  );
}

// --- Chart (default-exported component — the harness mounts it) ------------
export default function Chart() {
  return (
    <div style={{ width: "100%", height: "100%", position: "relative" }}>
      {/* Title rendered in the chart's top margin space */}
      <div
        style={{
          position: "absolute",
          top: 14,
          left: 0,
          right: 0,
          textAlign: "center",
          zIndex: 1,
          fontSize: 22,
          fontWeight: 500,
          color: t.ink,
          pointerEvents: "none",
          fontFamily: "'Roboto', 'Helvetica', 'Arial', sans-serif",
        }}
      >
        Fraud Detection Lift · lift-curve · javascript · muix · anyplot.ai
      </div>

      <LineChart
        width={window.ANYPLOT_SIZE.width}
        height={window.ANYPLOT_SIZE.height}
        skipAnimation
        series={[
          {
            data: liftByPct,
            color: t.palette[0],
            curve: "monotoneX",
            showMark: true,
          },
        ]}
        xAxis={[
          {
            data: percentages,
            scaleType: "point",
            label: "Population targeted (%)",
            valueFormatter: (v) => `${v}%`,
          },
        ]}
        yAxis={[
          {
            min: 0,
            valueFormatter: (v) => `${v.toFixed(1)}×`,
          },
        ]}
        grid={{ horizontal: true }}
        sx={{
          "& .MuiChartsAxis-label": {
            fontSize: "16px !important",
          },
          "& .MuiChartsAxis-tickLabel": {
            fontSize: "14px !important",
          },
          "& .MuiLineElement-root": {
            strokeWidth: "3.5px",
          },
          "& .MuiMarkElement-root": {
            strokeWidth: "2px",
          },
        }}
        slotProps={{
          legend: { hidden: true },
        }}
        margin={{ top: 70, right: 60, bottom: 70, left: 100 }}
      >
        <ChartsReferenceLine
          y={1}
          label="Random targeting (no lift)"
          labelAlign="start"
          lineStyle={{
            stroke: t.ink,
            strokeDasharray: "6 4",
            strokeWidth: 2,
            strokeOpacity: 0.6,
          }}
          labelStyle={{
            fill: t.inkSoft,
            fontSize: 14,
          }}
        />
        <KeyPercentileLabels />
        <YAxisTitle />
      </LineChart>
    </div>
  );
}
Runnable source as JSON, for any HTTP client: https://api.anyplot.ai/specs/lift-curve/muix/code. Any spec id and library id listed in llms-full.txt fit the same URL shape; every URL below is complete and callable.
{
  "spec_id": "lift-curve",
  "language": "javascript",
  "library": "muix",
  "page": "https://anyplot.ai/lift-curve/javascript/muix",
  "hub": "https://anyplot.ai/lift-curve",
  "code_json": "https://api.anyplot.ai/specs/lift-curve/muix/code",
  "spec_json": "https://api.anyplot.ai/specs/lift-curve",
  "render_light_png": "https://storage.googleapis.com/anyplot-images/plots/lift-curve/javascript/muix/plot-light.png",
  "render_dark_png": "https://storage.googleapis.com/anyplot-images/plots/lift-curve/javascript/muix/plot-dark.png",
  "interactive_light_html": "https://storage.googleapis.com/anyplot-images/plots/lift-curve/javascript/muix/plot-light.html",
  "interactive_dark_html": "https://storage.googleapis.com/anyplot-images/plots/lift-curve/javascript/muix/plot-dark.html",
  "quality_score": 87.0,
  "license": "MIT",
  "guide": "https://anyplot.ai/llms.txt"
}
Part of Model Lift Chart on anyplot.ai.