The same plot in 14 other libraries — JavaScript: Chart.js, D3.js, Apache ECharts, MUI X Charts; Python: Altair, Bokeh, lets-plot, Matplotlib, Plotly, plotnine, Pygal, Seaborn; R: ggplot2; Julia: Makie.jl. Compare all 15 side by side: Model Lift Chart in Python, R, Julia and JavaScript.
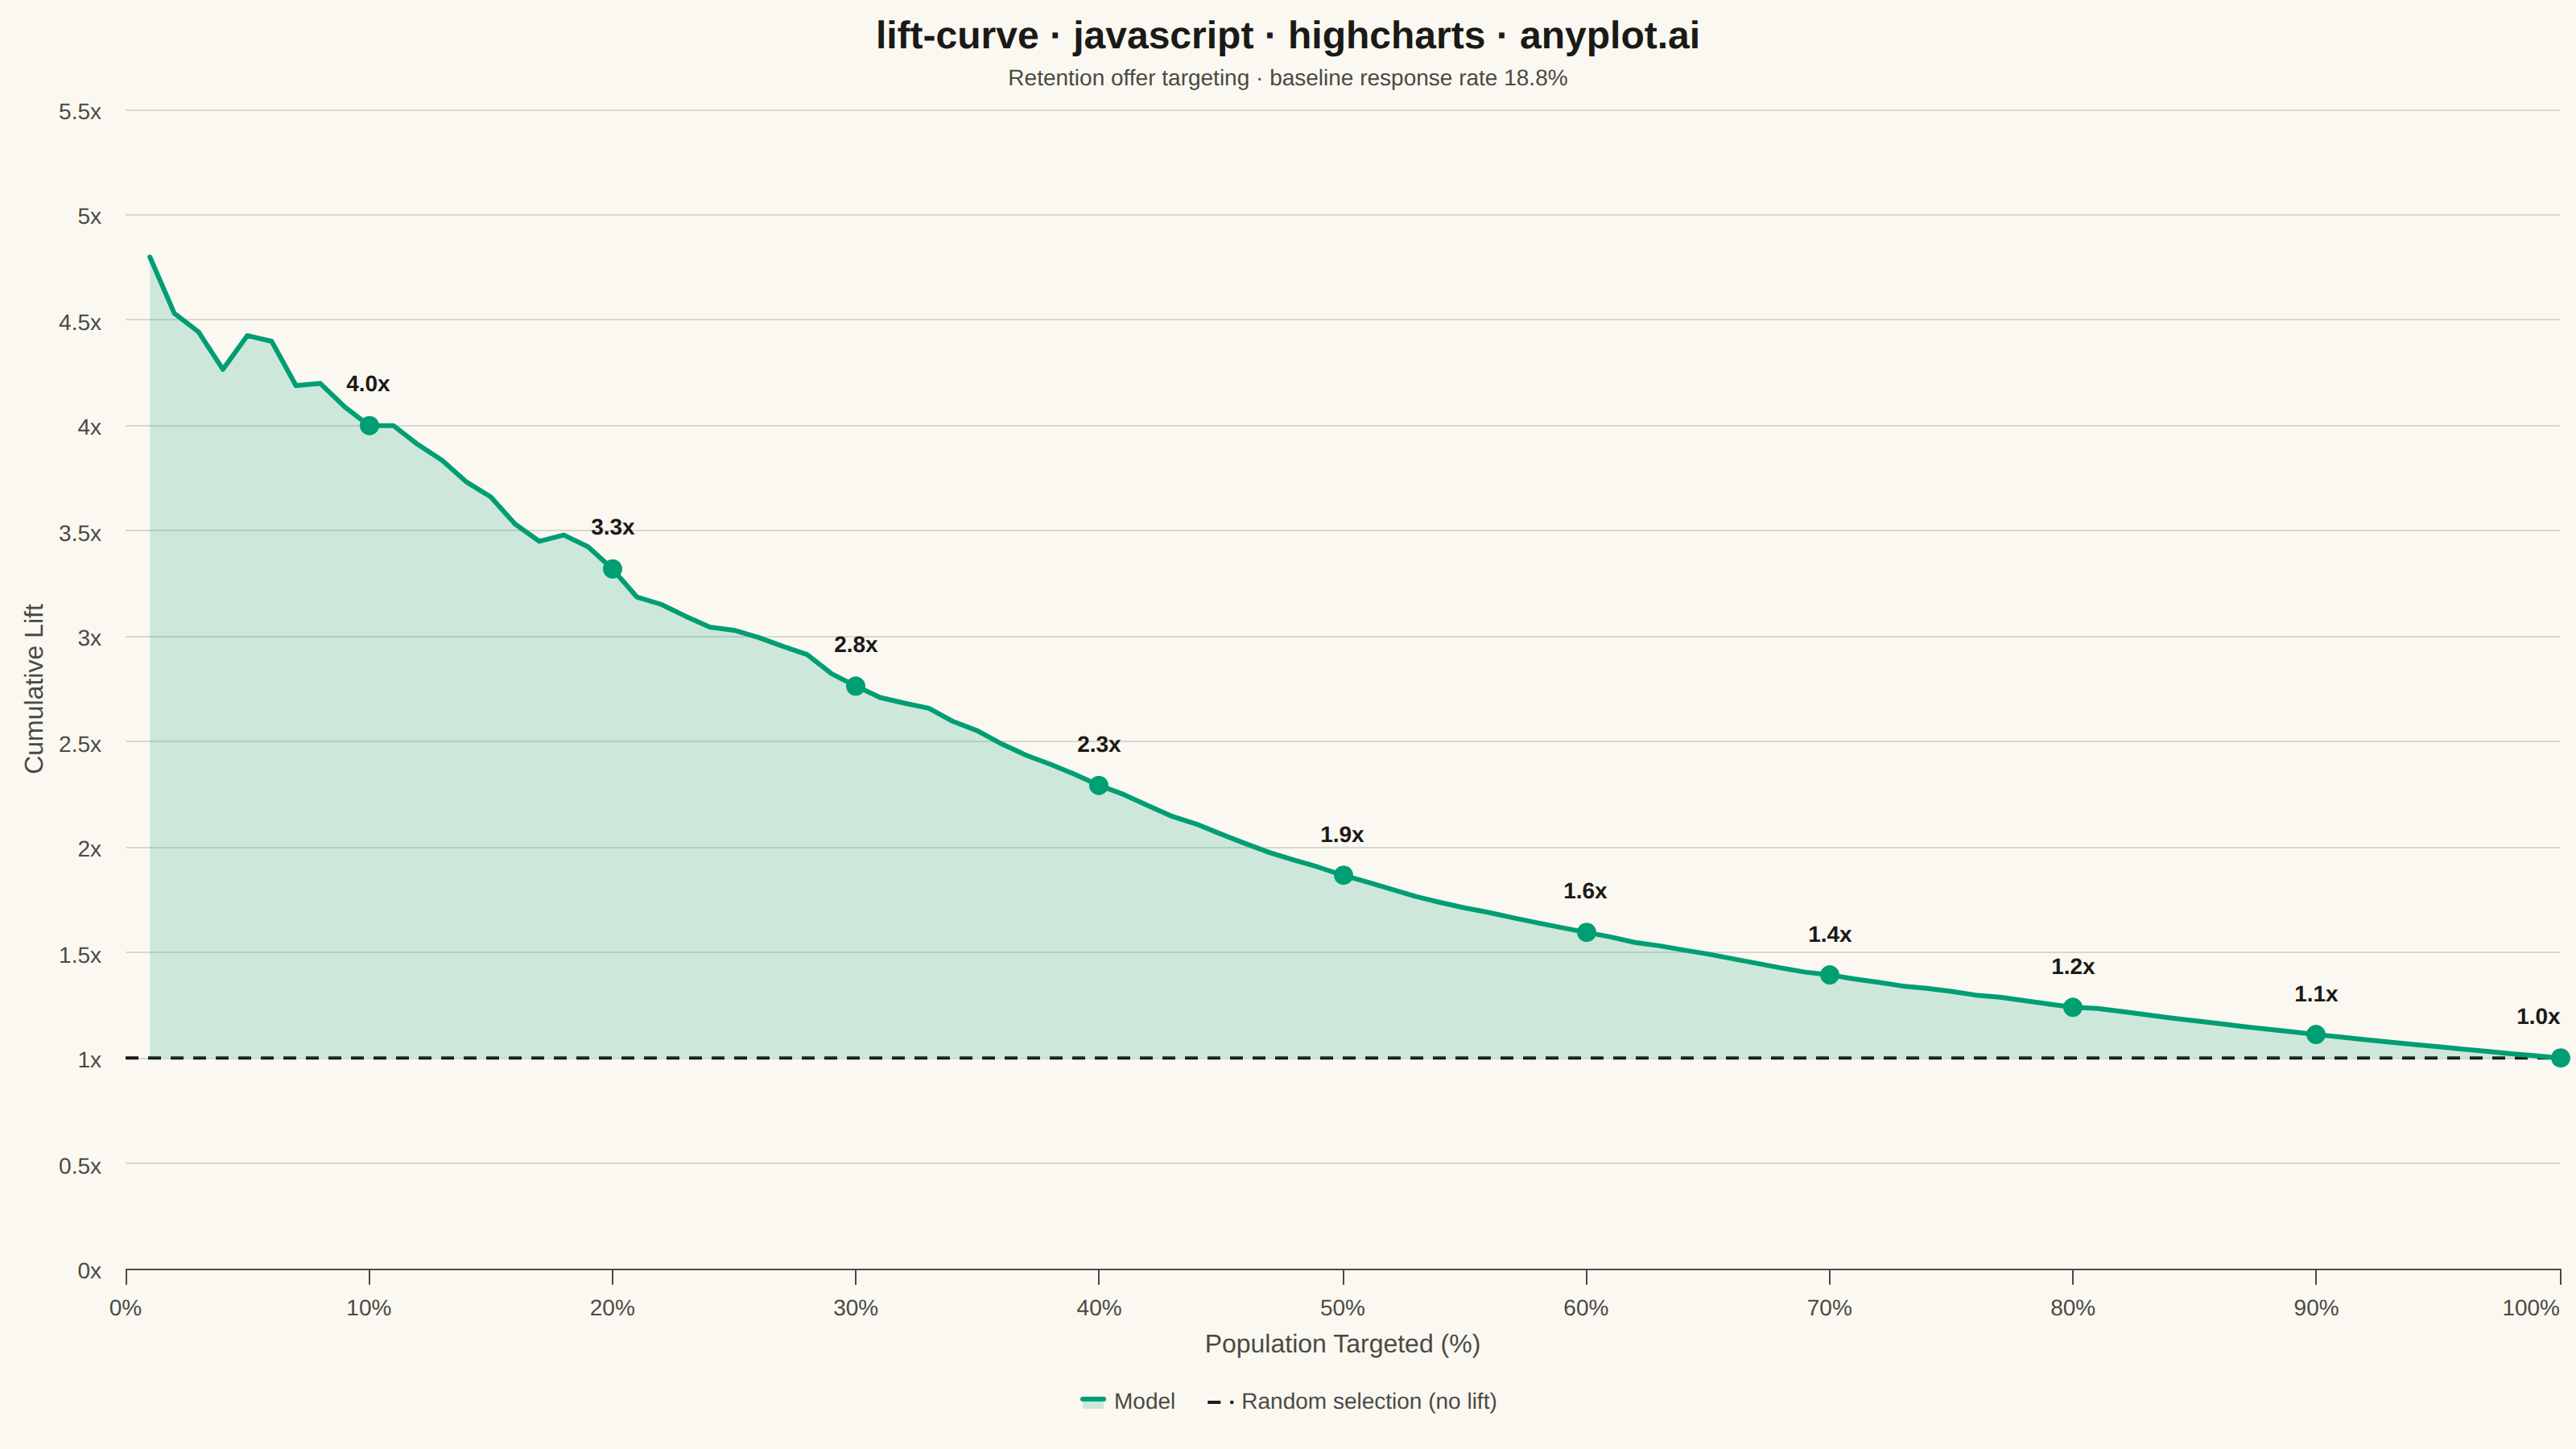
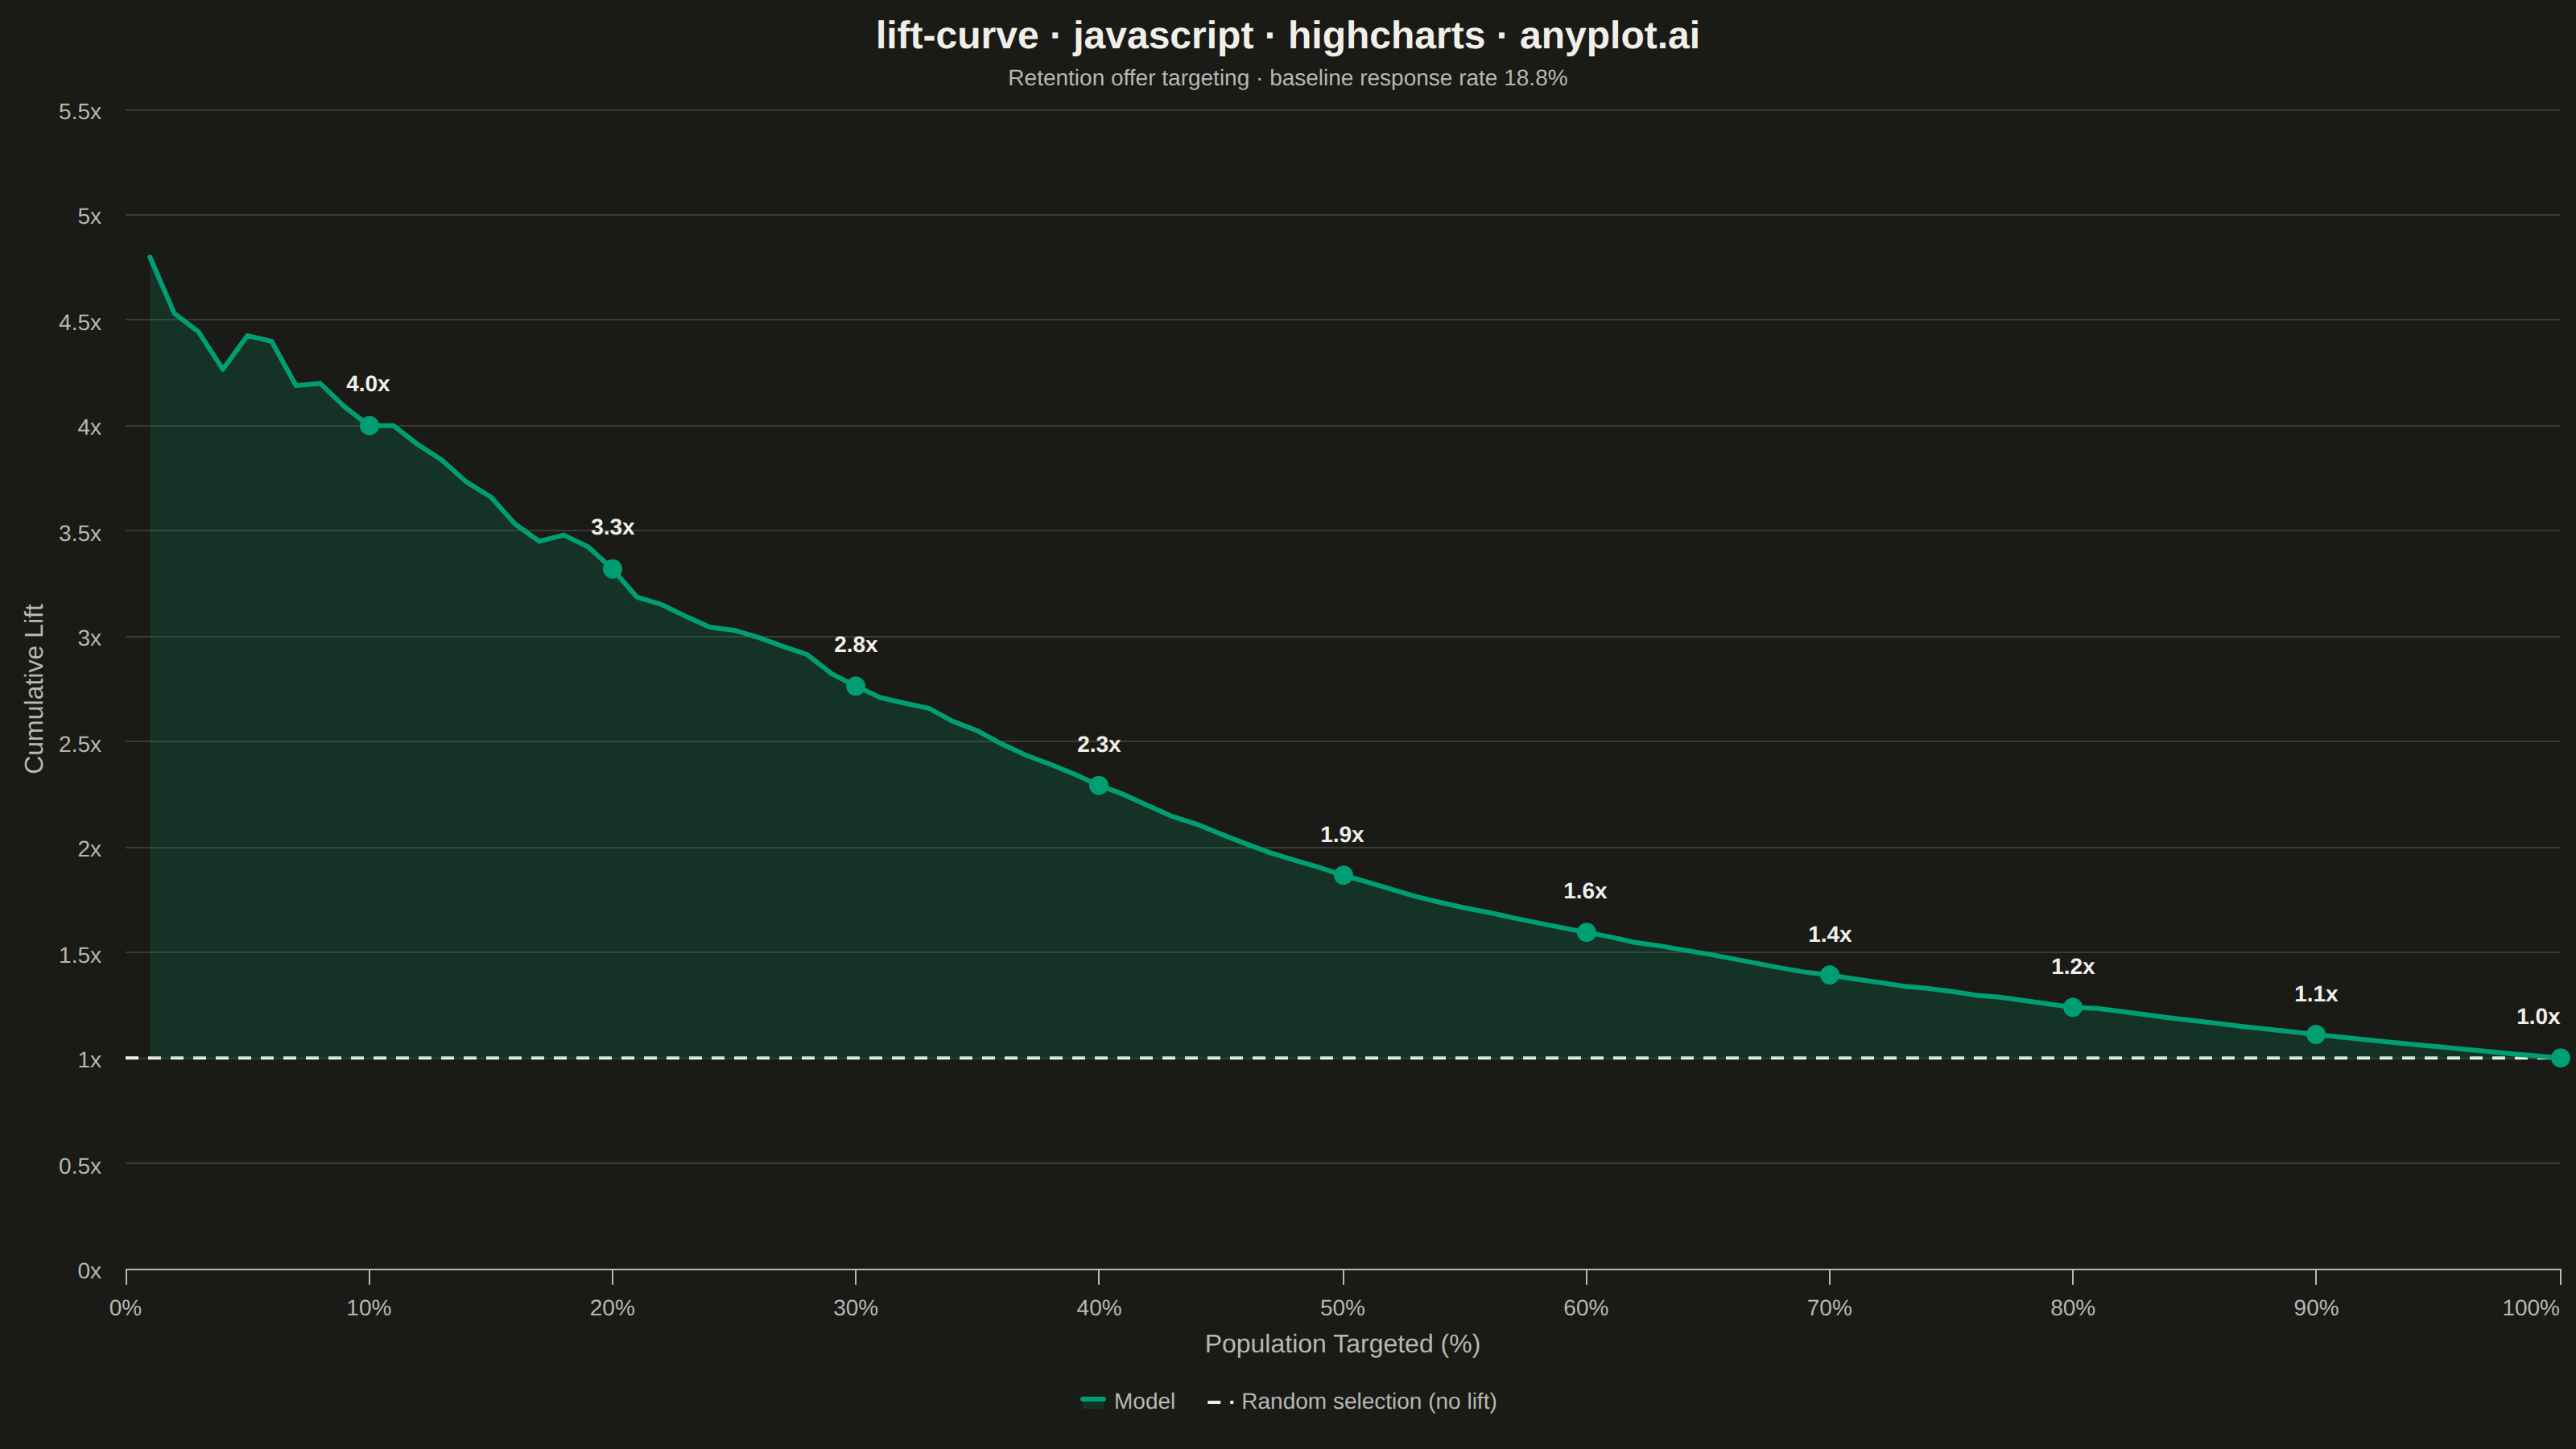
A lift curve visualizes how much better a predictive model performs compared to random selection, showing the cumulative lift ratio as you target increasing percentages of the population. It answers the question: "If I target the top X% of predictions, how many times more responders will I capture than random targeting?" This plot is essential for evaluating and comparing classification models in scenarios where targeting efficiency matters.
// anyplot.ai
// lift-curve: Model Lift Chart
// Library: highcharts 12.6.0 | JavaScript 22.23.2
// Quality: 93/100 | Created: 2026-09-05

//# anyplot-orientation: landscape
const t = window.ANYPLOT_TOKENS;

// --- Data: simulate a retention-campaign response model on 2000 customers --
// Deterministic PRNG (mulberry32) — the browser has no seeded Math.random.
function mulberry32(seed) {
  return function () {
    seed = (seed + 0x6d2b79f5) | 0;
    let x = Math.imul(seed ^ (seed >>> 15), 1 | seed);
    x = (x + Math.imul(x ^ (x >>> 7), 61 | x)) ^ x;
    return ((x ^ (x >>> 14)) >>> 0) / 4294967296;
  };
}
const rand = mulberry32(42);

const CUSTOMER_COUNT = 2000;
let totalResponders = 0;
const customers = [];
for (let i = 0; i < CUSTOMER_COUNT; i++) {
  // Most customers have low churn-retention-offer propensity; a few are highly likely to respond.
  const propensity = Math.pow(rand(), 4);
  const trueResponseProb = Math.min(0.9, propensity);
  const responded = rand() < trueResponseProb ? 1 : 0;
  totalResponders += responded;
  // The model score correlates with true propensity but is imperfect (added noise).
  const score = propensity + (rand() - 0.5) * 0.3;
  customers.push({ responded, score });
}
customers.sort((a, b) => b.score - a.score);

const baselineRate = totalResponders / CUSTOMER_COUNT;

const liftData = [];
let cumResponders = 0;
let cumCustomers = 0;
for (let pct = 1; pct <= 100; pct++) {
  const cutoff = Math.round((pct / 100) * CUSTOMER_COUNT);
  while (cumCustomers < cutoff) {
    cumResponders += customers[cumCustomers].responded;
    cumCustomers++;
  }
  const lift = cumResponders / cumCustomers / baselineRate;
  const isDecile = pct % 10 === 0;
  liftData.push({
    x: pct,
    y: Number(lift.toFixed(3)),
    marker: { enabled: isDecile, radius: isDecile ? 6 : 0 },
    dataLabels: { enabled: isDecile },
    custom: { responders: cumResponders, customers: cumCustomers },
  });
}

const randomSelectionData = [
  { x: 0, y: 1 },
  { x: 100, y: 1 },
];

// --- Chart -------------------------------------------------------------------
Highcharts.chart("container", {
  chart: {
    type: "line",
    backgroundColor: "transparent",
    animation: false,
    style: { fontFamily: "inherit" },
  },
  credits: { enabled: false },
  colors: t.palette,
  title: {
    text: "lift-curve · javascript · highcharts · anyplot.ai",
    style: { color: t.ink, fontSize: "24px", fontWeight: "700" },
  },
  subtitle: {
    text: `Retention offer targeting · baseline response rate ${(baselineRate * 100).toFixed(1)}%`,
    style: { color: t.inkSoft, fontSize: "14px" },
  },
  xAxis: {
    title: { text: "Population Targeted (%)", style: { color: t.inkSoft, fontSize: "16px" } },
    min: 0,
    max: 100,
    tickInterval: 10,
    lineColor: t.inkSoft,
    tickColor: t.inkSoft,
    gridLineColor: t.grid,
    labels: { style: { color: t.inkSoft, fontSize: "14px" }, format: "{value}%" },
  },
  yAxis: {
    title: { text: "Cumulative Lift", style: { color: t.inkSoft, fontSize: "16px" } },
    min: 0,
    gridLineColor: t.grid,
    labels: { style: { color: t.inkSoft, fontSize: "14px" }, format: "{value}x" },
  },
  legend: {
    itemStyle: { color: t.inkSoft, fontSize: "14px" },
    itemHoverStyle: { color: t.ink },
  },
  plotOptions: {
    series: { animation: false },
    line: { lineWidth: 3, marker: { enabled: false } },
    area: { lineWidth: 3, marker: { enabled: false } },
  },
  series: [
    {
      name: "Model",
      type: "area",
      data: liftData,
      color: t.palette[0],
      // Fill only the wedge between the curve and the y=1 baseline, not down to 0,
      // to visually emphasize the lift magnitude being captured.
      threshold: 1,
      fillOpacity: 0.18,
      fillColor: Highcharts.color(t.palette[0]).setOpacity(0.18).get("rgba"),
      zIndex: 2,
      dataLabels: {
        enabled: false,
        format: "{y:.1f}x",
        style: { color: t.ink, fontSize: "14px", fontWeight: "600", textOutline: "none" },
        y: -14,
      },
      tooltip: {
        pointFormatter: function () {
          const c = this.custom || {};
          return (
            `<span style="color:${this.color}">●</span> ${this.series.name}: <b>${this.y}x</b> lift<br/>` +
            `Captured ${c.responders} of ${totalResponders} responders (${c.customers} customers targeted)<br/>`
          );
        },
      },
    },
    {
      name: "Random selection (no lift)",
      data: randomSelectionData,
      color: t.ink,
      dashStyle: "Dash",
      lineWidth: 2,
      marker: { enabled: false },
      enableMouseTracking: false,
      zIndex: 1,
    },
  ],
});
Runnable source as JSON, for any HTTP client: https://api.anyplot.ai/specs/lift-curve/highcharts/code. Any spec id and library id listed in llms-full.txt fit the same URL shape; every URL below is complete and callable.
{
  "spec_id": "lift-curve",
  "language": "javascript",
  "library": "highcharts",
  "page": "https://anyplot.ai/lift-curve/javascript/highcharts",
  "hub": "https://anyplot.ai/lift-curve",
  "code_json": "https://api.anyplot.ai/specs/lift-curve/highcharts/code",
  "spec_json": "https://api.anyplot.ai/specs/lift-curve",
  "render_light_png": "https://storage.googleapis.com/anyplot-images/plots/lift-curve/javascript/highcharts/plot-light.png",
  "render_dark_png": "https://storage.googleapis.com/anyplot-images/plots/lift-curve/javascript/highcharts/plot-dark.png",
  "interactive_light_html": "https://storage.googleapis.com/anyplot-images/plots/lift-curve/javascript/highcharts/plot-light.html",
  "interactive_dark_html": "https://storage.googleapis.com/anyplot-images/plots/lift-curve/javascript/highcharts/plot-dark.html",
  "quality_score": 93.0,
  "license": "MIT",
  "guide": "https://anyplot.ai/llms.txt"
}
Part of Model Lift Chart on anyplot.ai.