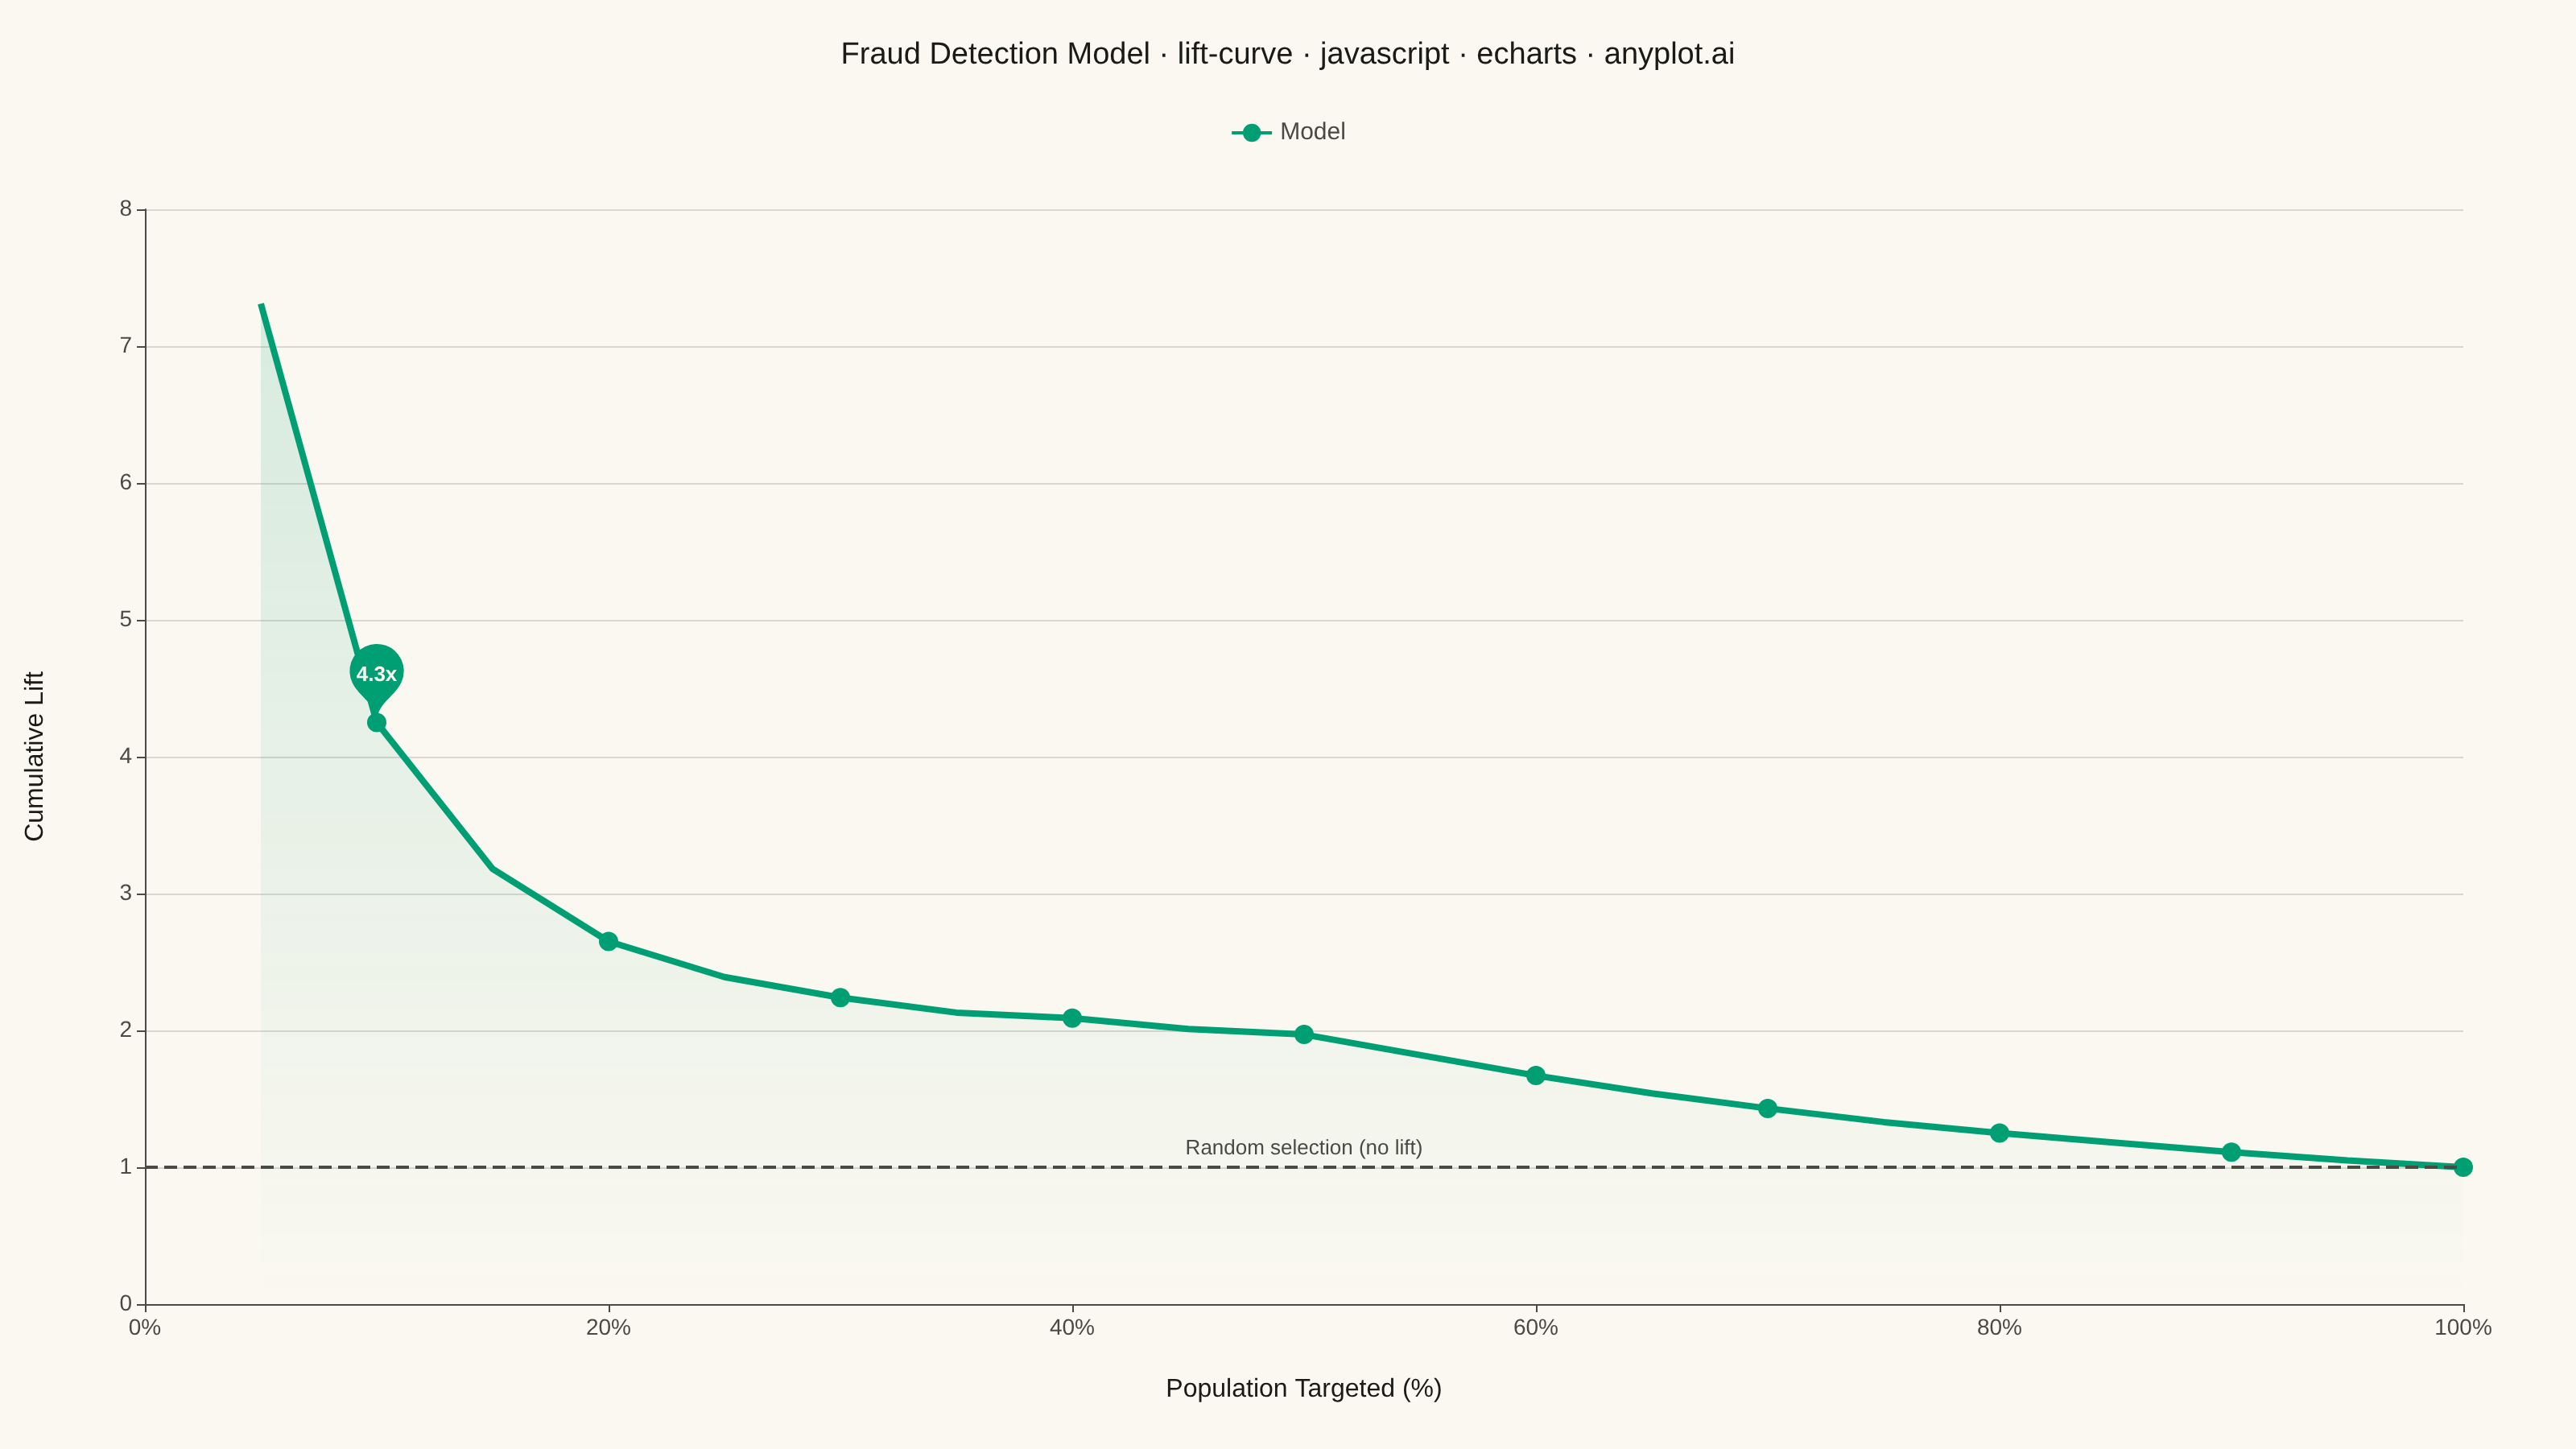
The same plot in 14 other libraries — JavaScript: Chart.js, D3.js, Highcharts, MUI X Charts; Python: Altair, Bokeh, lets-plot, Matplotlib, Plotly, plotnine, Pygal, Seaborn; R: ggplot2; Julia: Makie.jl. Compare all 15 side by side: Model Lift Chart in Python, R, Julia and JavaScript.
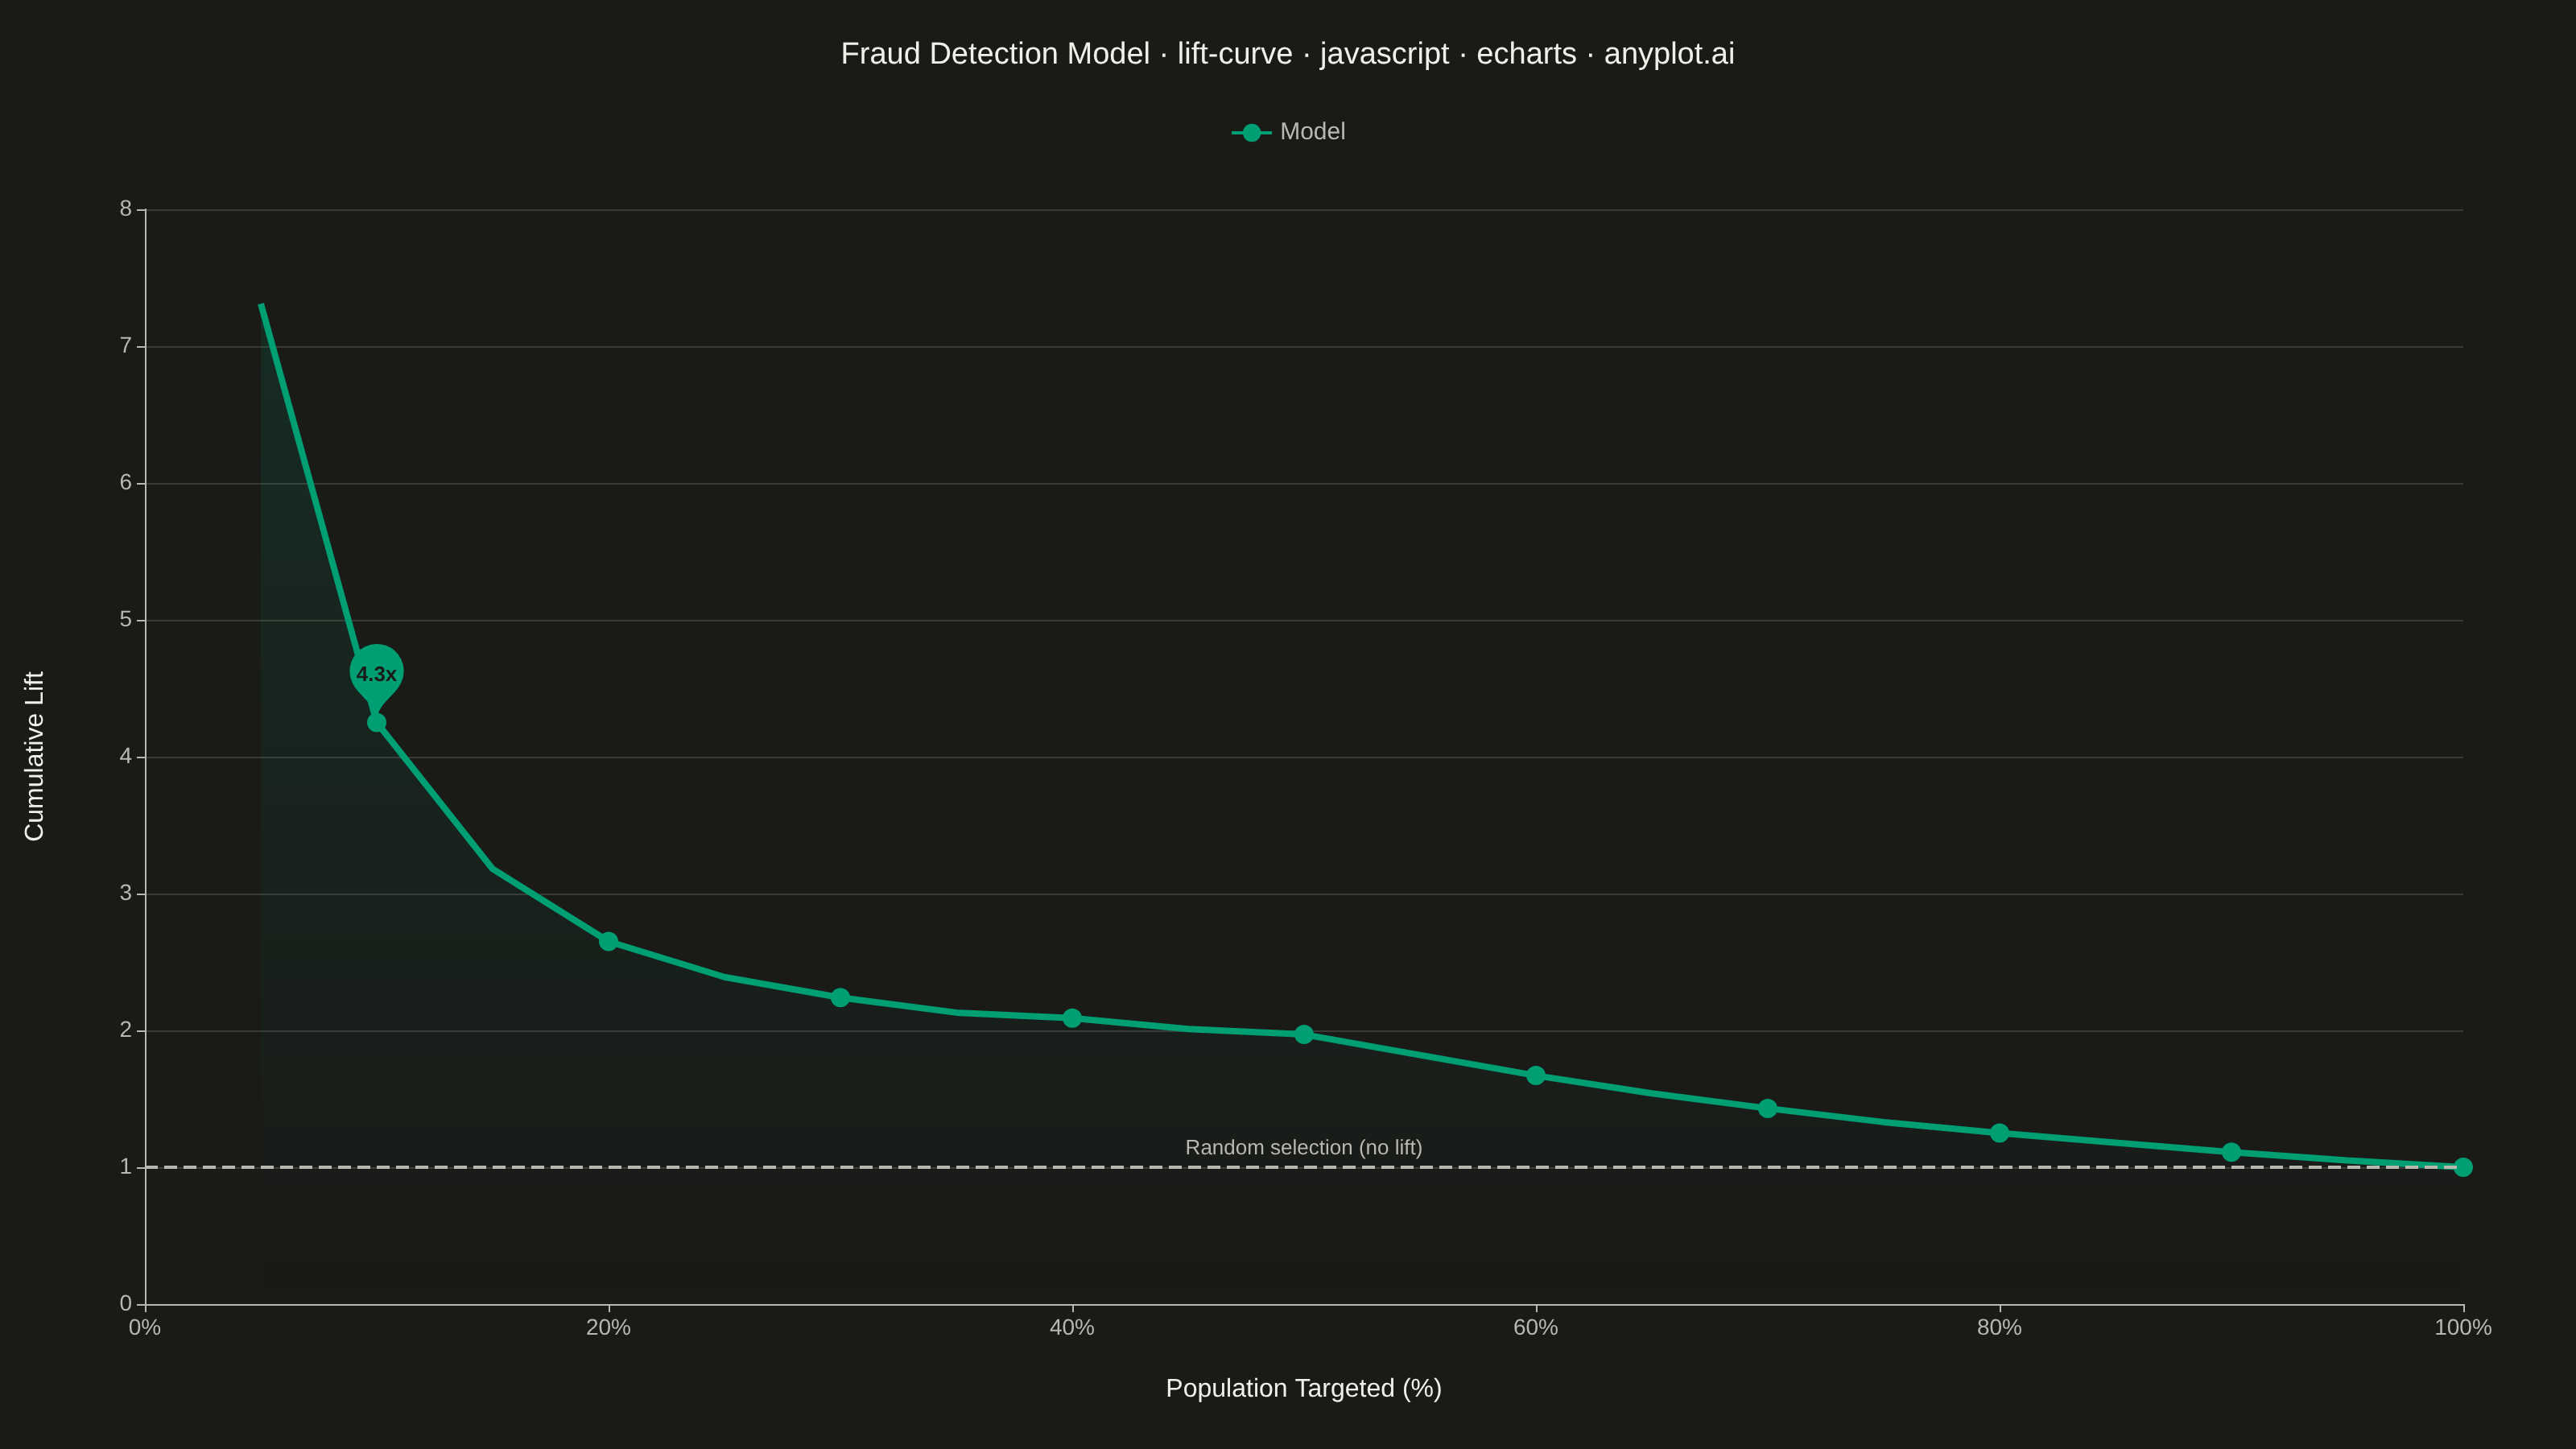
A lift curve visualizes how much better a predictive model performs compared to random selection, showing the cumulative lift ratio as you target increasing percentages of the population. It answers the question: "If I target the top X% of predictions, how many times more responders will I capture than random targeting?" This plot is essential for evaluating and comparing classification models in scenarios where targeting efficiency matters.
// anyplot.ai
// lift-curve: Model Lift Chart
// Library: echarts 6.1.0 | JavaScript 22.23.2
// Quality: 95/100 | Created: 2026-09-05

const t = window.ANYPLOT_TOKENS;

// --- Data (in-memory, deterministic fraud-detection scenario) --------------
// Tiny fixed-seed LCG so the ranking of predicted scores is reproducible.
let seed = 42;
function rand() {
  seed = (seed * 1103515245 + 12345) & 0x7fffffff;
  return seed / 0x7fffffff;
}

const nTransactions = 2000;
const fraudRate = 0.06;

// Model score correlates with true fraud label but with realistic noise
// (wide overlap between the two distributions), so the resulting lift curve
// starts well below the theoretical maximum and decays toward 1 - the shape
// of a genuinely good, but imperfect, classifier.
const records = [];
for (let i = 0; i < nTransactions; i++) {
  const isFraud = rand() < fraudRate ? 1 : 0;
  const score = isFraud
    ? Math.min(1, 0.35 + rand() * 0.55)
    : Math.max(0, rand() * 0.7);
  records.push({ isFraud, score });
}
records.sort((a, b) => b.score - a.score);

const totalFraud = records.reduce((sum, r) => sum + r.isFraud, 0);
const baselineRate = totalFraud / nTransactions;

// Cumulative lift at each decile (10%, 20%, ..., 100%) of targeted population.
const steps = 20;
const pctTargeted = [];
const liftValues = [];
for (let s = 1; s <= steps; s++) {
  const cutoff = Math.round((s / steps) * nTransactions);
  const capturedFraud = records
    .slice(0, cutoff)
    .reduce((sum, r) => sum + r.isFraud, 0);
  const targetedRate = capturedFraud / cutoff;
  pctTargeted.push(Math.round((s / steps) * 100));
  liftValues.push(Number((targetedRate / baselineRate).toFixed(2)));
}

// Decile markers (every other step = every 10%) for emphasis.
const decileIndices = pctTargeted
  .map((pct, idx) => (pct % 10 === 0 ? idx : -1))
  .filter((idx) => idx >= 0);

// --- Init --------------------------------------------------------------------
const chart = echarts.init(document.getElementById("container"));

// --- Option --------------------------------------------------------------------
chart.setOption({
  animation: false,
  color: t.palette,
  backgroundColor: "transparent",
  title: {
    text: "Fraud Detection Model · lift-curve · javascript · echarts · anyplot.ai",
    left: "center",
    top: 20,
    textStyle: { color: t.ink, fontSize: 19, fontWeight: 500 },
  },
  legend: {
    data: ["Model"],
    top: 70,
    textStyle: { color: t.inkSoft, fontSize: 15 },
  },
  grid: { left: 90, right: 70, top: 130, bottom: 90 },
  xAxis: {
    type: "value",
    name: "Population Targeted (%)",
    nameLocation: "middle",
    nameGap: 45,
    nameTextStyle: { color: t.ink, fontSize: 16 },
    min: 0,
    max: 100,
    axisLabel: {
      color: t.inkSoft,
      fontSize: 14,
      formatter: "{value}%",
    },
    axisLine: { lineStyle: { color: t.inkSoft } },
    splitLine: { show: false },
  },
  yAxis: {
    type: "value",
    name: "Cumulative Lift",
    nameLocation: "middle",
    nameGap: 60,
    nameTextStyle: { color: t.ink, fontSize: 16 },
    axisLabel: { color: t.inkSoft, fontSize: 14 },
    axisLine: { lineStyle: { color: t.inkSoft } },
    splitLine: { lineStyle: { color: t.grid } },
  },
  series: [
    {
      name: "Model",
      type: "line",
      data: pctTargeted.map((pct, idx) => [pct, liftValues[idx]]),
      smooth: false,
      symbol: "circle",
      symbolSize: (val, params) =>
        decileIndices.includes(params.dataIndex) ? 12 : 0,
      lineStyle: { color: t.palette[0], width: 4 },
      itemStyle: { color: t.palette[0] },
      areaStyle: {
        color: {
          type: "linear",
          x: 0,
          y: 0,
          x2: 0,
          y2: 1,
          colorStops: [
            { offset: 0, color: `${t.palette[0]}33` },
            { offset: 1, color: `${t.palette[0]}00` },
          ],
        },
      },
      // Reference line for random selection (y=1) - a markLine keeps the
      // "no lift" baseline attached to the Model series instead of a second
      // full series, avoiding legend/series boilerplate for a constant line.
      markLine: {
        silent: true,
        symbol: "none",
        lineStyle: { color: t.inkSoft, width: 2, type: "dashed" },
        label: {
          show: true,
          formatter: "Random selection (no lift)",
          position: "insideMiddleTop",
          color: t.inkSoft,
          fontSize: 13,
        },
        data: [{ yAxis: 1 }],
      },
      // Callout annotating the headline lift value at the first decile.
      markPoint: {
        symbol: "pin",
        symbolSize: 56,
        itemStyle: { color: t.palette[0] },
        label: {
          formatter: `${liftValues[1].toFixed(1)}x`,
          color: t.pageBg,
          fontSize: 13,
          fontWeight: 600,
        },
        data: [
          {
            name: "Top decile lift",
            coord: [pctTargeted[1], liftValues[1]],
          },
        ],
      },
    },
  ],
});
Runnable source as JSON, for any HTTP client: https://api.anyplot.ai/specs/lift-curve/echarts/code. Any spec id and library id listed in llms-full.txt fit the same URL shape; every URL below is complete and callable.
{
  "spec_id": "lift-curve",
  "language": "javascript",
  "library": "echarts",
  "page": "https://anyplot.ai/lift-curve/javascript/echarts",
  "hub": "https://anyplot.ai/lift-curve",
  "code_json": "https://api.anyplot.ai/specs/lift-curve/echarts/code",
  "spec_json": "https://api.anyplot.ai/specs/lift-curve",
  "render_light_png": "https://storage.googleapis.com/anyplot-images/plots/lift-curve/javascript/echarts/plot-light.png",
  "render_dark_png": "https://storage.googleapis.com/anyplot-images/plots/lift-curve/javascript/echarts/plot-dark.png",
  "interactive_light_html": "https://storage.googleapis.com/anyplot-images/plots/lift-curve/javascript/echarts/plot-light.html",
  "interactive_dark_html": "https://storage.googleapis.com/anyplot-images/plots/lift-curve/javascript/echarts/plot-dark.html",
  "quality_score": 95.0,
  "license": "MIT",
  "guide": "https://anyplot.ai/llms.txt"
}
Part of Model Lift Chart on anyplot.ai.