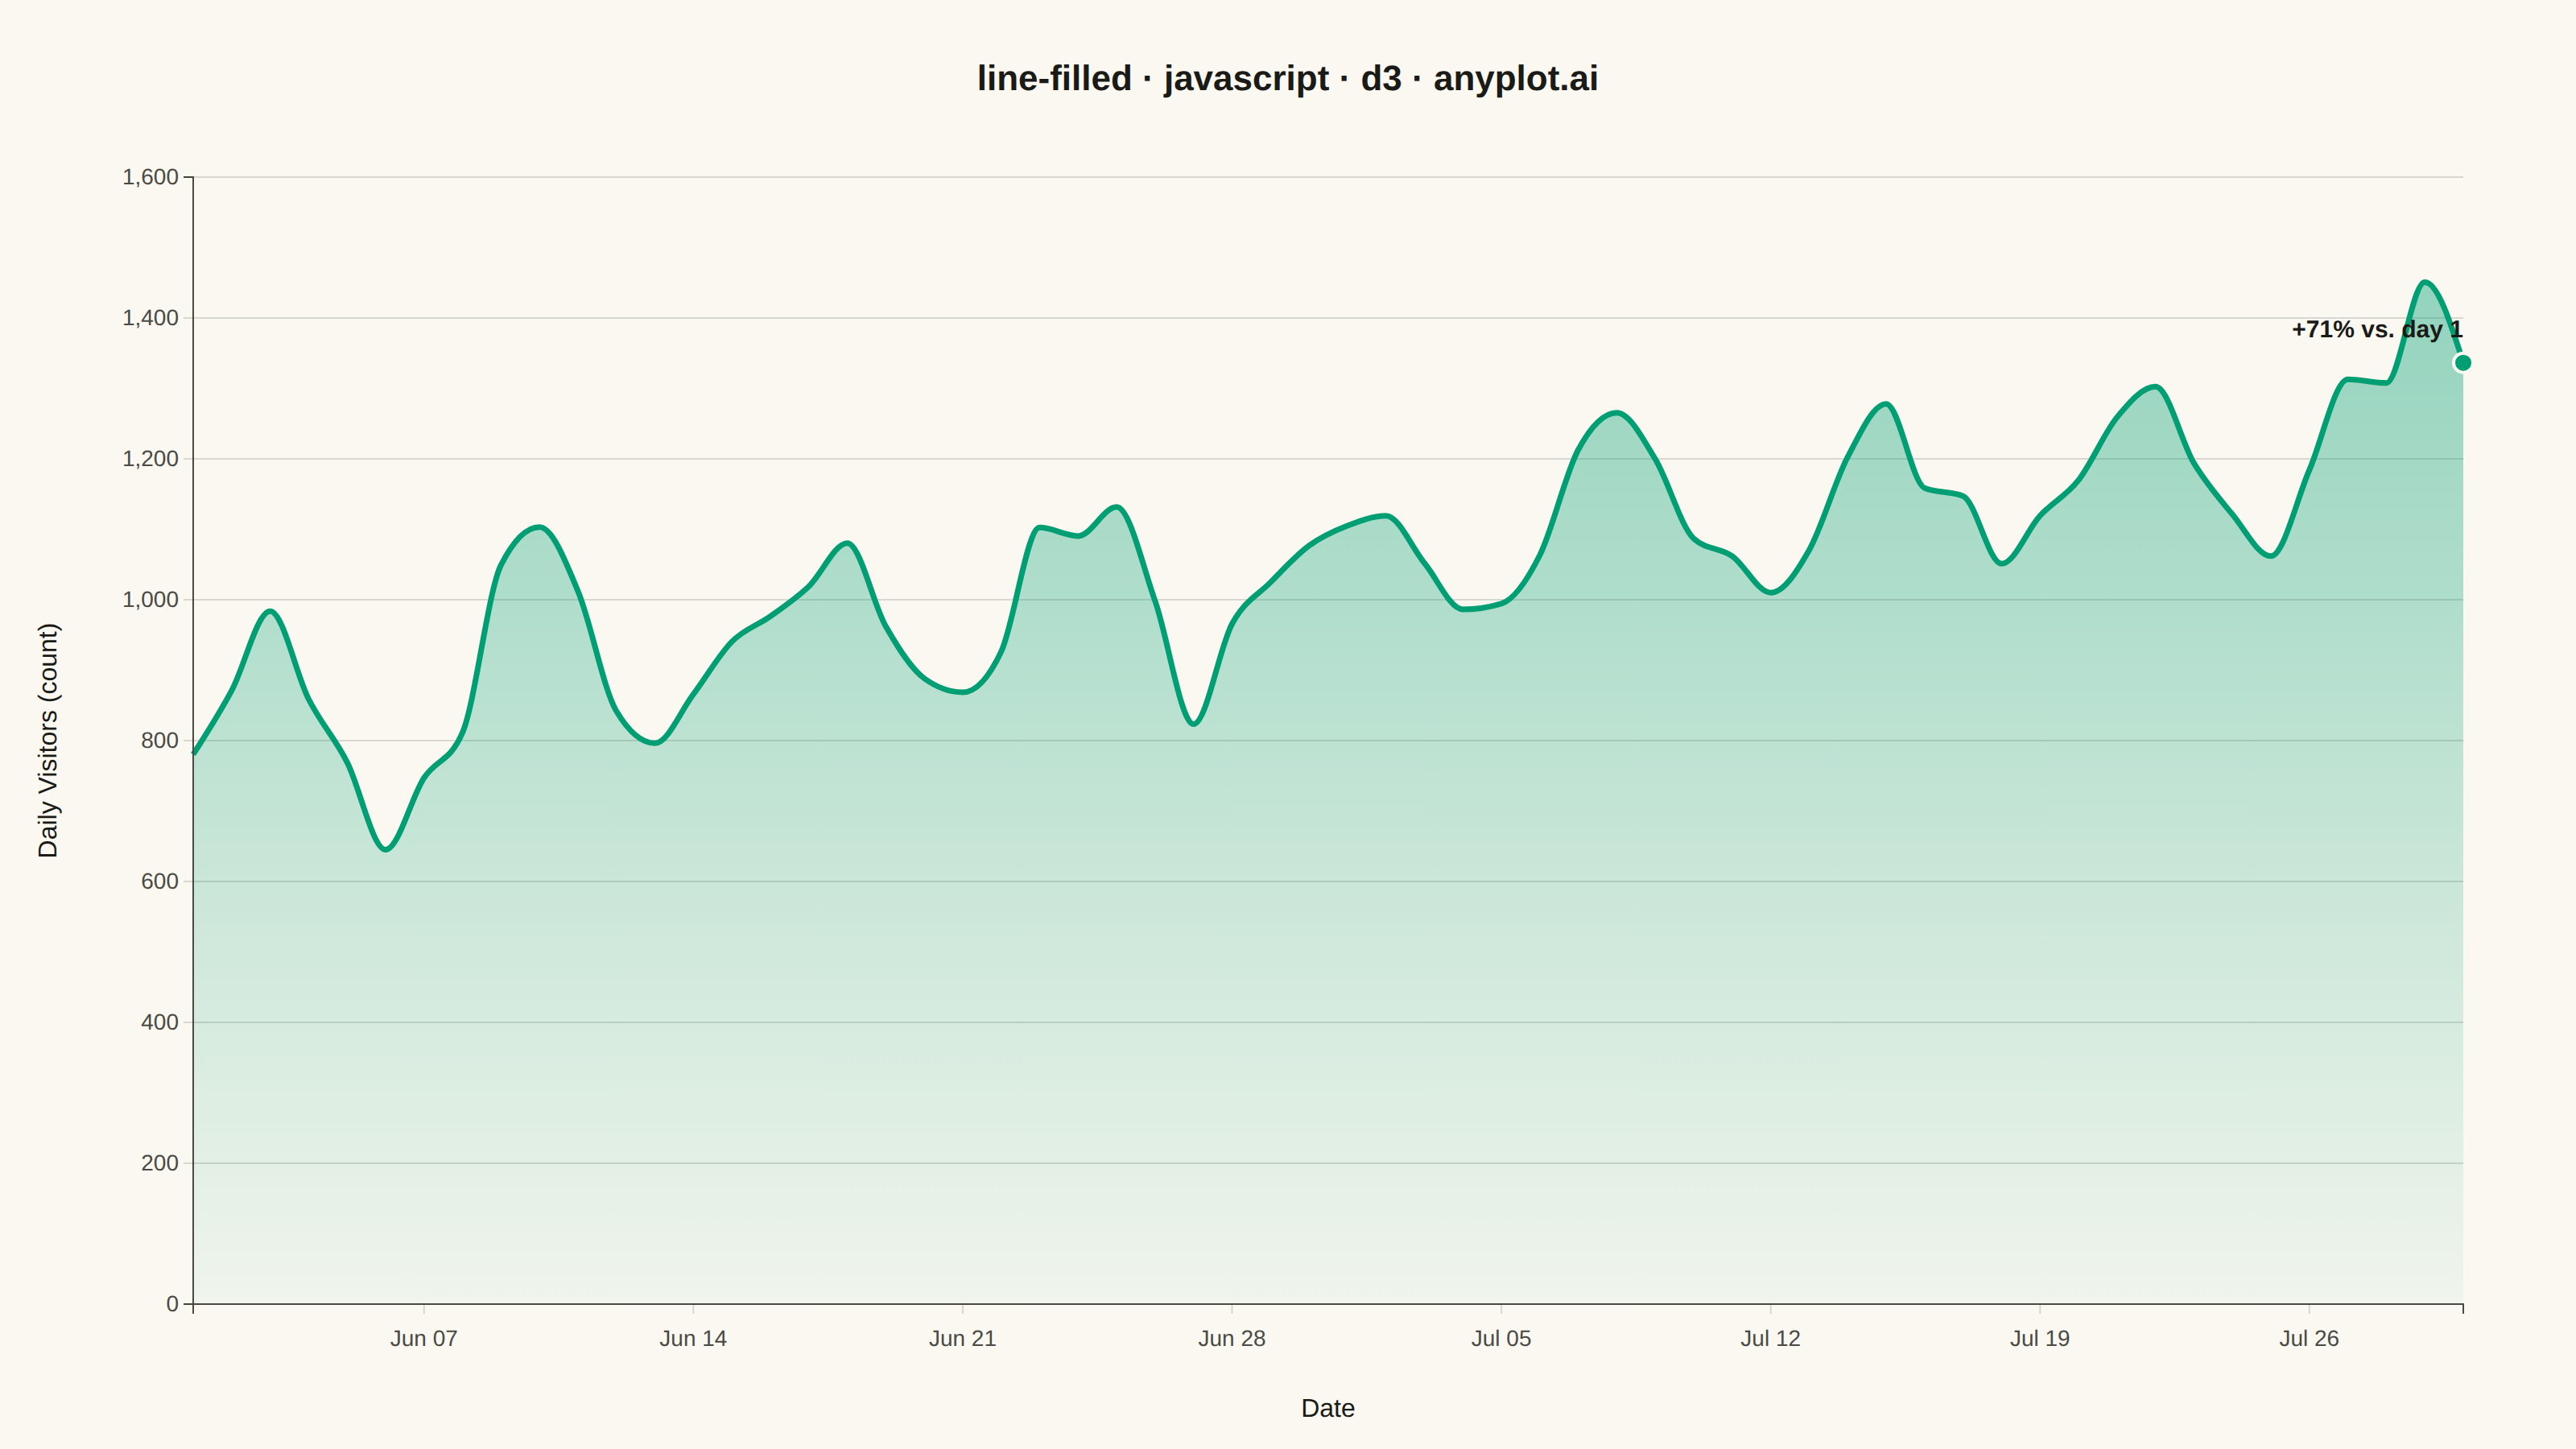
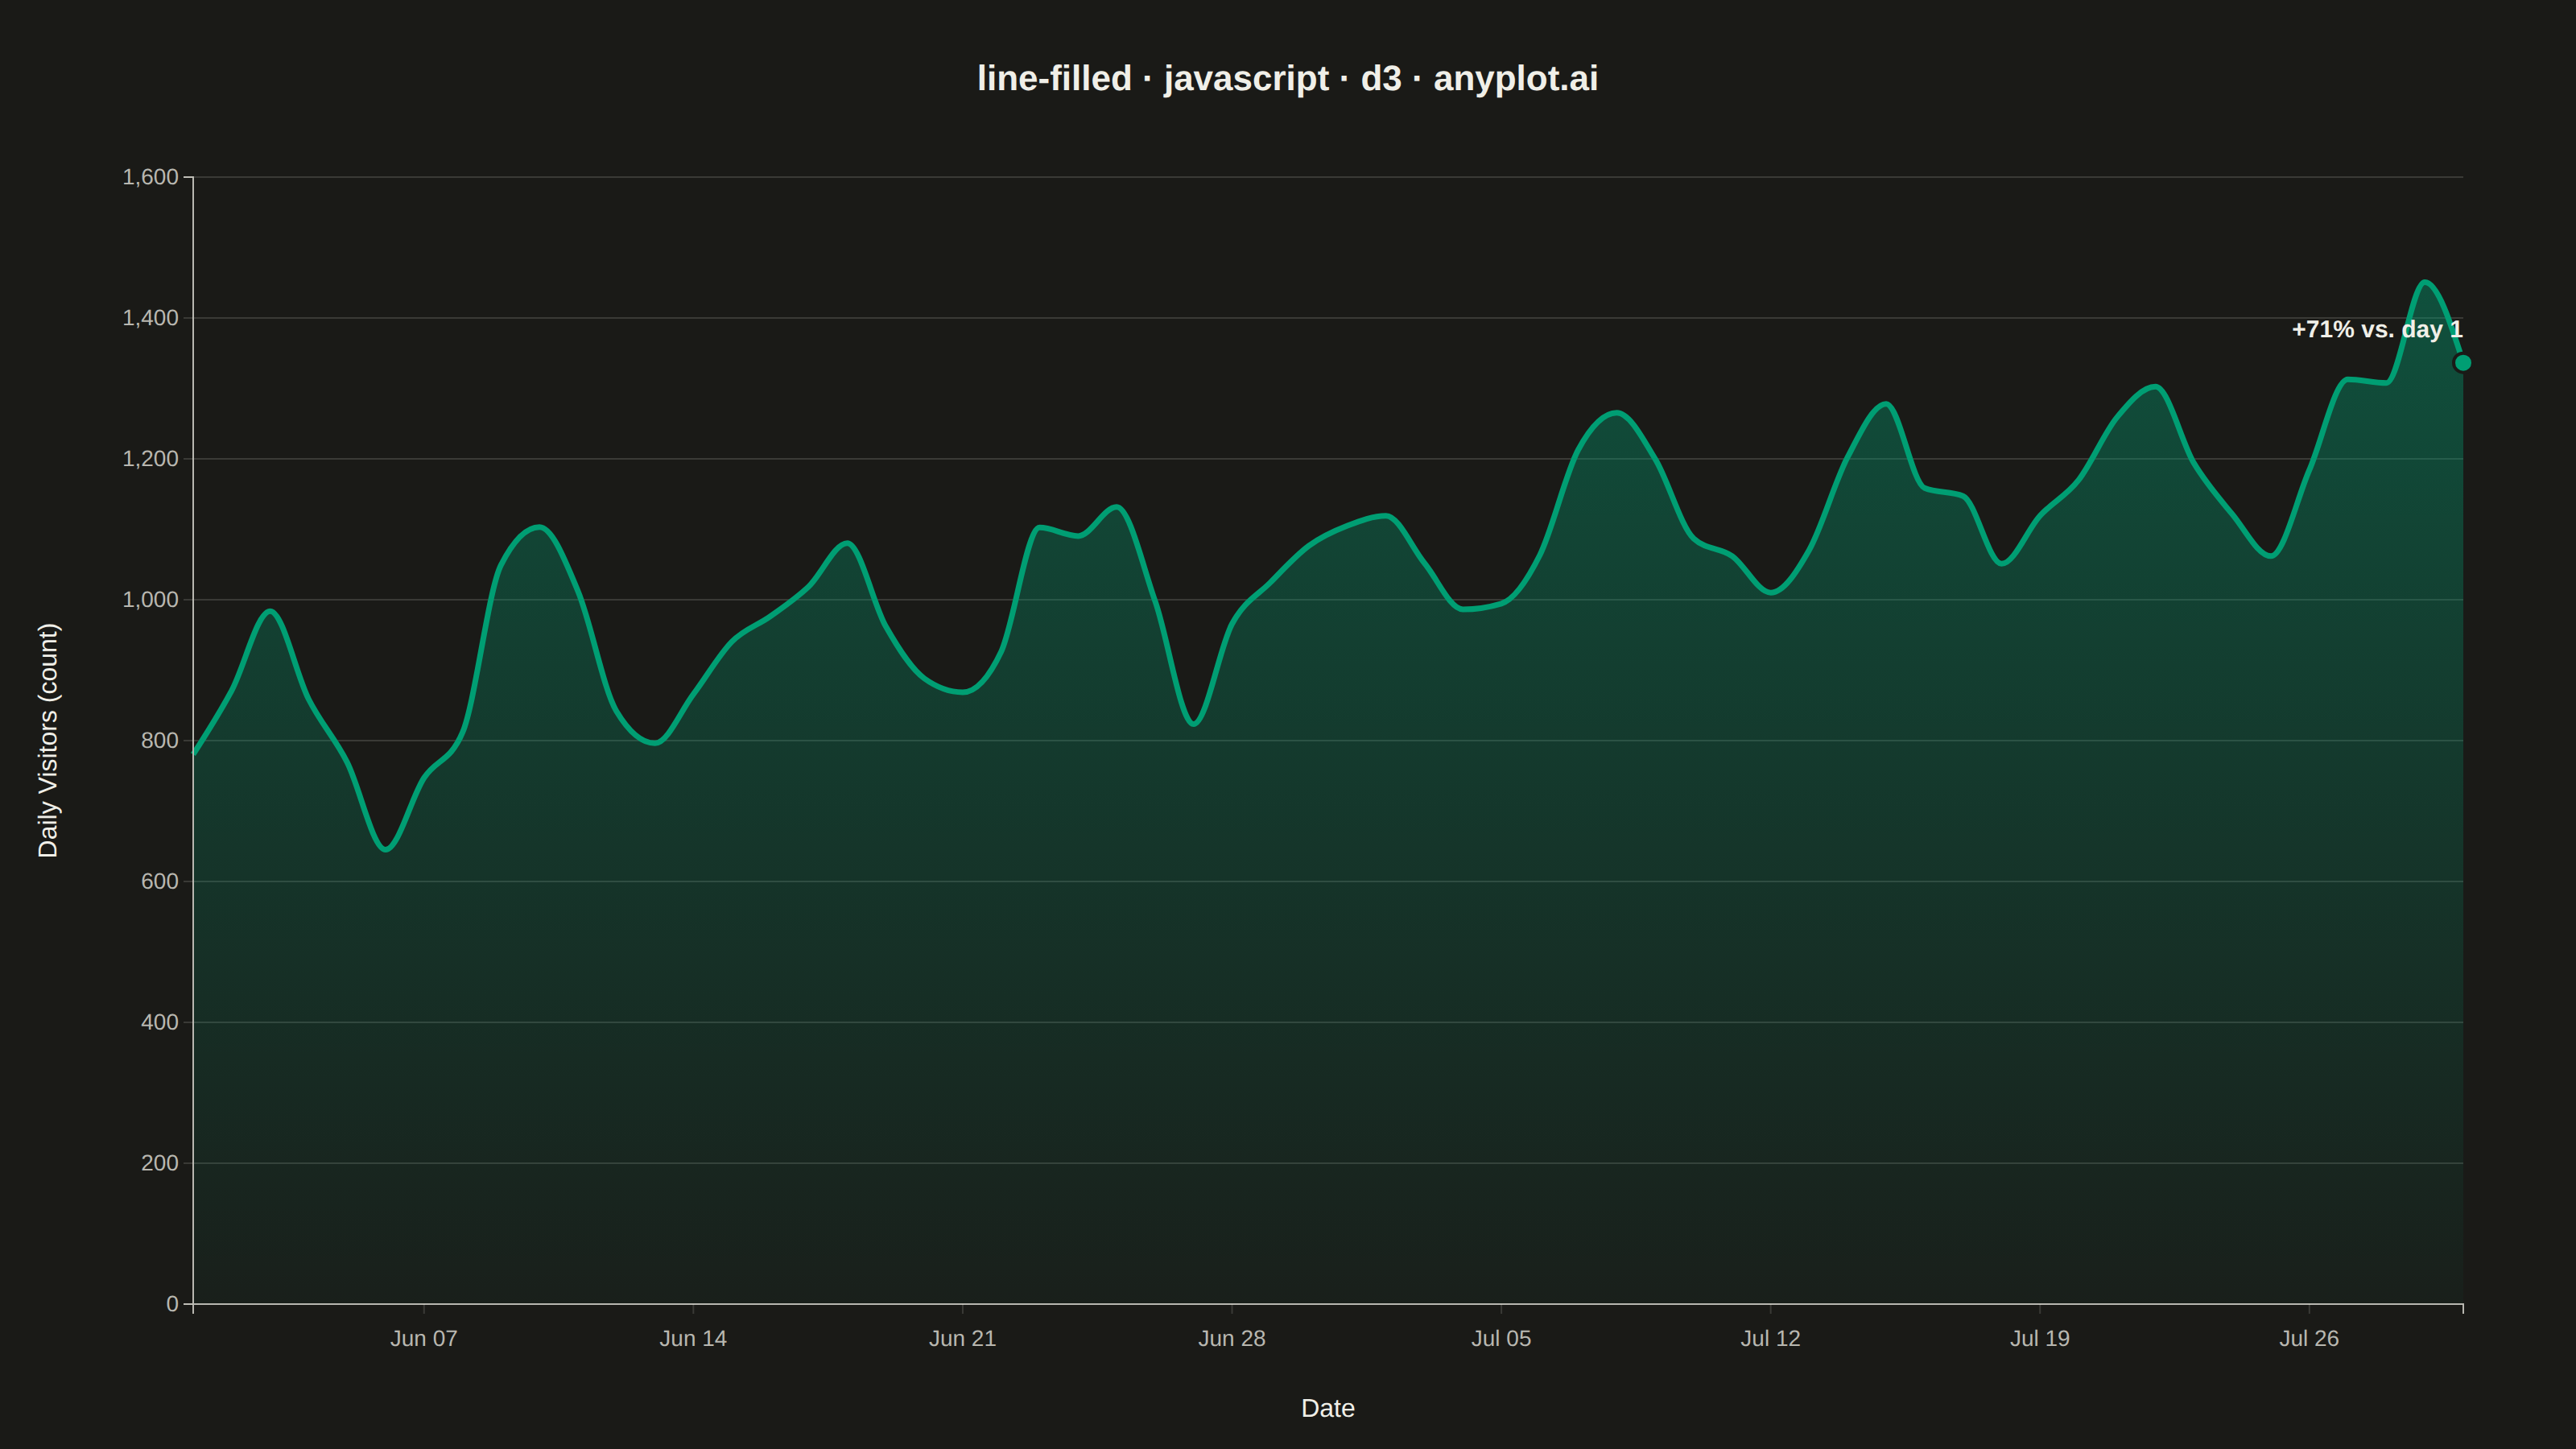
A line plot with the area between the line and the baseline (typically x-axis) filled with a semi-transparent color. This creates an area chart effect for a single series, emphasizing the magnitude of values.
Preview render from the D3.js implementation.