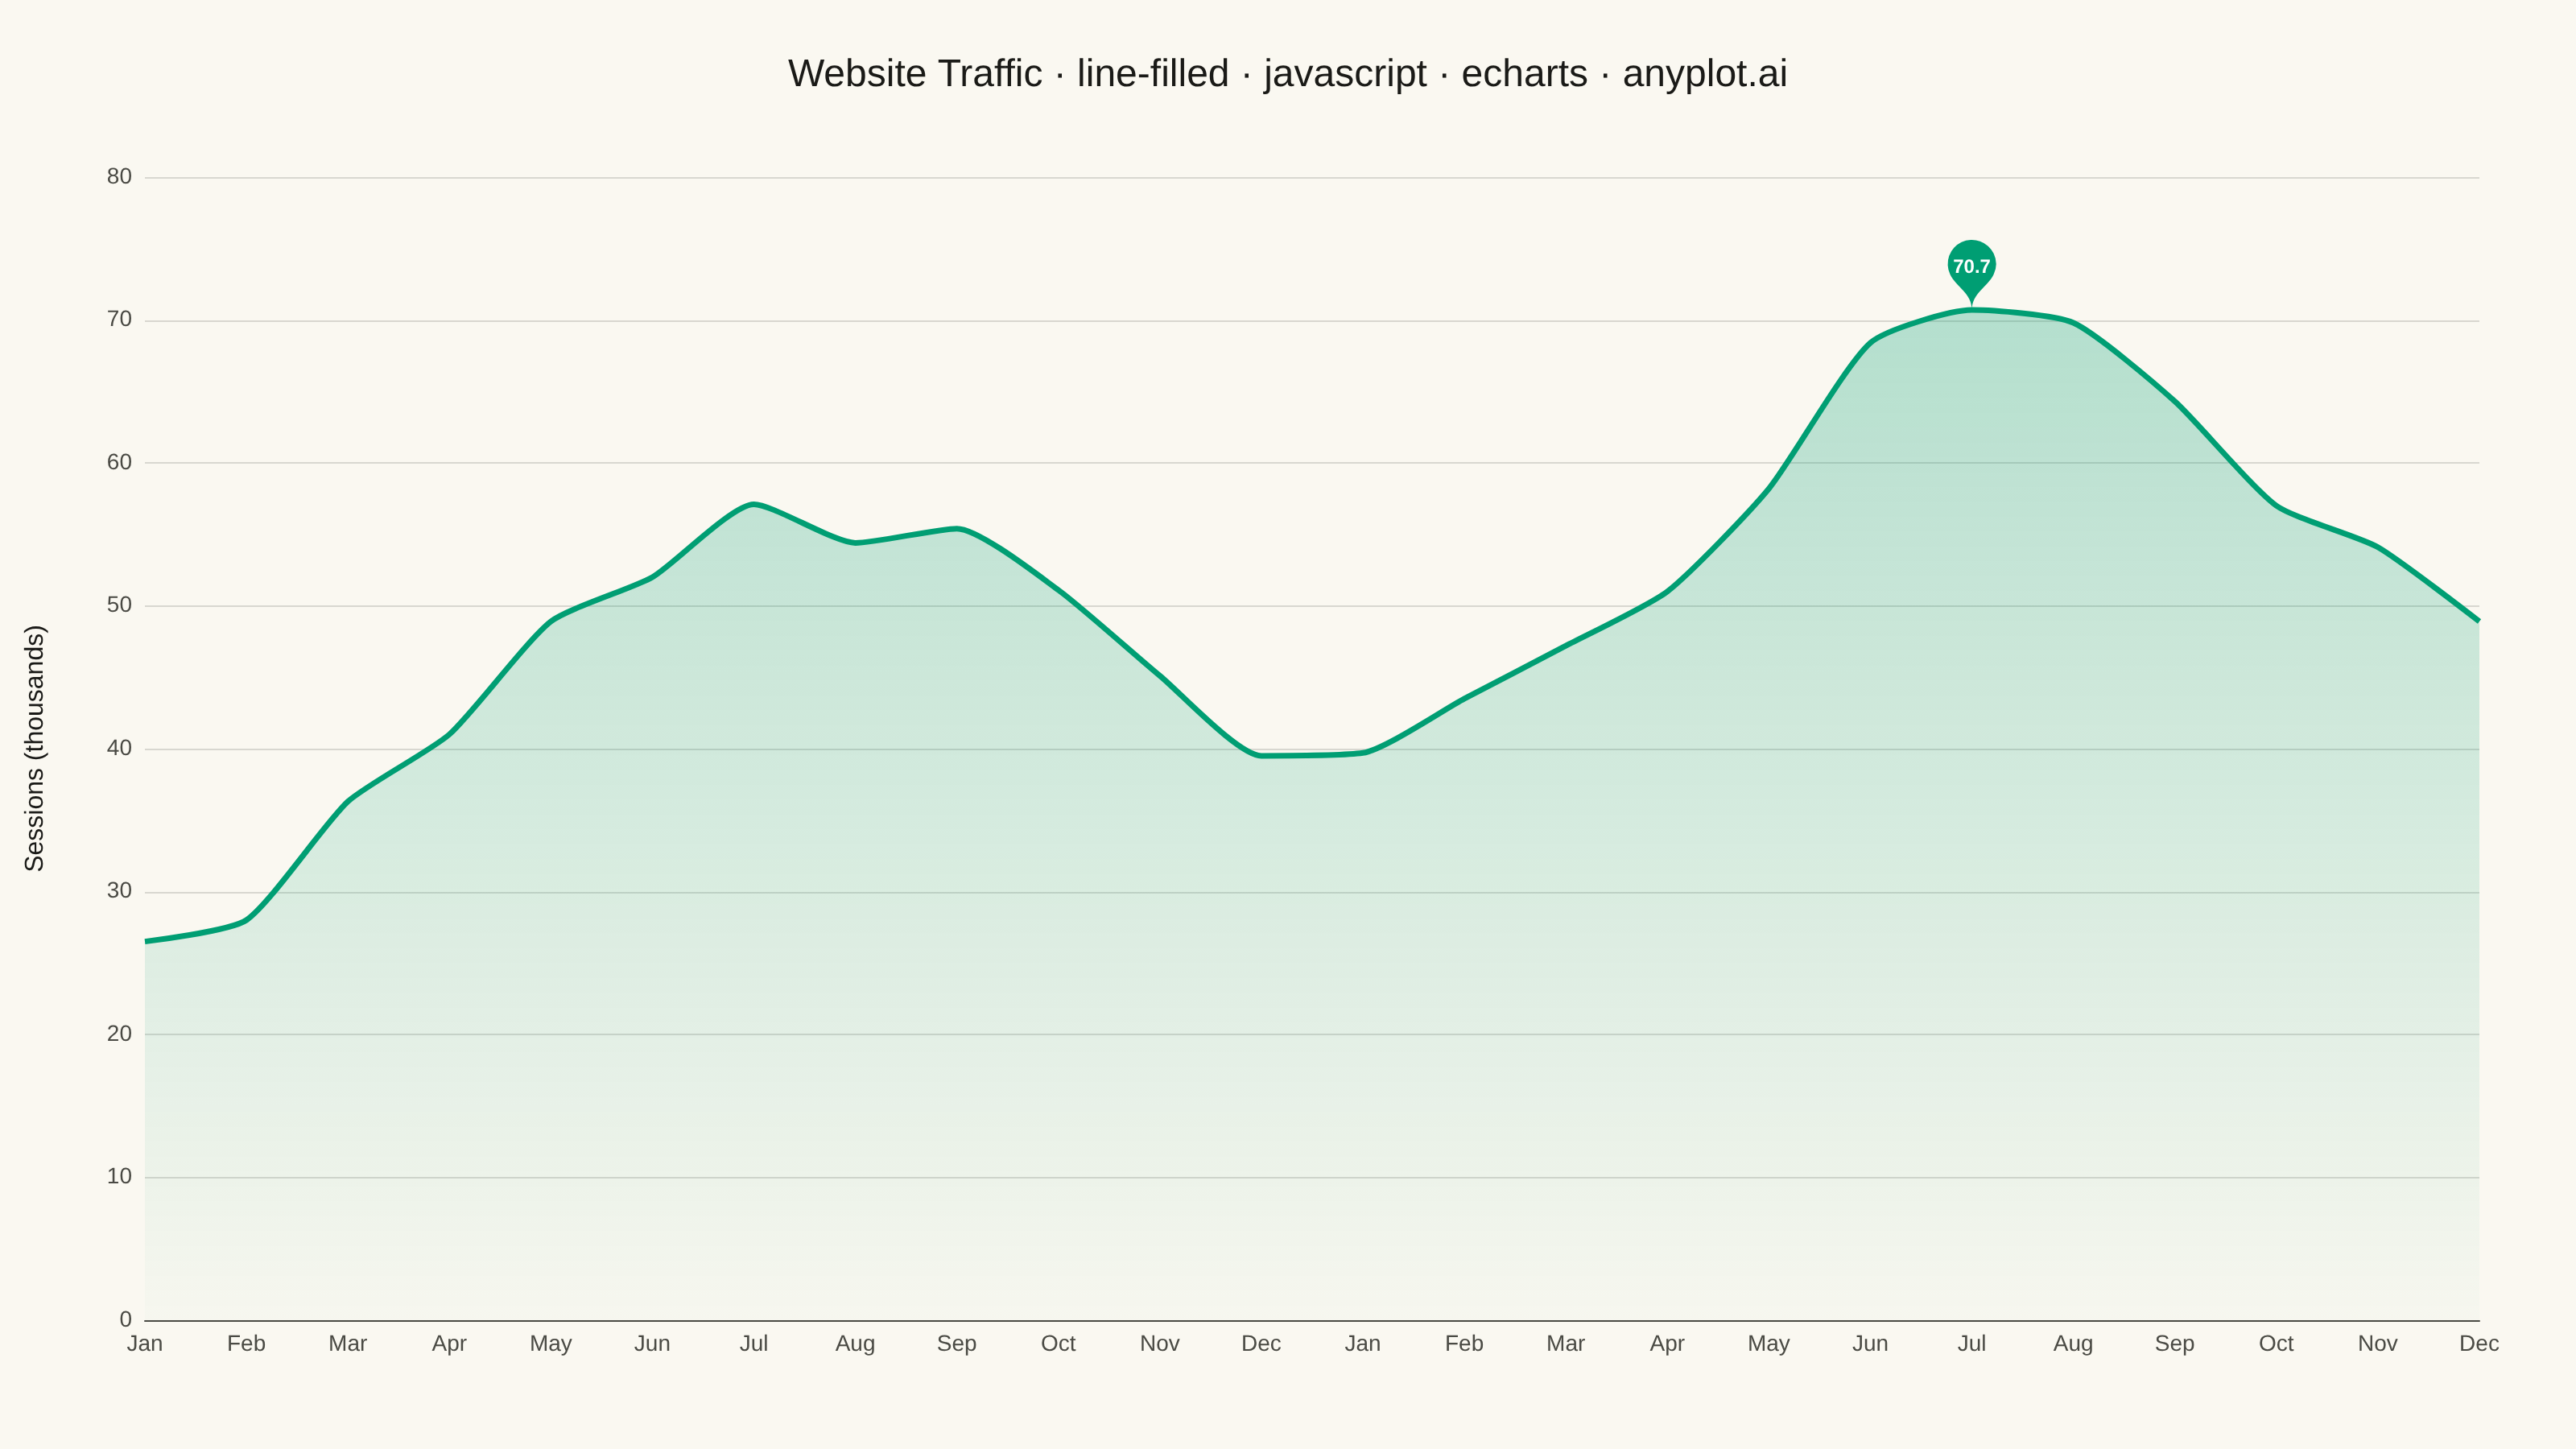
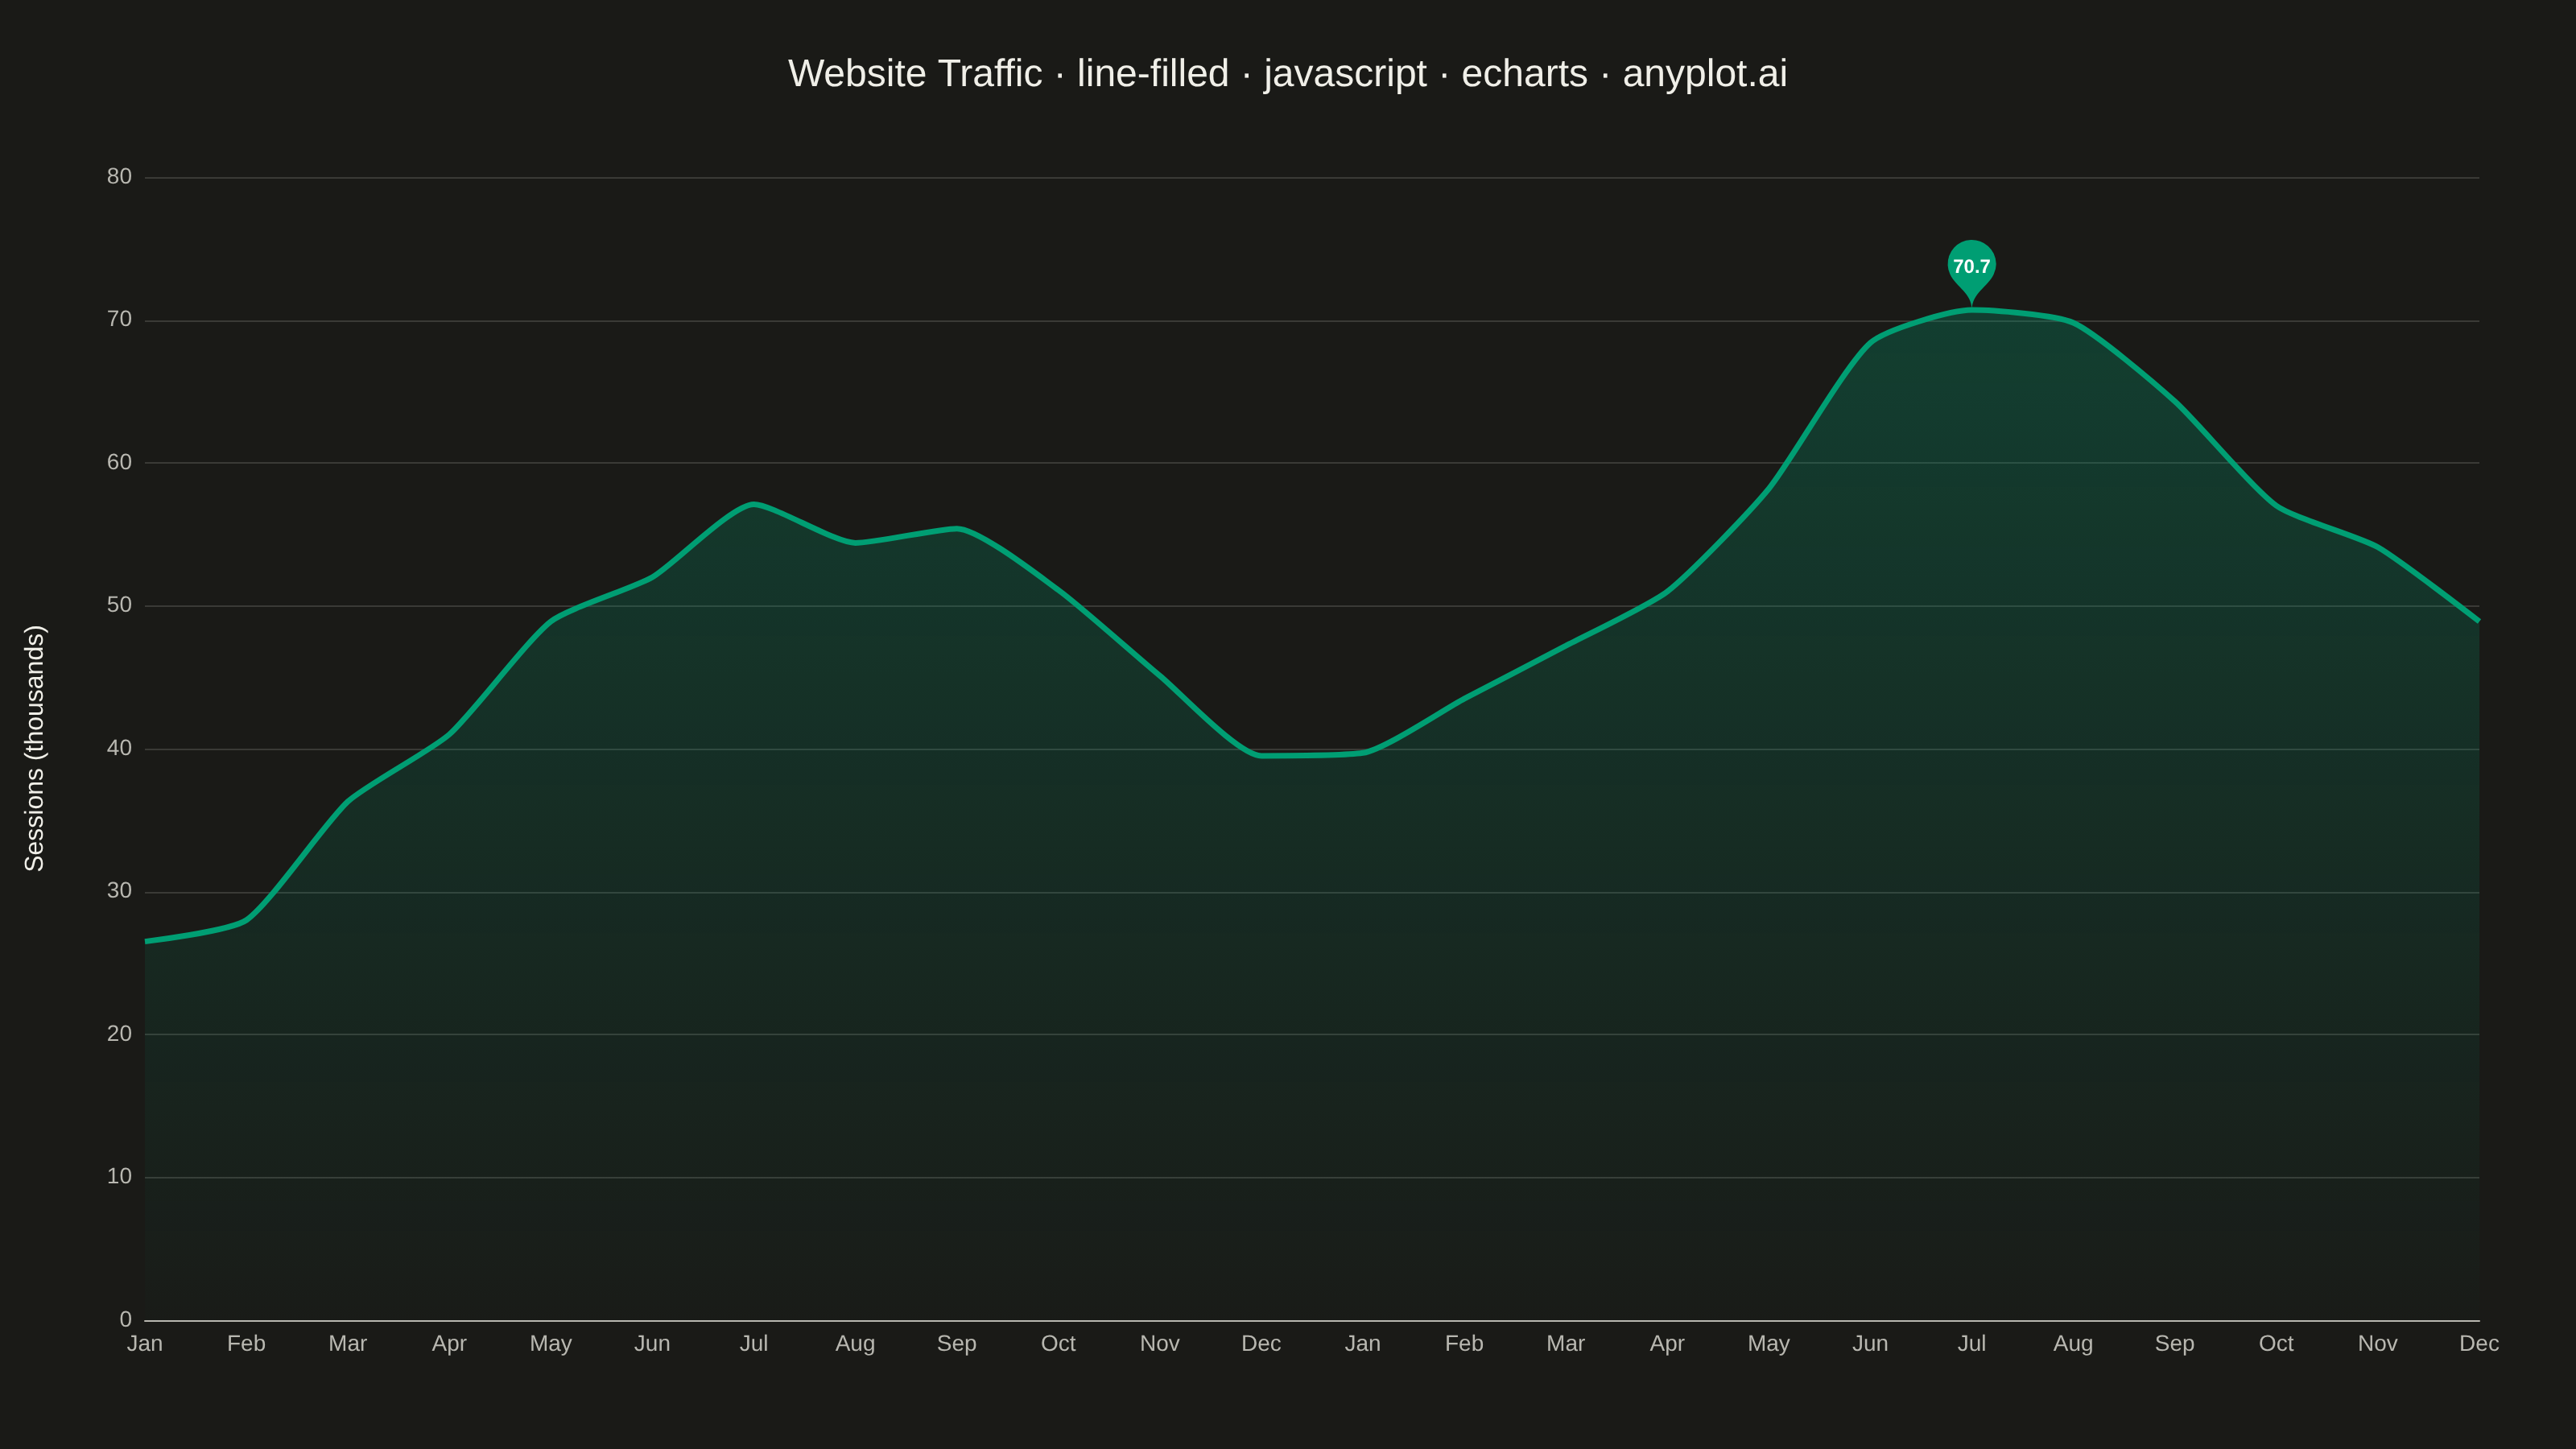
The same plot in 14 other libraries — JavaScript: Chart.js, D3.js, Highcharts, MUI X Charts; Python: Altair, Bokeh, lets-plot, Matplotlib, Plotly, plotnine, Pygal, Seaborn; R: ggplot2; Julia: Makie.jl. Compare all 15 side by side: Filled Line Plot in Python, R, Julia and JavaScript.
A line plot with the area between the line and the baseline (typically x-axis) filled with a semi-transparent color. This creates an area chart effect for a single series, emphasizing the magnitude of values.
// anyplot.ai
// line-filled: Filled Line Plot
// Library: echarts 6.1.0 | JavaScript 22.23.2
// Quality: 90/100 | Created: 2026-09-05

const t = window.ANYPLOT_TOKENS;

// --- Data (in-memory, deterministic) ----------------------------------------
// Monthly website traffic (thousands of sessions) over two years.
const months = [
  "Jan", "Feb", "Mar", "Apr", "May", "Jun",
  "Jul", "Aug", "Sep", "Oct", "Nov", "Dec",
  "Jan", "Feb", "Mar", "Apr", "May", "Jun",
  "Jul", "Aug", "Sep", "Oct", "Nov", "Dec",
];

function lcg(seed) {
  let state = seed;
  return () => {
    state = (state * 1664525 + 1013904223) % 4294967296;
    return state / 4294967296;
  };
}
const rand = lcg(42);

let sessions = 40;
const traffic = months.map((_, i) => {
  const seasonal = 12 * Math.sin((i / 12) * Math.PI * 2 - Math.PI / 2);
  const trend = i * 0.9;
  const noise = (rand() - 0.5) * 6;
  sessions = 40 + trend + seasonal + noise;
  return Math.round(Math.max(sessions, 5) * 10) / 10;
});

// --- Init --------------------------------------------------------------------
const chart = echarts.init(document.getElementById("container"));

// --- Option --------------------------------------------------------------------
chart.setOption({
  animation: false,
  color: t.palette,
  backgroundColor: "transparent",
  title: {
    text: "Website Traffic · line-filled · javascript · echarts · anyplot.ai",
    left: "center",
    top: 30,
    textStyle: { color: t.ink, fontSize: 24, fontWeight: 500 },
  },
  grid: { left: 90, right: 60, top: 110, bottom: 80 },
  xAxis: {
    type: "category",
    data: months,
    boundaryGap: false,
    axisLabel: { color: t.inkSoft, fontSize: 14 },
    axisLine: { lineStyle: { color: t.inkSoft } },
    axisTick: { show: false },
    splitLine: { show: false },
  },
  yAxis: {
    type: "value",
    name: "Sessions (thousands)",
    nameLocation: "middle",
    nameGap: 60,
    nameTextStyle: { color: t.ink, fontSize: 16 },
    axisLabel: { color: t.inkSoft, fontSize: 14 },
    axisLine: { show: false },
    axisTick: { show: false },
    splitLine: { lineStyle: { color: t.grid } },
  },
  series: [
    {
      type: "line",
      data: traffic,
      showSymbol: false,
      smooth: 0.2,
      lineStyle: { width: 3.5, color: t.palette[0] },
      areaStyle: {
        color: new echarts.graphic.LinearGradient(0, 0, 0, 1, [
          { offset: 0, color: "rgba(0, 158, 115, 0.4)" },
          { offset: 1, color: "rgba(0, 158, 115, 0.02)" },
        ]),
      },
      markPoint: {
        symbolSize: 50,
        itemStyle: { color: t.palette[0] },
        label: { color: "#FFFFFF", fontSize: 12, fontWeight: 600 },
        data: [{ type: "max", name: "Peak" }],
      },
    },
  ],
});
Runnable source as JSON, for any HTTP client: https://api.anyplot.ai/specs/line-filled/echarts/code. Any spec id and library id listed in llms-full.txt fit the same URL shape; every URL below is complete and callable.
{
  "spec_id": "line-filled",
  "language": "javascript",
  "library": "echarts",
  "page": "https://anyplot.ai/line-filled/javascript/echarts",
  "hub": "https://anyplot.ai/line-filled",
  "code_json": "https://api.anyplot.ai/specs/line-filled/echarts/code",
  "spec_json": "https://api.anyplot.ai/specs/line-filled",
  "render_light_png": "https://storage.googleapis.com/anyplot-images/plots/line-filled/javascript/echarts/plot-light.png",
  "render_dark_png": "https://storage.googleapis.com/anyplot-images/plots/line-filled/javascript/echarts/plot-dark.png",
  "interactive_light_html": "https://storage.googleapis.com/anyplot-images/plots/line-filled/javascript/echarts/plot-light.html",
  "interactive_dark_html": "https://storage.googleapis.com/anyplot-images/plots/line-filled/javascript/echarts/plot-dark.html",
  "quality_score": 90.0,
  "license": "MIT",
  "guide": "https://anyplot.ai/llms.txt"
}
Part of Filled Line Plot on anyplot.ai.