The same plot in 14 other libraries — JavaScript: Chart.js, D3.js, Apache ECharts, Highcharts; Python: Altair, Bokeh, lets-plot, Matplotlib, Plotly, plotnine, Pygal, Seaborn; R: ggplot2; Julia: Makie.jl. Compare all 15 side by side: Filled Line Plot in Python, R, Julia and JavaScript.
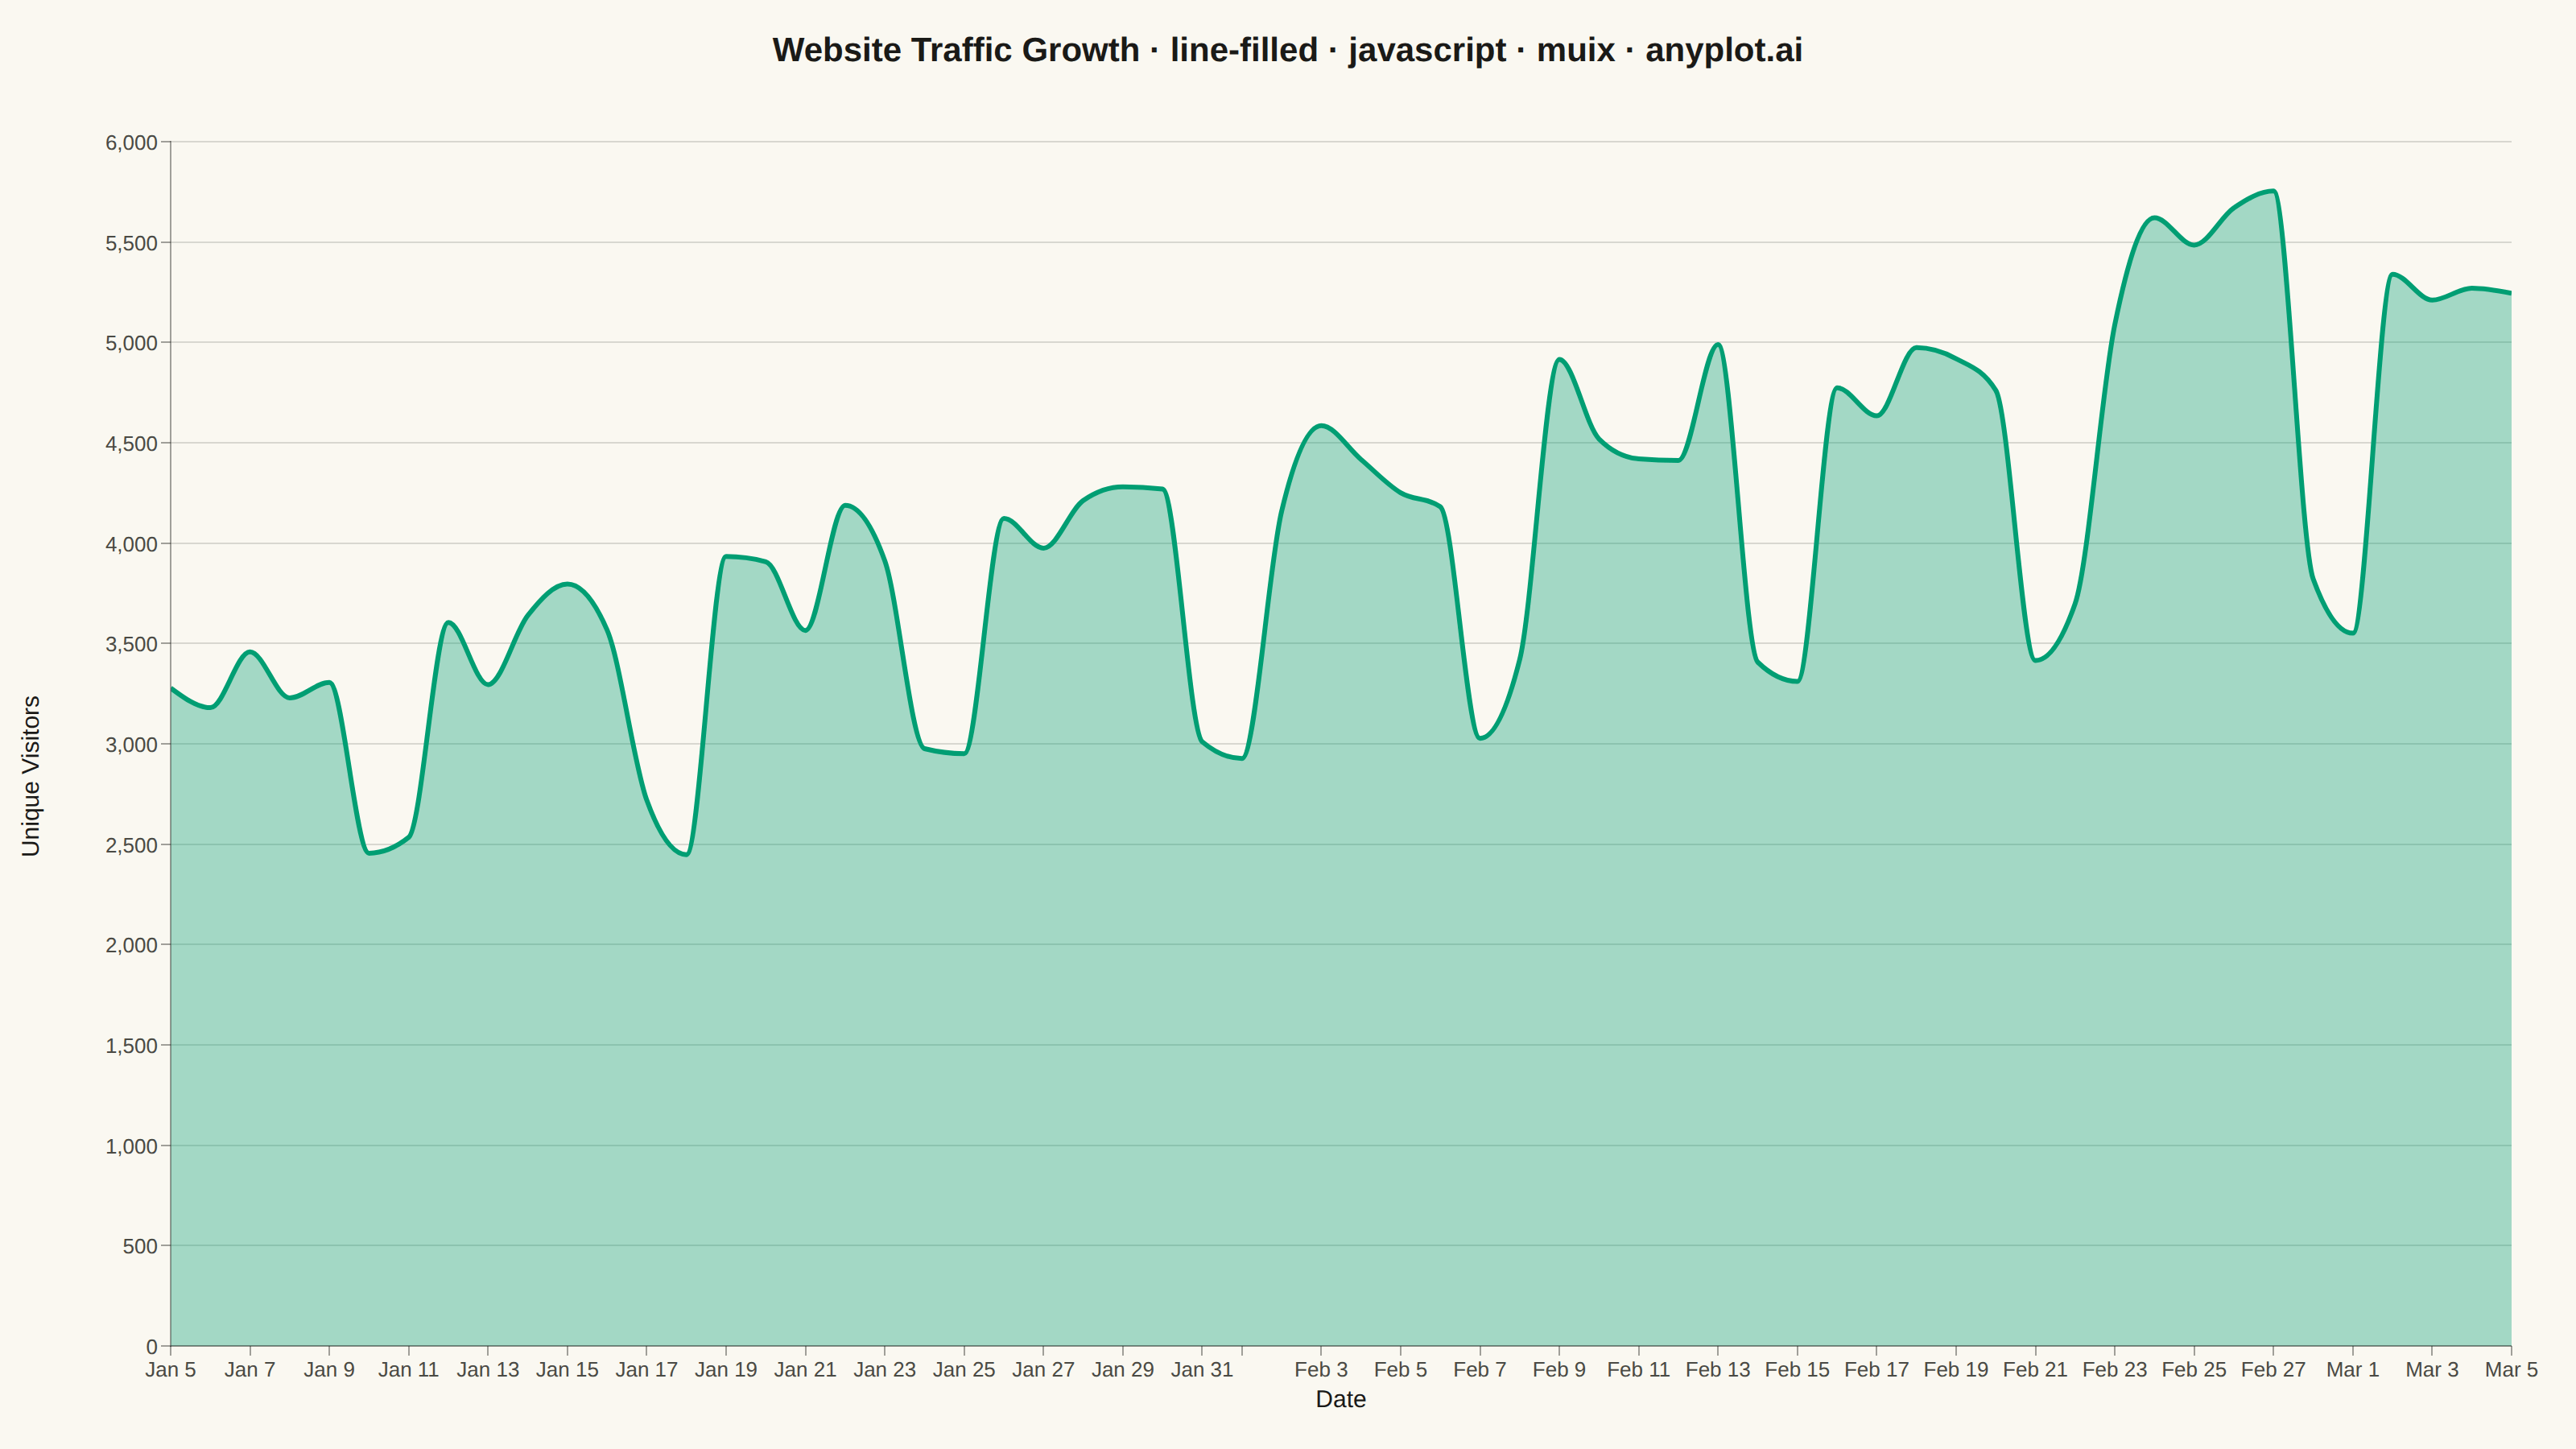
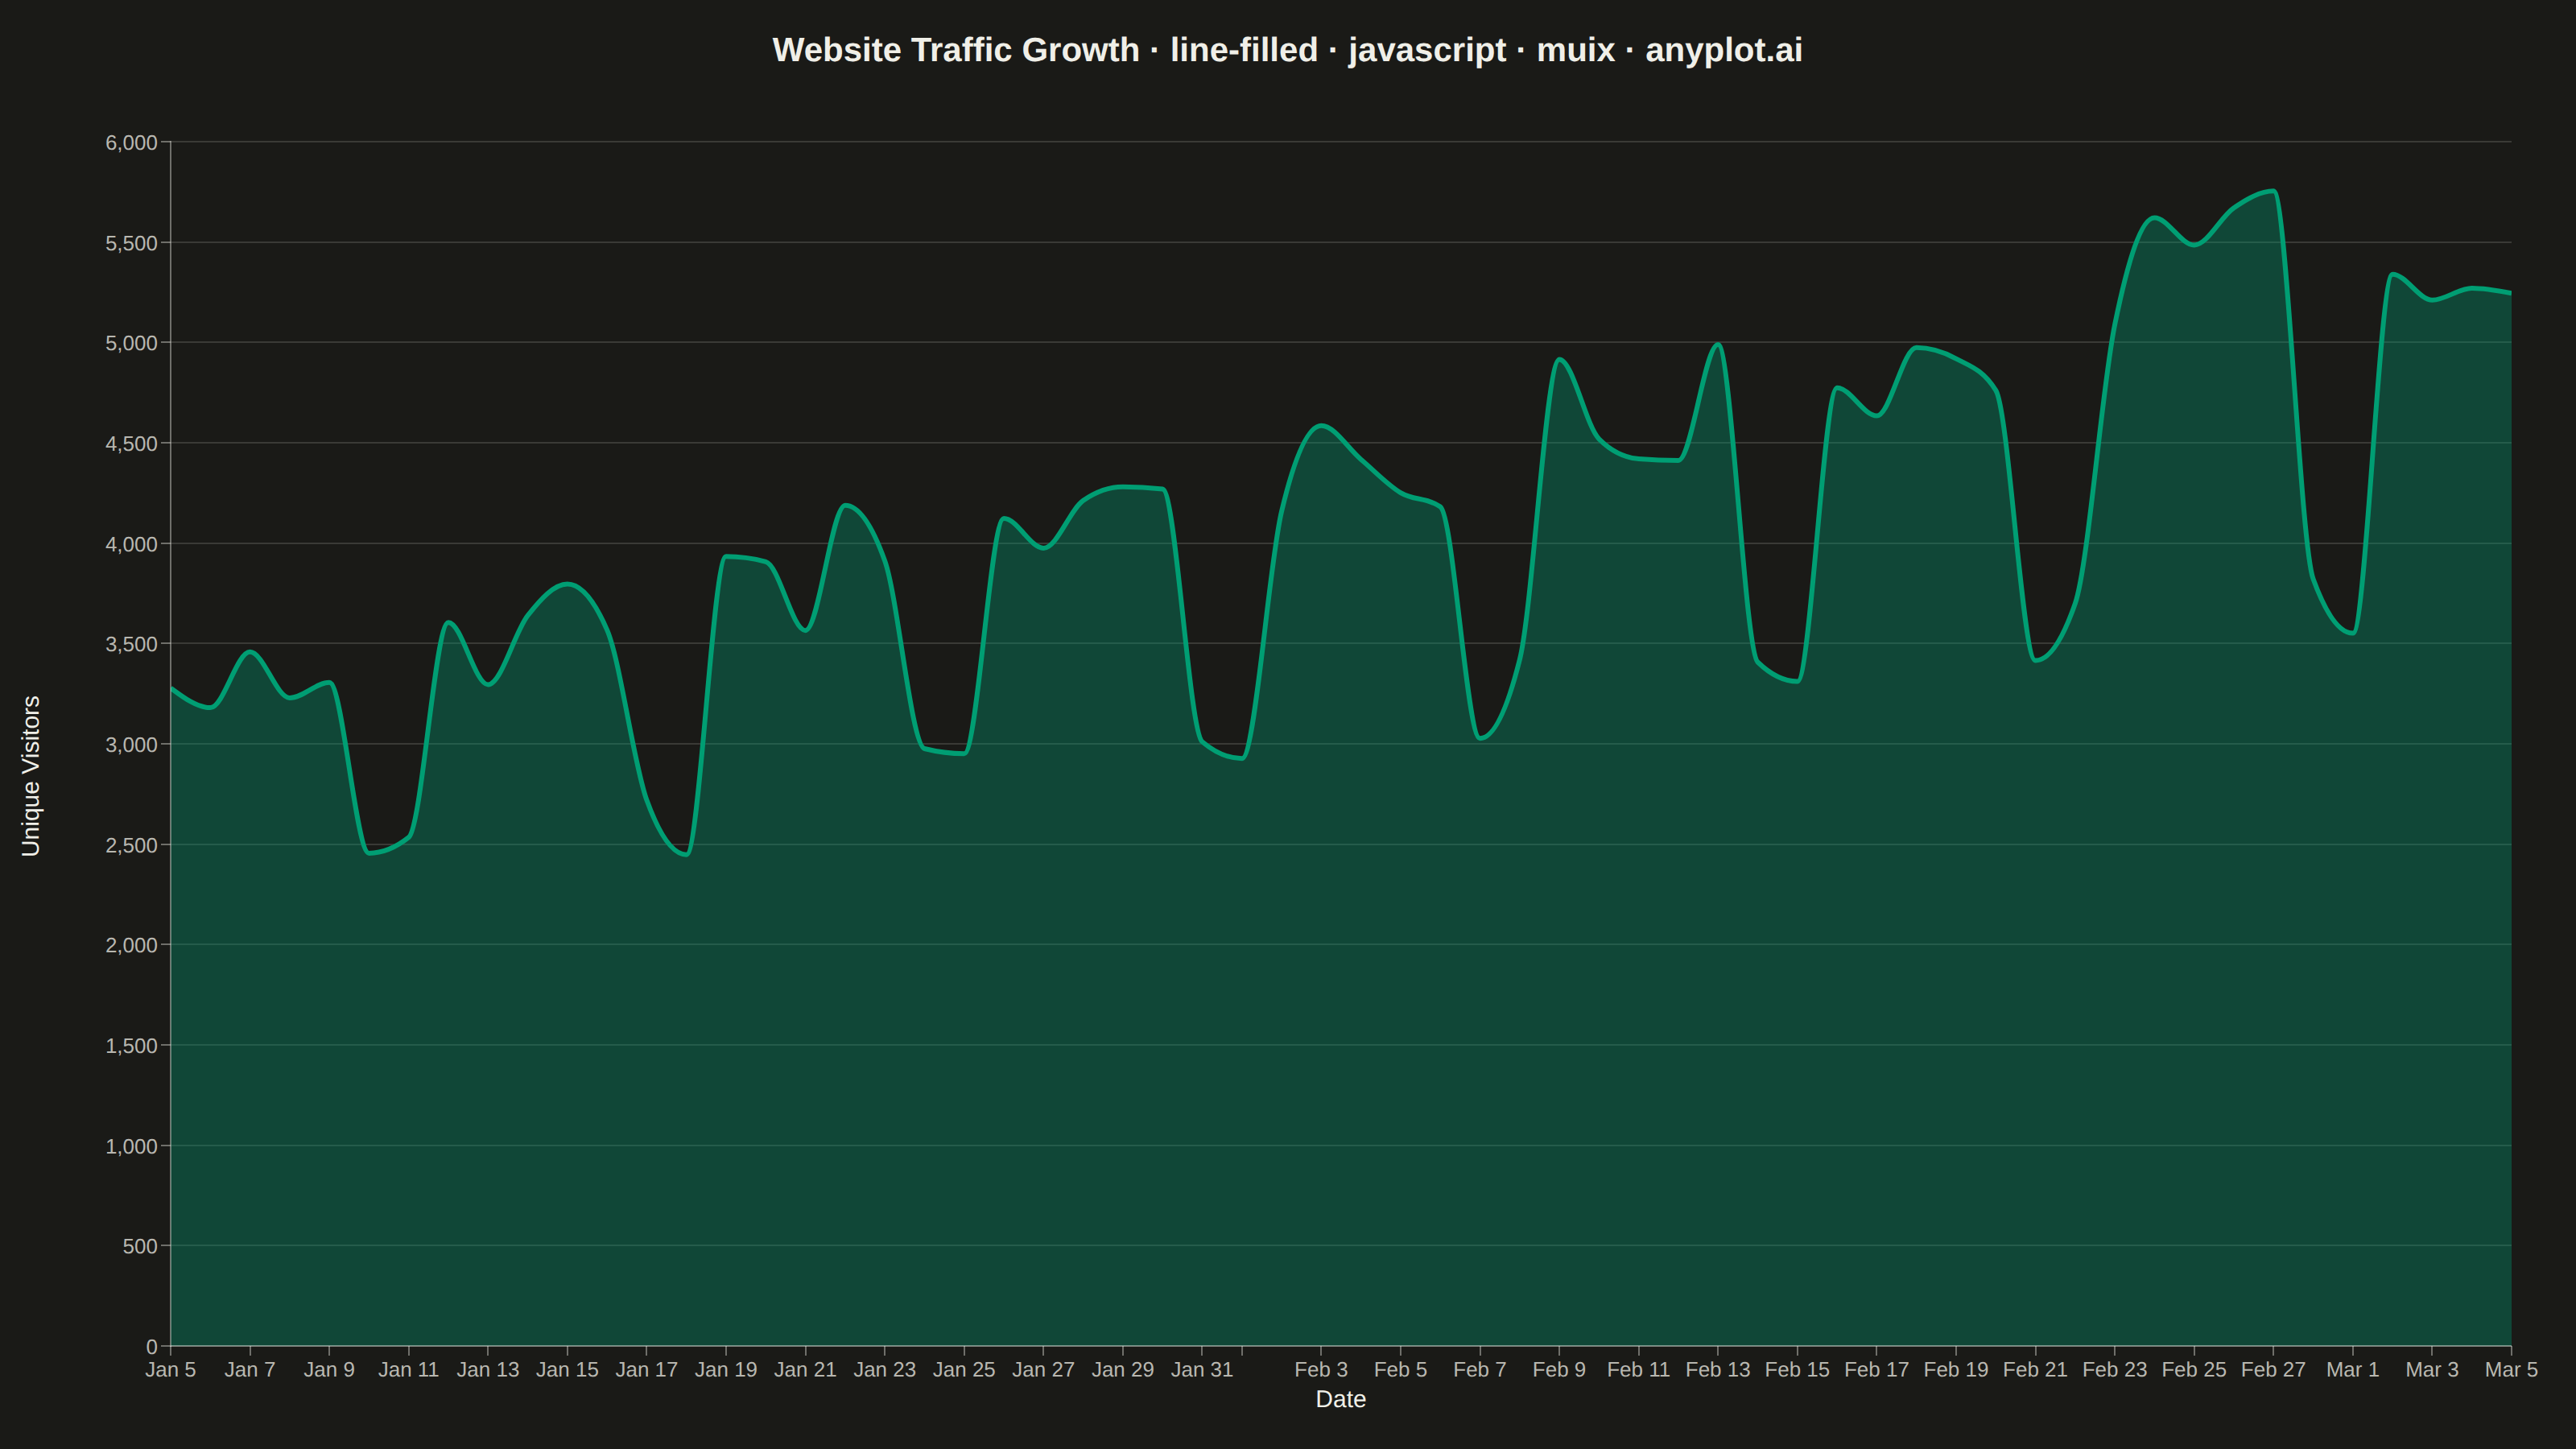
A line plot with the area between the line and the baseline (typically x-axis) filled with a semi-transparent color. This creates an area chart effect for a single series, emphasizing the magnitude of values.
// anyplot.ai
// line-filled: Filled Line Plot
// Library: muix 7.29.1 | JavaScript 22.23.2
// Quality: 84/100 | Created: 2026-09-05
import { LineChart } from "@mui/x-charts/LineChart";
import { ChartsReferenceLine } from "@mui/x-charts/ChartsReferenceLine";
import Box from "@mui/material/Box";
import Typography from "@mui/material/Typography";

const t = window.ANYPLOT_TOKENS;

// --- Data (in-memory, deterministic LCG PRNG — no fetch, no Math.random) ----
let seed = 11;
function rand() {
  seed = (seed * 1103515245 + 12345) & 0x7fffffff;
  return seed / 0x7fffffff;
}

const DAYS = 60;
const startDate = new Date(2026, 0, 5); // Mon Jan 5, 2026
const dates: Date[] = [];
const visitors: number[] = [];
const baseVisitors = 3200; // pre-launch daily unique visitors
const dailyGrowth = 0.013; // sustained lift from a content-marketing push

for (let i = 0; i < DAYS; i++) {
  const date = new Date(startDate);
  date.setDate(startDate.getDate() + i);
  dates.push(date);

  const weekday = date.getDay();
  const weekendDip = weekday === 0 || weekday === 6 ? 0.7 : 1;
  const trend = 1 + i * dailyGrowth;
  const noise = 1 + (rand() - 0.5) * 0.16;
  visitors.push(Math.round(baseVisitors * trend * weekendDip * noise));
}
const avgVisitors = Math.round(visitors.reduce((sum, v) => sum + v, 0) / visitors.length);

const TITLE = "Website Traffic Growth · line-filled · javascript · muix · anyplot.ai";

// --- Chart (default-exported component — the harness mounts it) -----------
export default function Chart() {
  const W = window.ANYPLOT_SIZE.width;
  const H = window.ANYPLOT_SIZE.height;
  const titleSize = TITLE.length > 67 ? Math.max(14, Math.round((22 * 67) / TITLE.length)) : 22;

  const TITLE_H = 64;
  const chartH = H - TITLE_H;
  // MUI X's y-axis `label` offsets itself from a hardcoded tickFontSize guess
  // rather than the tick labels' real measured width, so a 4-digit tick
  // ("3,000") collides with it. A hand-rotated label in its own flex column
  // sidesteps that and gives predictable, collision-free spacing.
  const yLabelWidth = 40;
  const chartW = W - yLabelWidth;

  return (
    <Box
      sx={{
        width: W,
        height: H,
        bgcolor: t.pageBg,
        display: "flex",
        flexDirection: "column",
        fontFamily: "'Roboto', 'Helvetica Neue', Arial, sans-serif",
        boxSizing: "border-box",
      }}
    >
      <Box sx={{ height: TITLE_H, display: "flex", alignItems: "center", justifyContent: "center" }}>
        <Typography sx={{ color: t.ink, fontSize: titleSize, fontWeight: 600 }}>{TITLE}</Typography>
      </Box>

      <Box sx={{ display: "flex", flexDirection: "row", height: chartH }}>
        <Box sx={{ width: yLabelWidth, display: "flex", alignItems: "center", justifyContent: "center" }}>
          <Typography sx={{ fontSize: 15, color: t.ink, whiteSpace: "nowrap", transform: "rotate(-90deg)" }}>
            Unique Visitors
          </Typography>
        </Box>

        <LineChart
          width={chartW}
          height={chartH}
          skipAnimation
          series={[
            {
              id: "visitors",
              data: visitors,
              showMark: false,
              area: true,
              color: t.palette[0],
              curve: "monotoneX",
              valueFormatter: (v: number | null) => (v == null ? "" : `${v.toLocaleString("en-US")} visitors`),
            },
          ]}
          xAxis={[
            {
              data: dates,
              scaleType: "time",
              label: "Date",
              valueFormatter: (d: Date) => d.toLocaleDateString("en-US", { month: "short", day: "numeric" }),
              tickLabelStyle: { fontSize: 13, fill: t.inkSoft },
              labelStyle: { fontSize: 15, fill: t.ink },
            },
          ]}
          yAxis={[
            {
              valueFormatter: (v: number) => v.toLocaleString("en-US"),
              tickLabelStyle: { fontSize: 13, fill: t.inkSoft },
            },
          ]}
          grid={{ horizontal: true }}
          slotProps={{ legend: { hidden: true } }}
          margin={{ top: 24, right: 40, bottom: 64, left: 66 }}
          sx={{
            "& .MuiLineElement-root": { strokeWidth: 3 },
            "& .MuiAreaElement-series-visitors": { fill: "url(#visitorsFillGradient)" },
            "& .MuiChartsAxis-line": { stroke: t.inkSoft, strokeOpacity: 0.4 },
            "& .MuiChartsAxis-tick": { stroke: t.inkSoft, strokeOpacity: 0.4 },
            "& .MuiChartsGrid-line": { stroke: t.grid },
          }}
        >
          <defs>
            <linearGradient id="visitorsFillGradient" x1="50%" y1="0%" x2="50%" y2="100%">
              <stop offset="5%" stopColor={t.palette[0]} stopOpacity={0.75} />
              <stop offset="95%" stopColor={t.palette[0]} stopOpacity={0.05} />
            </linearGradient>
          </defs>
          <ChartsReferenceLine
            y={avgVisitors}
            label={`Avg ${avgVisitors.toLocaleString("en-US")}`}
            labelAlign="end"
            lineStyle={{ stroke: t.inkSoft, strokeDasharray: "6 4", strokeOpacity: 0.7 }}
            labelStyle={{ fontSize: 12, fill: t.inkSoft }}
          />
        </LineChart>
      </Box>
    </Box>
  );
}
Runnable source as JSON, for any HTTP client: https://api.anyplot.ai/specs/line-filled/muix/code. Any spec id and library id listed in llms-full.txt fit the same URL shape; every URL below is complete and callable.
{
  "spec_id": "line-filled",
  "language": "javascript",
  "library": "muix",
  "page": "https://anyplot.ai/line-filled/javascript/muix",
  "hub": "https://anyplot.ai/line-filled",
  "code_json": "https://api.anyplot.ai/specs/line-filled/muix/code",
  "spec_json": "https://api.anyplot.ai/specs/line-filled",
  "render_light_png": "https://storage.googleapis.com/anyplot-images/plots/line-filled/javascript/muix/plot-light.png",
  "render_dark_png": "https://storage.googleapis.com/anyplot-images/plots/line-filled/javascript/muix/plot-dark.png",
  "interactive_light_html": "https://storage.googleapis.com/anyplot-images/plots/line-filled/javascript/muix/plot-light.html",
  "interactive_dark_html": "https://storage.googleapis.com/anyplot-images/plots/line-filled/javascript/muix/plot-dark.html",
  "quality_score": 84.0,
  "license": "MIT",
  "guide": "https://anyplot.ai/llms.txt"
}
Part of Filled Line Plot on anyplot.ai.