Source code in 15 libraries — Python: Altair, Bokeh, lets-plot, Matplotlib, Plotly, plotnine, Pygal, Seaborn; R: ggplot2; Julia: Makie.jl; JavaScript: Chart.js, D3.js, Apache ECharts, Highcharts, MUI X Charts.
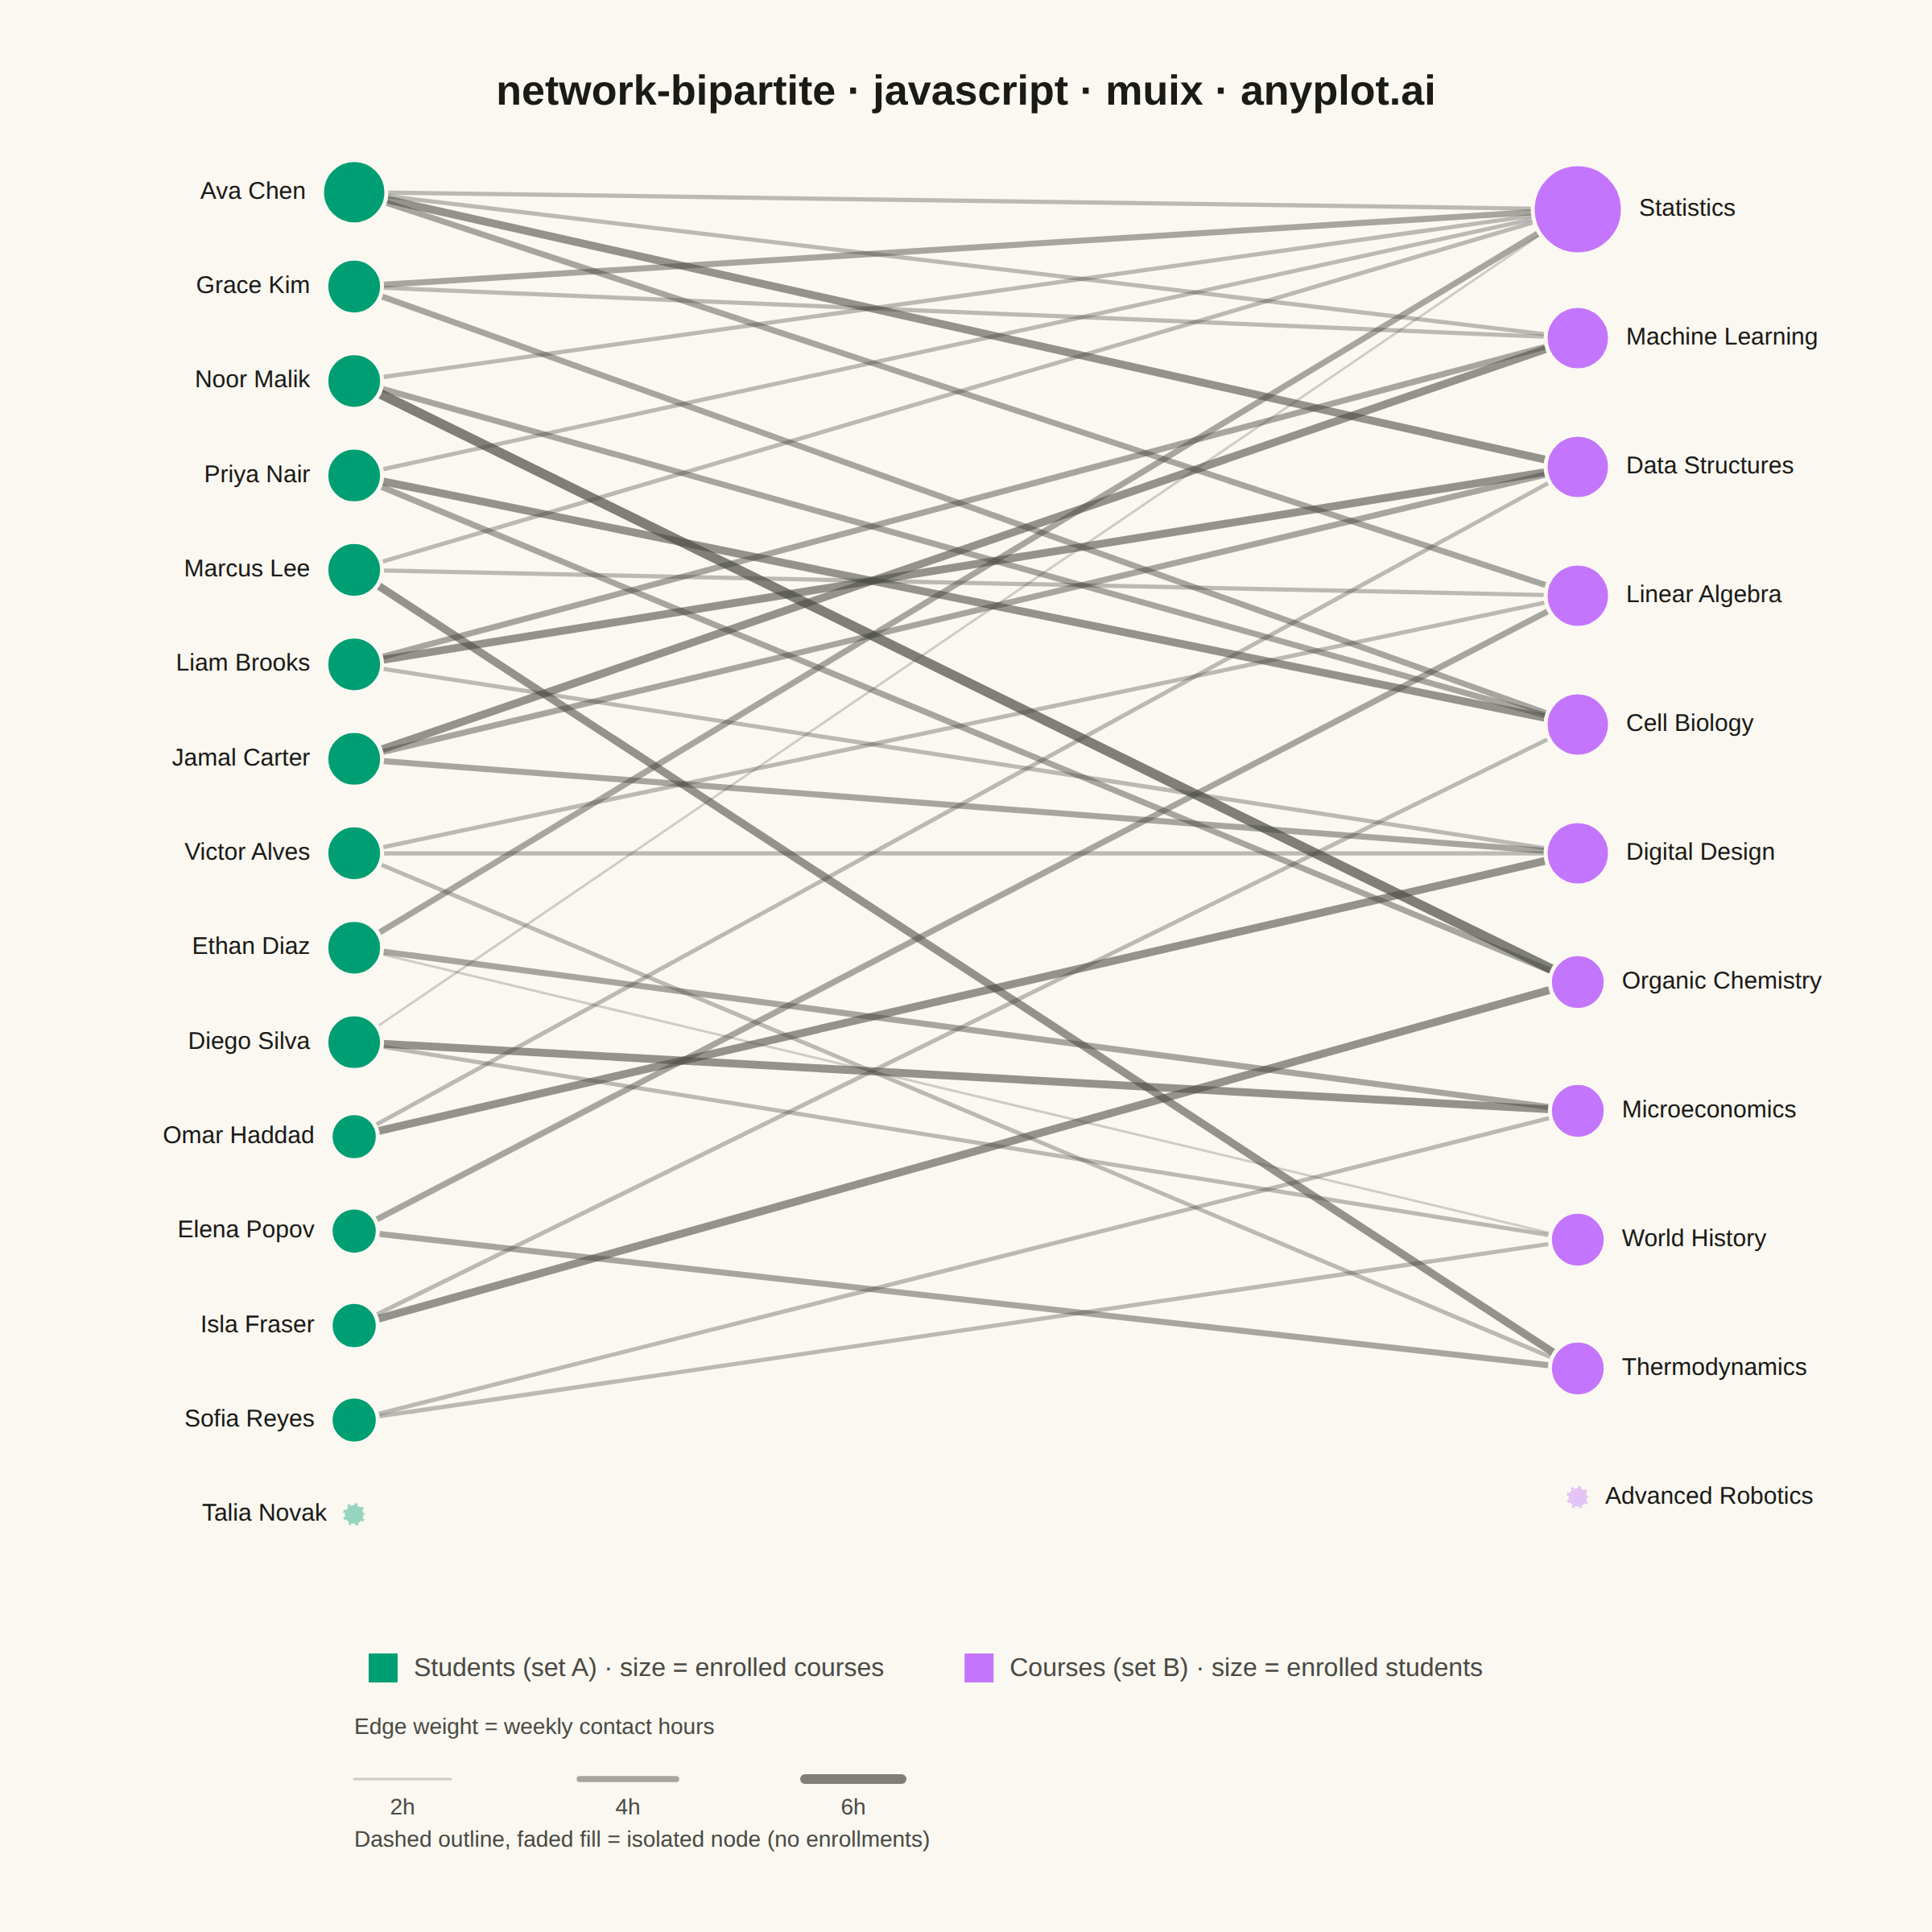
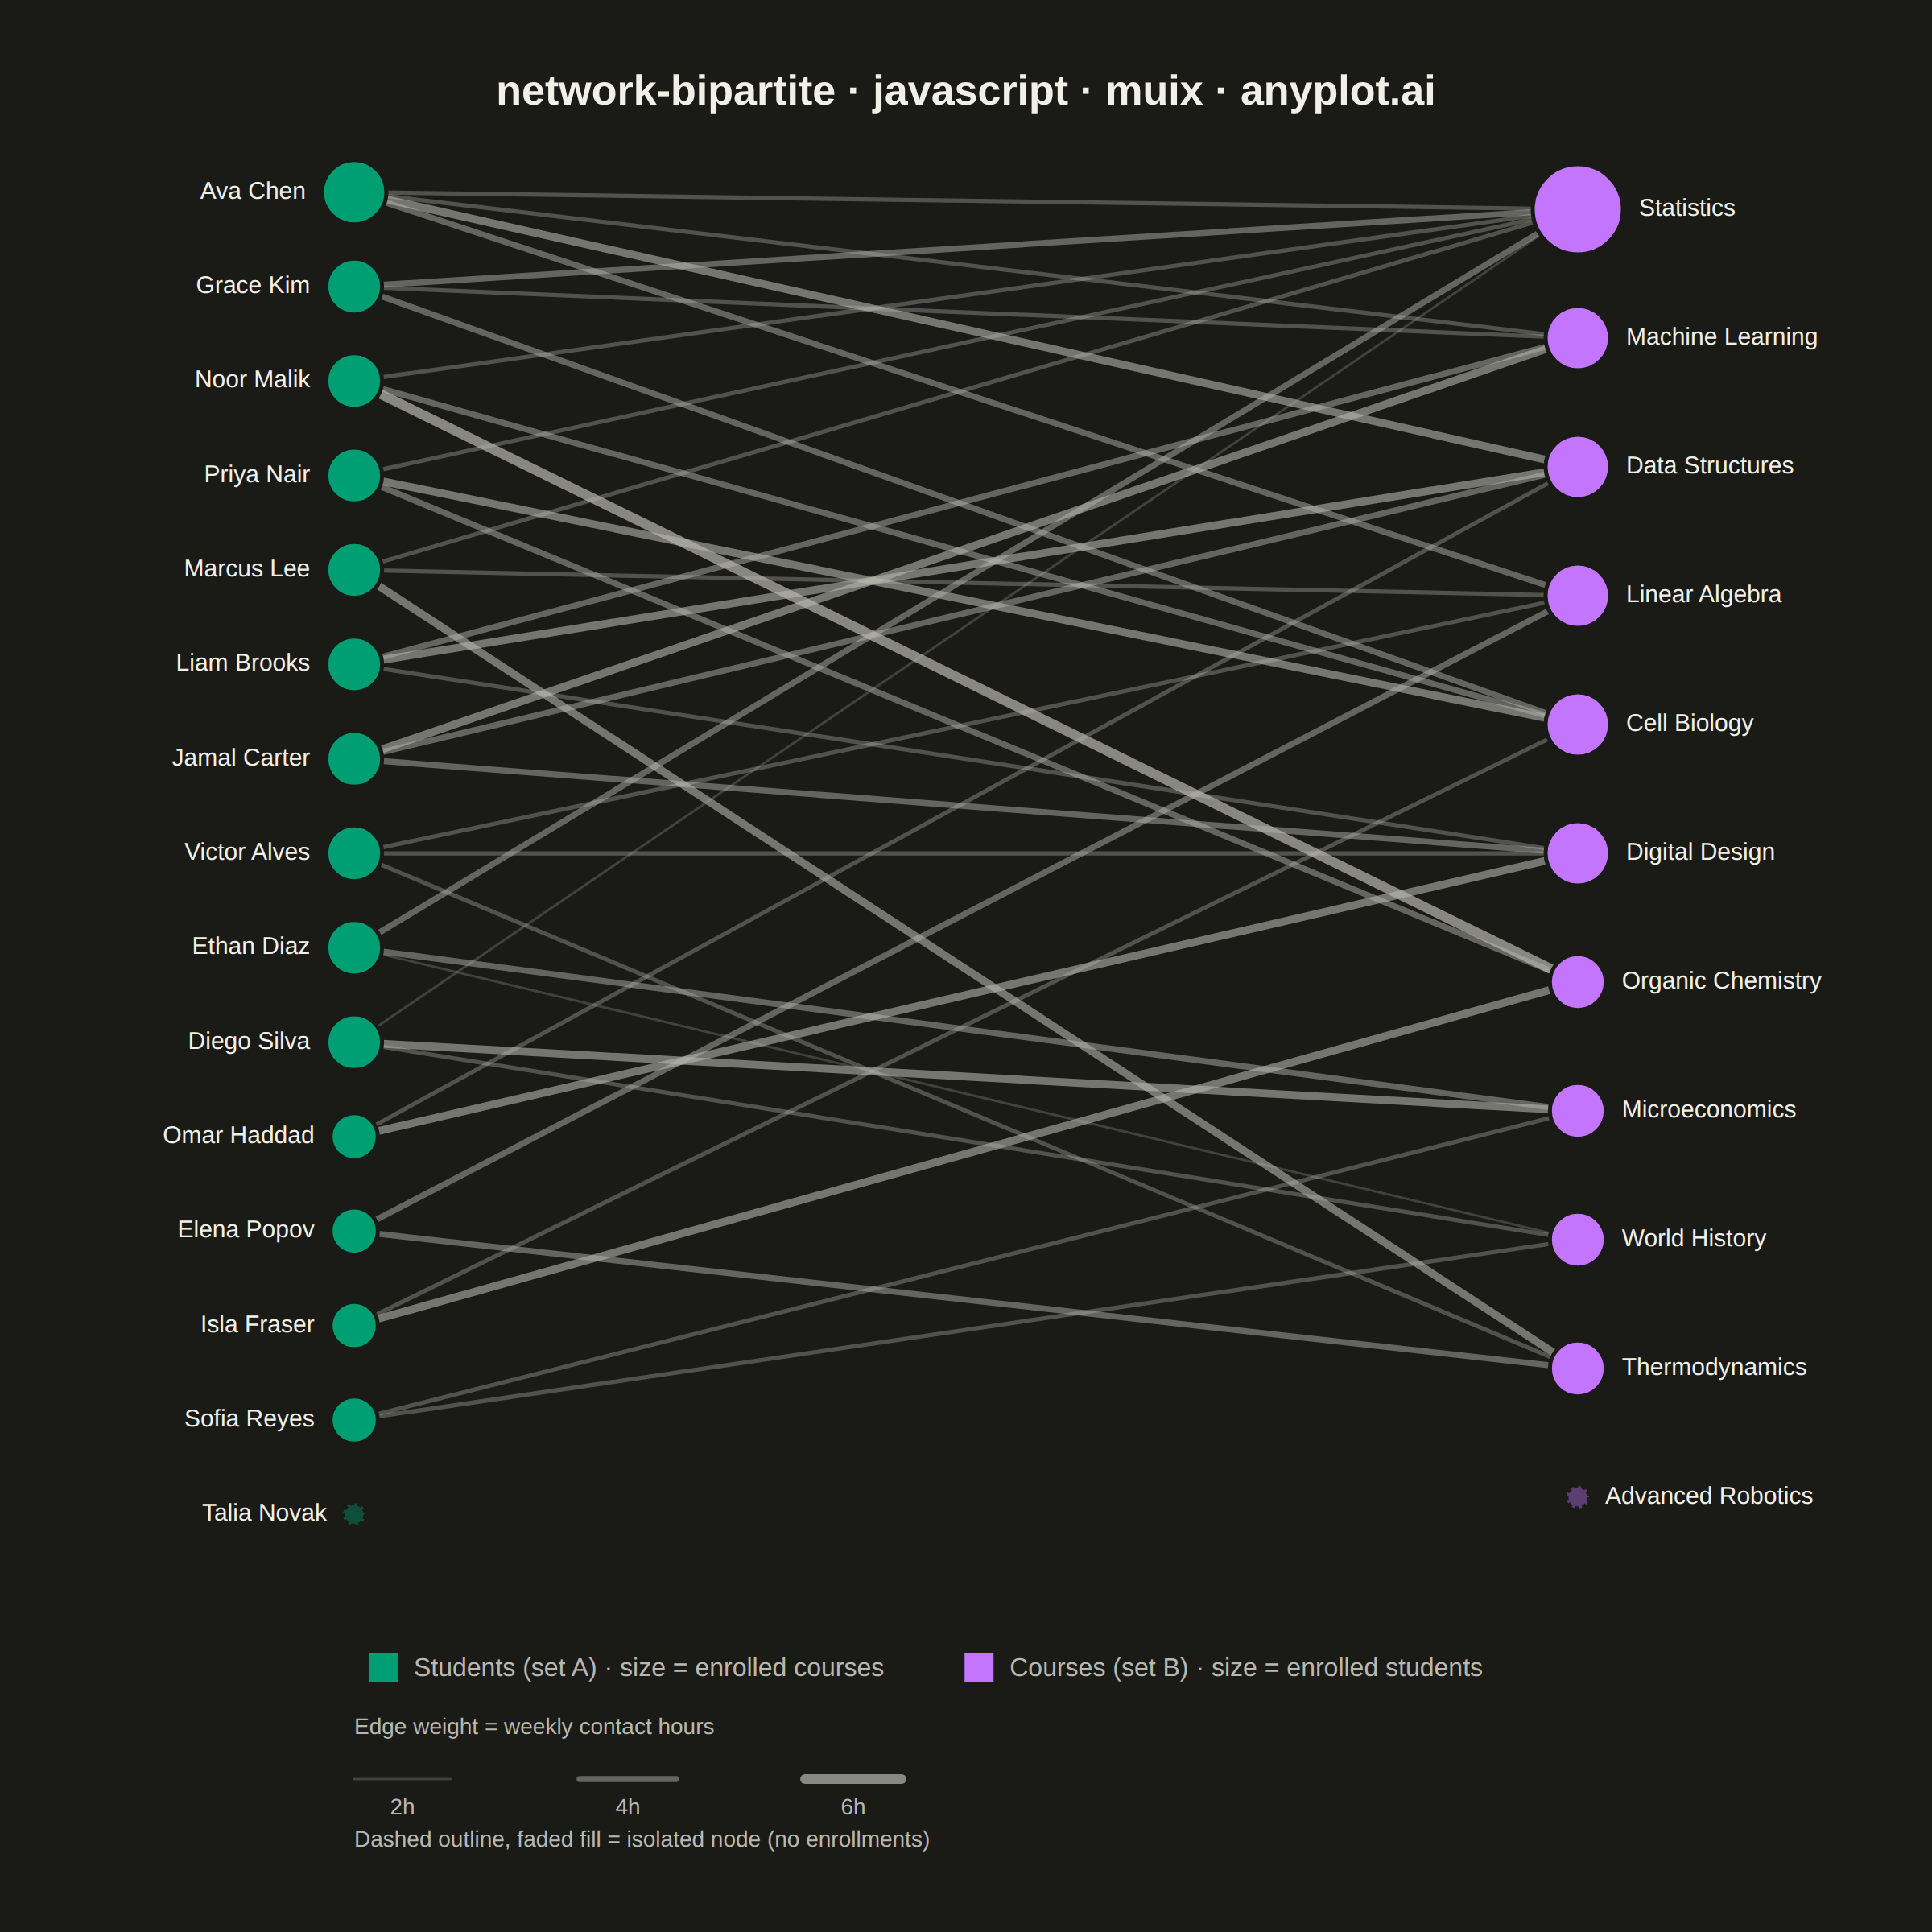
A bipartite network graph visualizes relationships between two distinct sets of entities, where edges only connect nodes from different sets — never within the same set. The two node groups are arranged in separate columns or rows, making the two-mode structure immediately apparent. This layout is fundamental for understanding cross-category relationships, revealing which entities from one set are linked to which entities in the other, and exposing patterns like hubs, clusters, and isolated nodes.
Preview render from the MUI X Charts implementation.