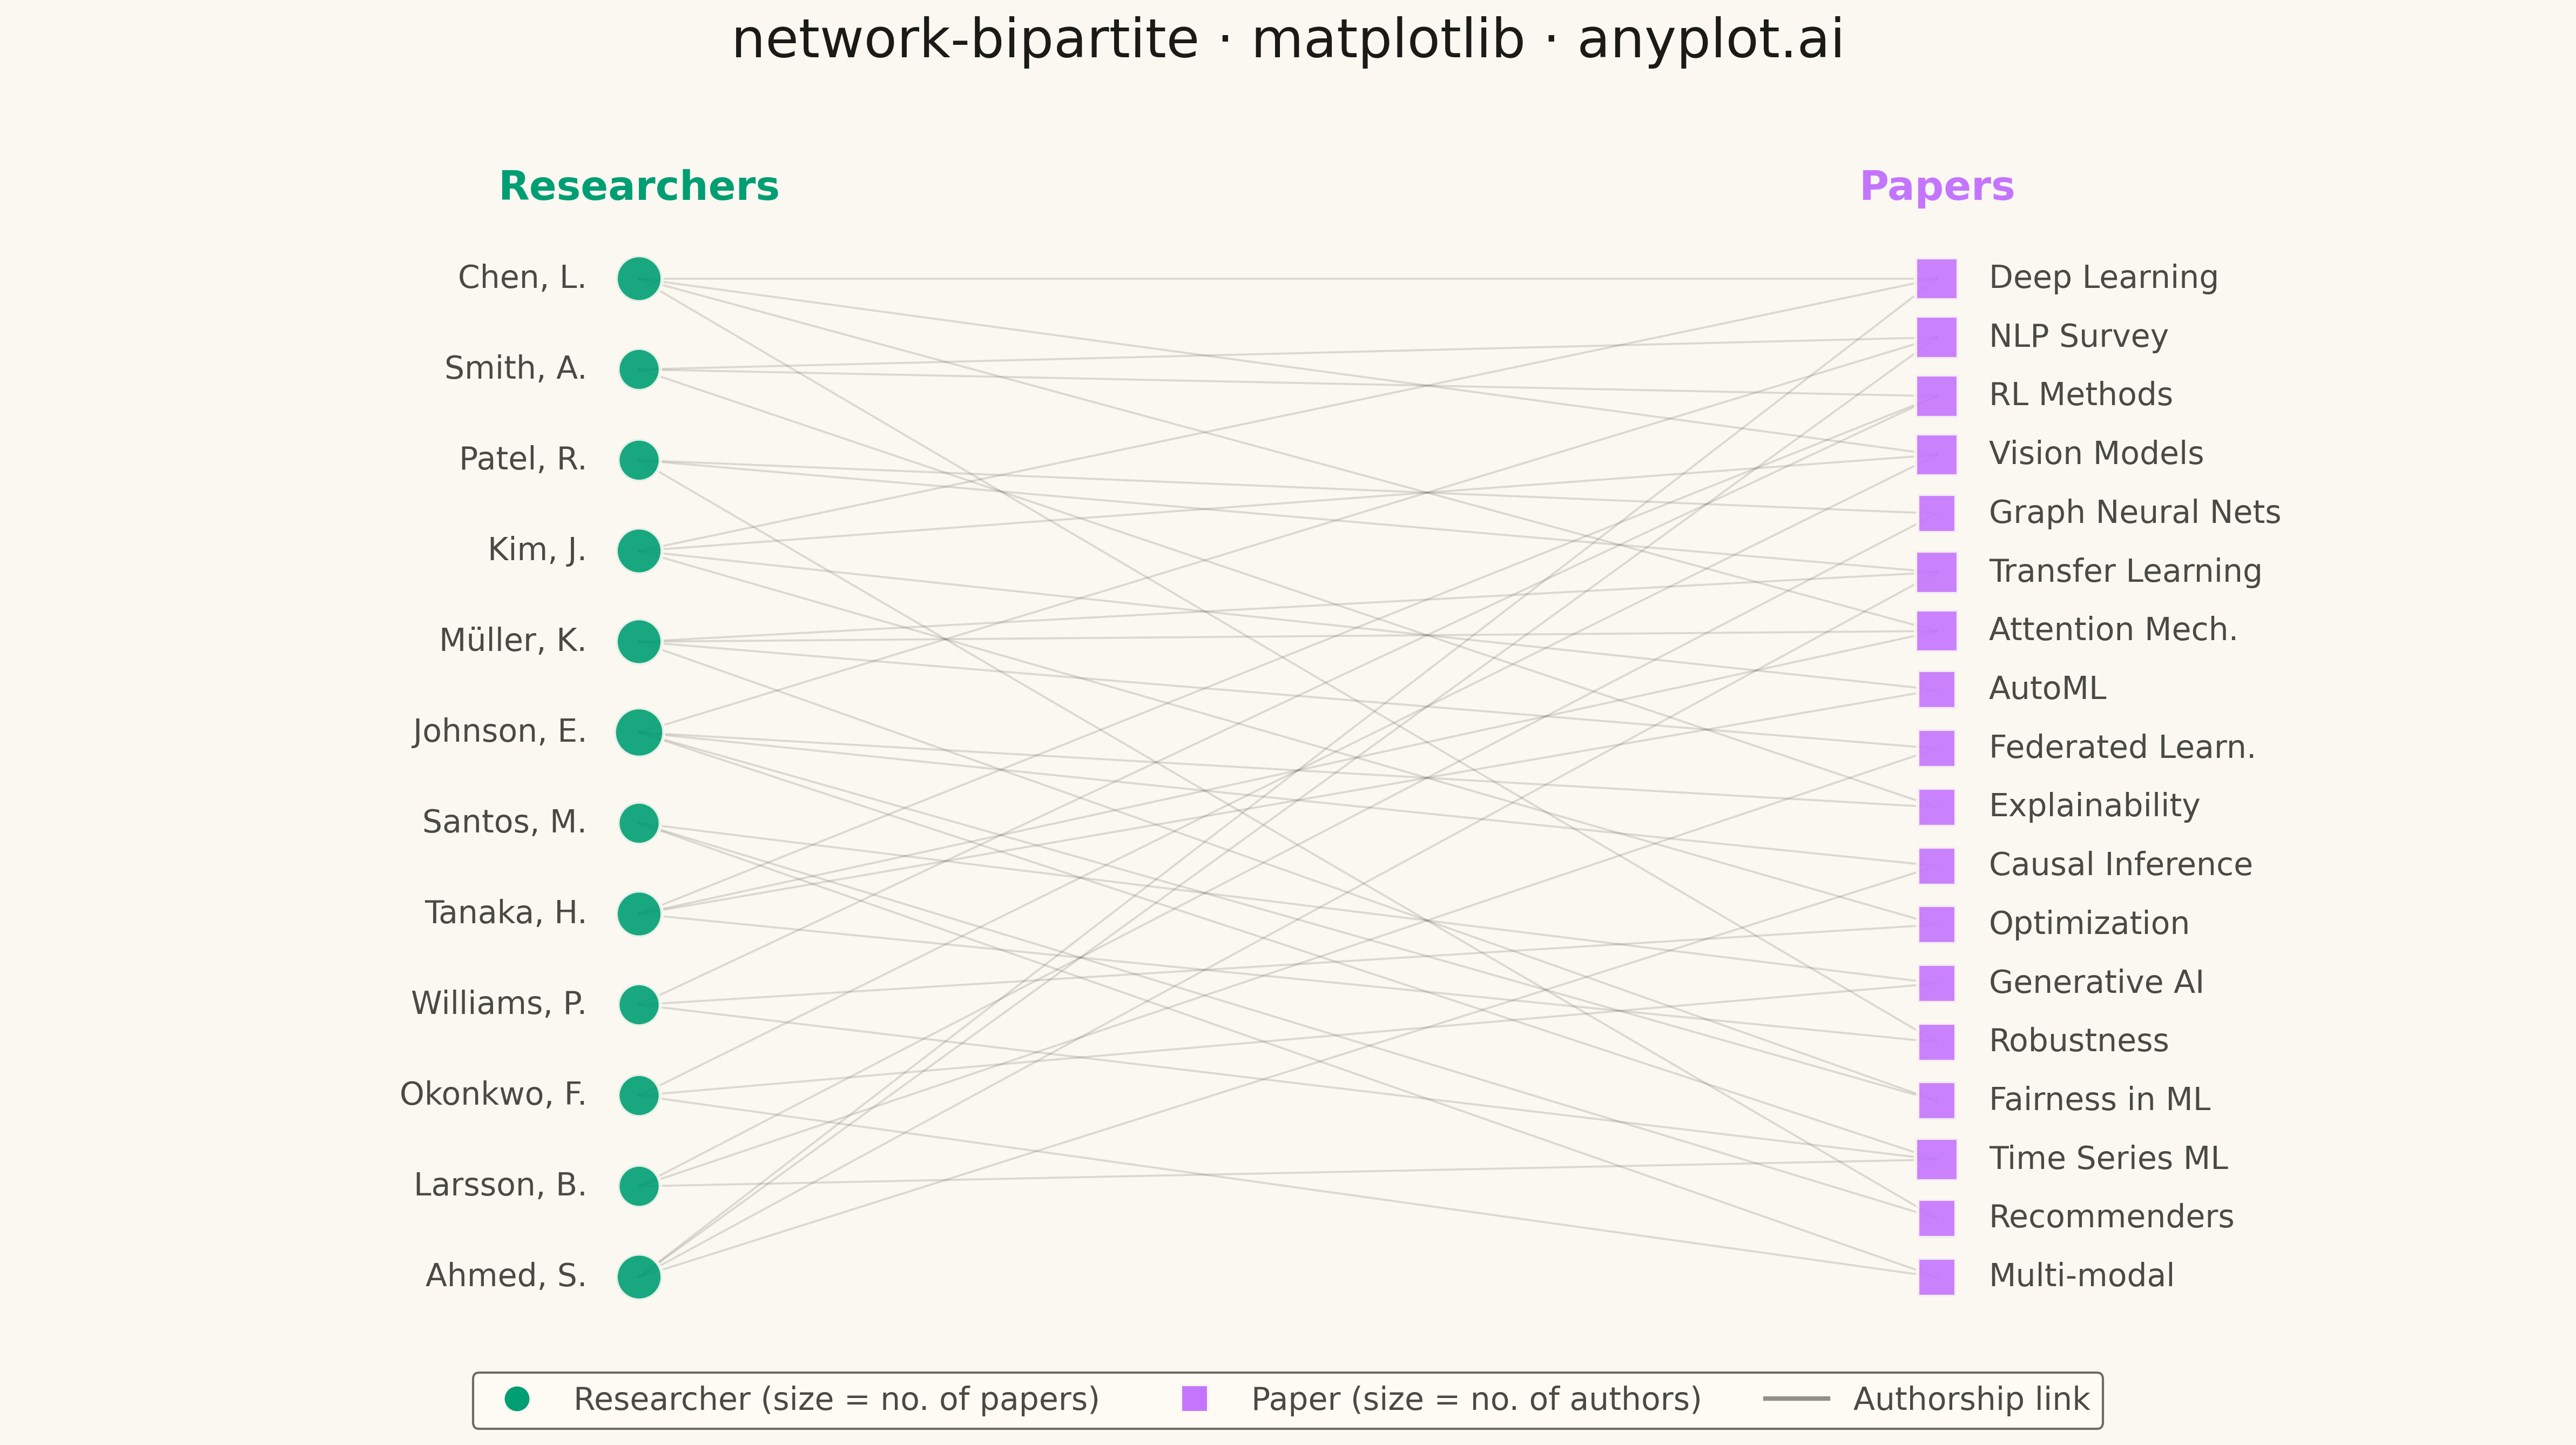
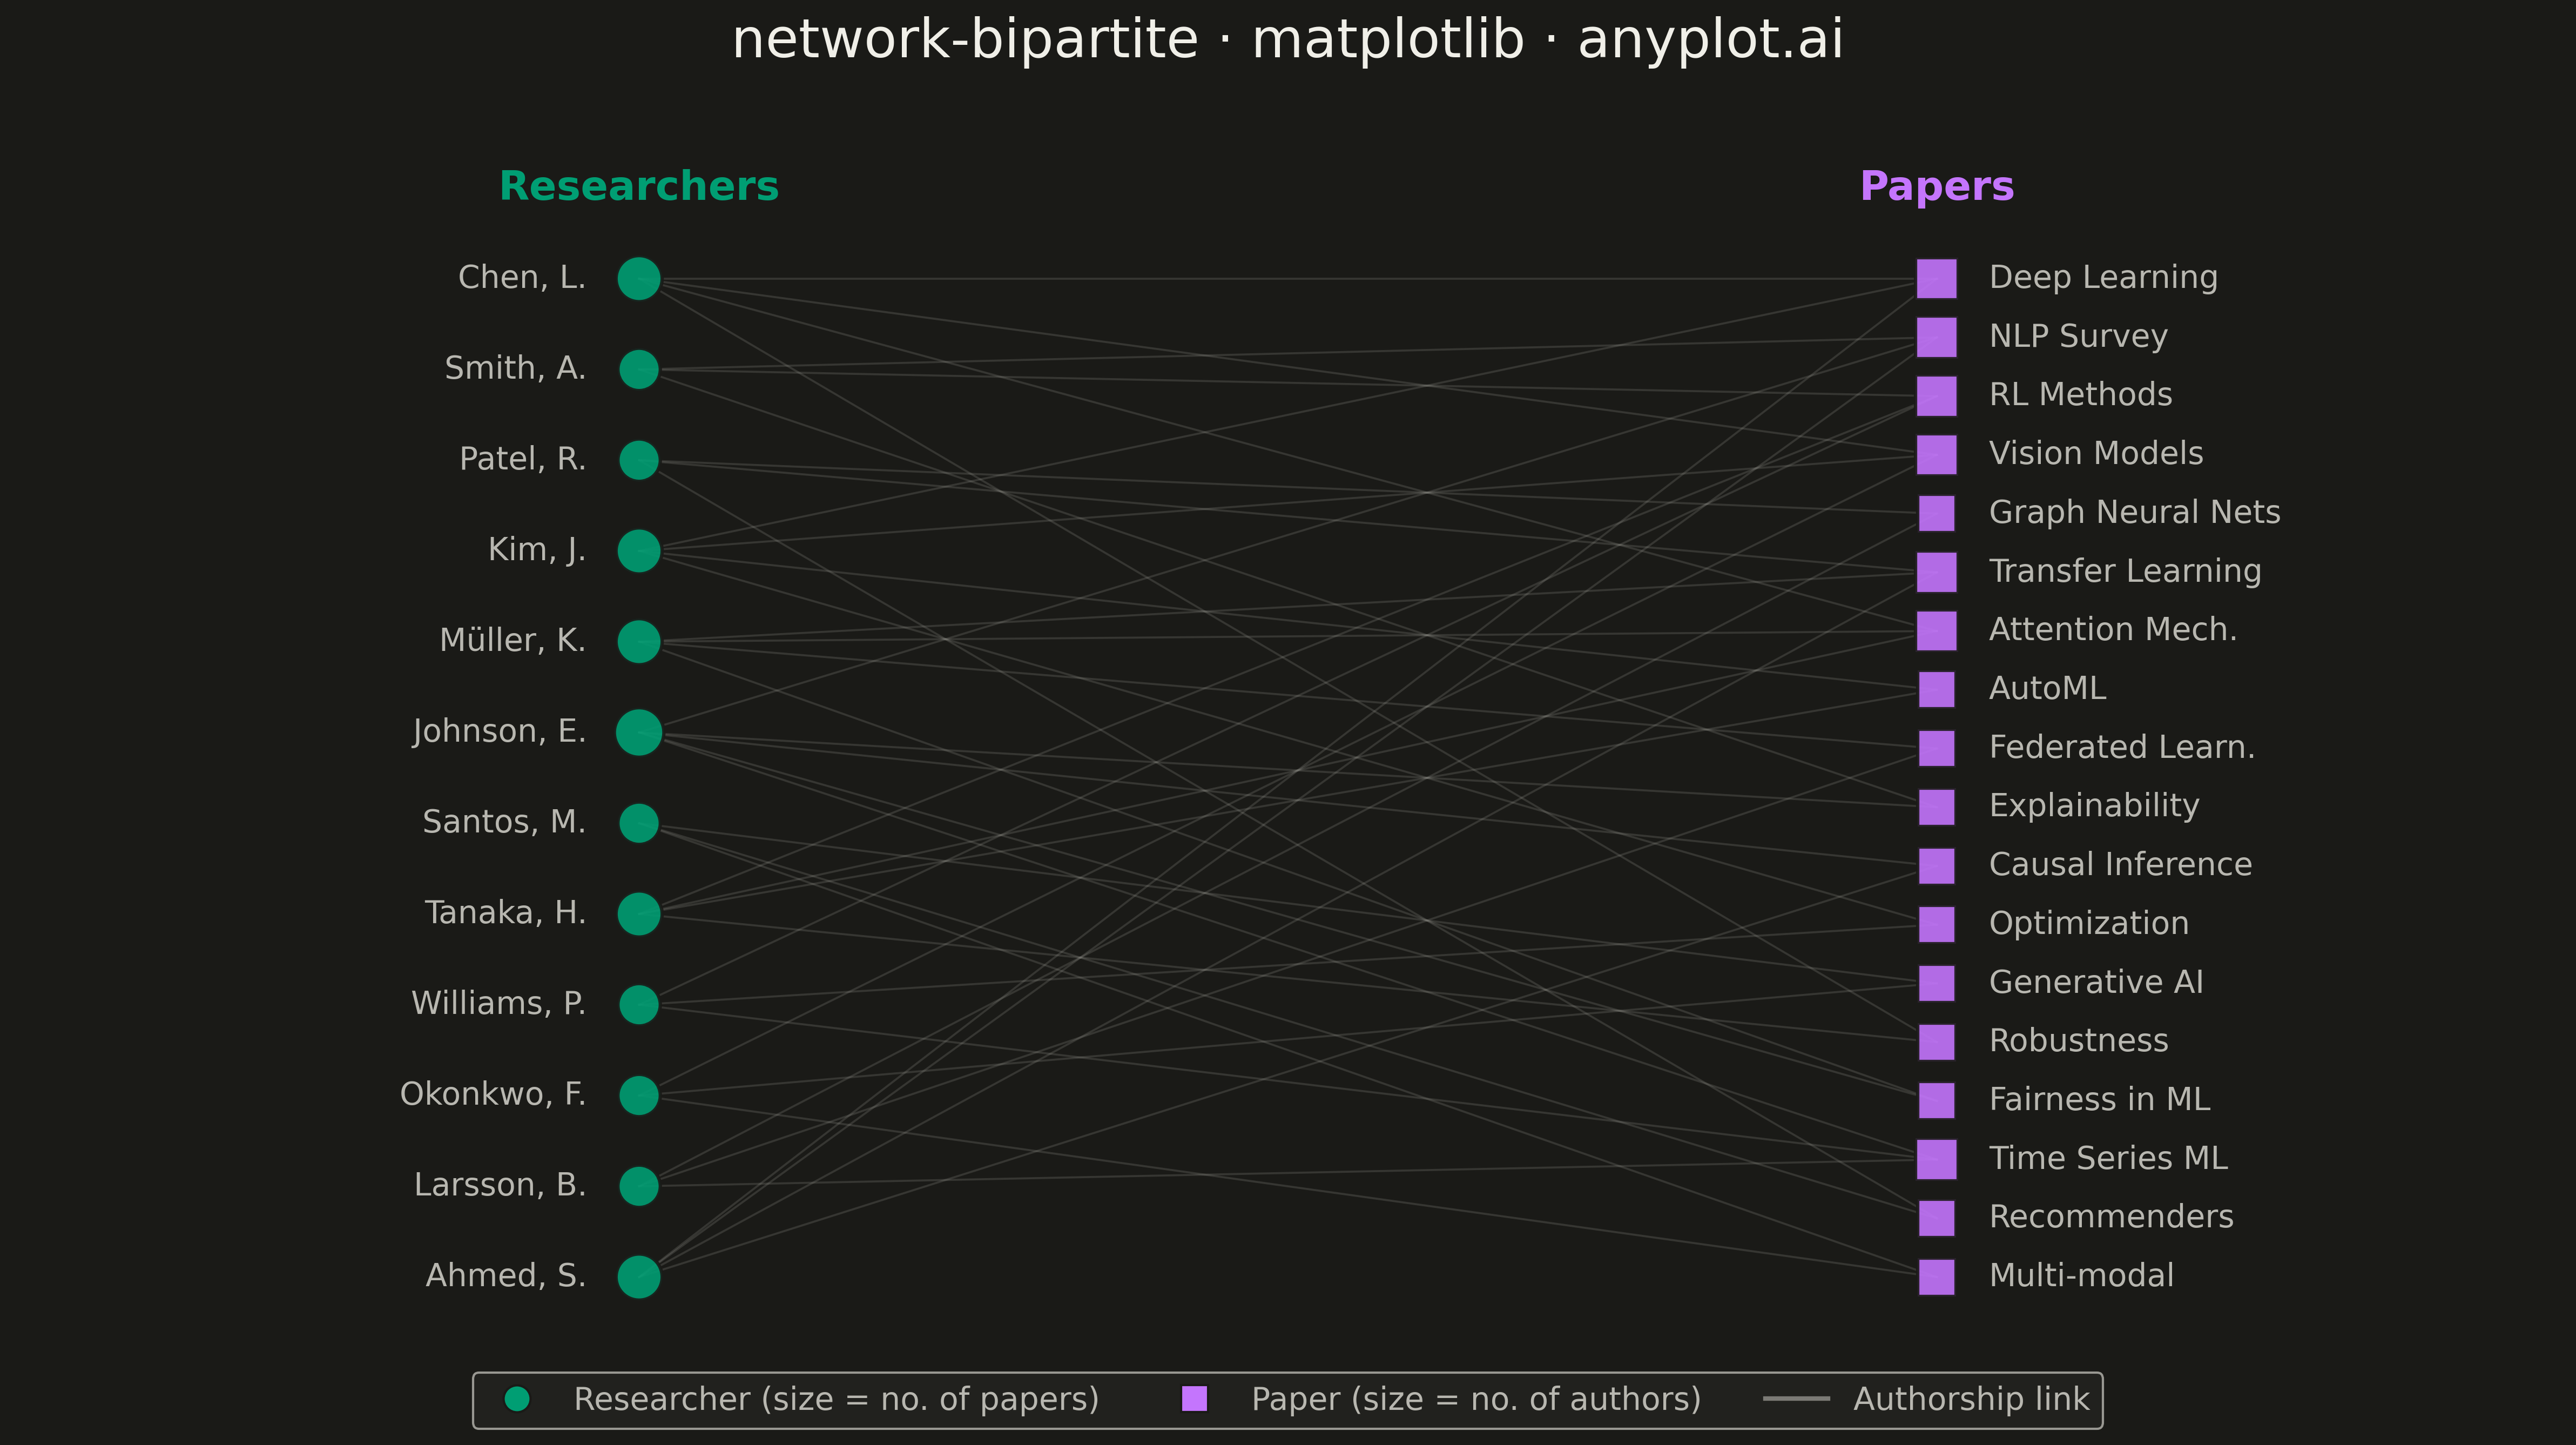
The same plot in 14 other libraries — Python: Altair, Bokeh, lets-plot, Plotly, plotnine, Pygal, Seaborn; R: ggplot2; Julia: Makie.jl; JavaScript: Chart.js, D3.js, Apache ECharts, Highcharts, MUI X Charts. Compare all 15 side by side: Bipartite Network Graph in Python, R, Julia and JavaScript.
A bipartite network graph visualizes relationships between two distinct sets of entities, where edges only connect nodes from different sets — never within the same set. The two node groups are arranged in separate columns or rows, making the two-mode structure immediately apparent. This layout is fundamental for understanding cross-category relationships, revealing which entities from one set are linked to which entities in the other, and exposing patterns like hubs, clusters, and isolated nodes.
""" anyplot.ai
network-bipartite: Bipartite Network Graph
Library: matplotlib 3.10.9 | Python 3.13.13
Quality: 86/100 | Created: 2026-05-14
"""

import os

import matplotlib.pyplot as plt
import numpy as np
from matplotlib.lines import Line2D


THEME = os.getenv("ANYPLOT_THEME", "light")
PAGE_BG = "#FAF8F1" if THEME == "light" else "#1A1A17"
ELEVATED_BG = "#FFFDF6" if THEME == "light" else "#242420"
INK = "#1A1A17" if THEME == "light" else "#F0EFE8"
INK_SOFT = "#4A4A44" if THEME == "light" else "#B8B7B0"
BRAND = "#009E73"  # Okabe-Ito pos 1 — researchers
ACCENT = "#C475FD"  # Okabe-Ito pos 2 — papers

# Data — researcher-paper affiliation network (bibliometrics)
np.random.seed(42)

researchers = [
    "Chen, L.",
    "Smith, A.",
    "Patel, R.",
    "Kim, J.",
    "Müller, K.",
    "Johnson, E.",
    "Santos, M.",
    "Tanaka, H.",
    "Williams, P.",
    "Okonkwo, F.",
    "Larsson, B.",
    "Ahmed, S.",
]

papers = [
    "Deep Learning",
    "NLP Survey",
    "RL Methods",
    "Vision Models",
    "Graph Neural Nets",
    "Transfer Learning",
    "Attention Mech.",
    "AutoML",
    "Federated Learn.",
    "Explainability",
    "Causal Inference",
    "Optimization",
    "Generative AI",
    "Robustness",
    "Fairness in ML",
    "Time Series ML",
    "Recommenders",
    "Multi-modal",
]

# (researcher_idx, paper_idx)
edges = [
    (0, 0),
    (0, 3),
    (0, 6),
    (0, 13),
    (1, 1),
    (1, 2),
    (1, 9),
    (2, 4),
    (2, 5),
    (2, 16),
    (3, 0),
    (3, 3),
    (3, 7),
    (3, 11),
    (4, 5),
    (4, 6),
    (4, 8),
    (4, 14),
    (5, 1),
    (5, 9),
    (5, 10),
    (5, 14),
    (5, 15),
    (6, 12),
    (6, 16),
    (6, 17),
    (7, 2),
    (7, 6),
    (7, 7),
    (7, 13),
    (8, 2),
    (8, 11),
    (8, 15),
    (9, 3),
    (9, 12),
    (9, 17),
    (10, 4),
    (10, 8),
    (10, 15),
    (11, 0),
    (11, 1),
    (11, 5),
    (11, 10),
]

n_r, n_p = len(researchers), len(papers)
r_degree = np.zeros(n_r, dtype=int)
p_degree = np.zeros(n_p, dtype=int)
for r, p in edges:
    r_degree[r] += 1
    p_degree[p] += 1

r_y = np.linspace(0.90, 0.05, n_r)
p_y = np.linspace(0.90, 0.05, n_p)
r_sizes = 160 + r_degree * 65
p_sizes = 160 + p_degree * 65

# Plot
fig, ax = plt.subplots(figsize=(16, 9), facecolor=PAGE_BG)
ax.set_facecolor(PAGE_BG)

# Edges
for r, p in edges:
    ax.plot([0.0, 1.0], [r_y[r], p_y[p]], color=INK_SOFT, alpha=0.18, linewidth=0.9, zorder=1)

# Researcher nodes (circles)
ax.scatter([0.0] * n_r, r_y, s=r_sizes, c=BRAND, edgecolors=PAGE_BG, linewidth=1.5, zorder=3, alpha=0.90)

# Paper nodes (squares)
ax.scatter([1.0] * n_p, p_y, s=p_sizes, c=ACCENT, marker="s", edgecolors=PAGE_BG, linewidth=1.5, zorder=3, alpha=0.90)

# Node labels
for i, name in enumerate(researchers):
    ax.text(-0.04, r_y[i], name, ha="right", va="center", fontsize=14, color=INK_SOFT)

for i, name in enumerate(papers):
    ax.text(1.04, p_y[i], name, ha="left", va="center", fontsize=14, color=INK_SOFT)

# Column headers
ax.text(0.0, 0.96, "Researchers", ha="center", va="bottom", fontsize=18, fontweight="bold", color=BRAND)
ax.text(1.0, 0.96, "Papers", ha="center", va="bottom", fontsize=18, fontweight="bold", color=ACCENT)

# Legend
handles = [
    Line2D(
        [0],
        [0],
        marker="o",
        linestyle="none",
        markerfacecolor=BRAND,
        markersize=12,
        label="Researcher (size = no. of papers)",
        markeredgecolor=PAGE_BG,
    ),
    Line2D(
        [0],
        [0],
        marker="s",
        linestyle="none",
        markerfacecolor=ACCENT,
        markersize=12,
        label="Paper (size = no. of authors)",
        markeredgecolor=PAGE_BG,
    ),
    Line2D([0], [0], color=INK_SOFT, linewidth=2, alpha=0.6, label="Authorship link"),
]
leg = ax.legend(handles=handles, loc="lower center", ncol=3, fontsize=14, frameon=True, bbox_to_anchor=(0.5, -0.02))
leg.get_frame().set_facecolor(ELEVATED_BG)
leg.get_frame().set_edgecolor(INK_SOFT)
plt.setp(leg.get_texts(), color=INK_SOFT)

ax.set_title("network-bipartite · matplotlib · anyplot.ai", fontsize=24, fontweight="medium", color=INK, pad=15)

ax.set_xlim(-0.48, 1.48)
ax.set_ylim(-0.07, 1.06)
ax.axis("off")

plt.tight_layout()
plt.savefig(f"plot-{THEME}.png", dpi=300, bbox_inches="tight", facecolor=PAGE_BG)
Runnable source as JSON, for any HTTP client: https://api.anyplot.ai/specs/network-bipartite/matplotlib/code. Any spec id and library id listed in llms-full.txt fit the same URL shape; every URL below is complete and callable.
{
  "spec_id": "network-bipartite",
  "language": "python",
  "library": "matplotlib",
  "page": "https://anyplot.ai/network-bipartite/python/matplotlib",
  "hub": "https://anyplot.ai/network-bipartite",
  "code_json": "https://api.anyplot.ai/specs/network-bipartite/matplotlib/code",
  "spec_json": "https://api.anyplot.ai/specs/network-bipartite",
  "render_light_png": "https://storage.googleapis.com/anyplot-images/plots/network-bipartite/python/matplotlib/plot-light.png",
  "render_dark_png": "https://storage.googleapis.com/anyplot-images/plots/network-bipartite/python/matplotlib/plot-dark.png",
  "quality_score": 86.0,
  "license": "MIT",
  "guide": "https://anyplot.ai/llms.txt"
}
Part of Bipartite Network Graph on anyplot.ai.