The same plot in 14 other libraries — Python: Altair, lets-plot, Matplotlib, Plotly, plotnine, Pygal, Seaborn; R: ggplot2; Julia: Makie.jl; JavaScript: Chart.js, D3.js, Apache ECharts, Highcharts, MUI X Charts. Compare all 15 side by side: Bipartite Network Graph in Python, R, Julia and JavaScript.
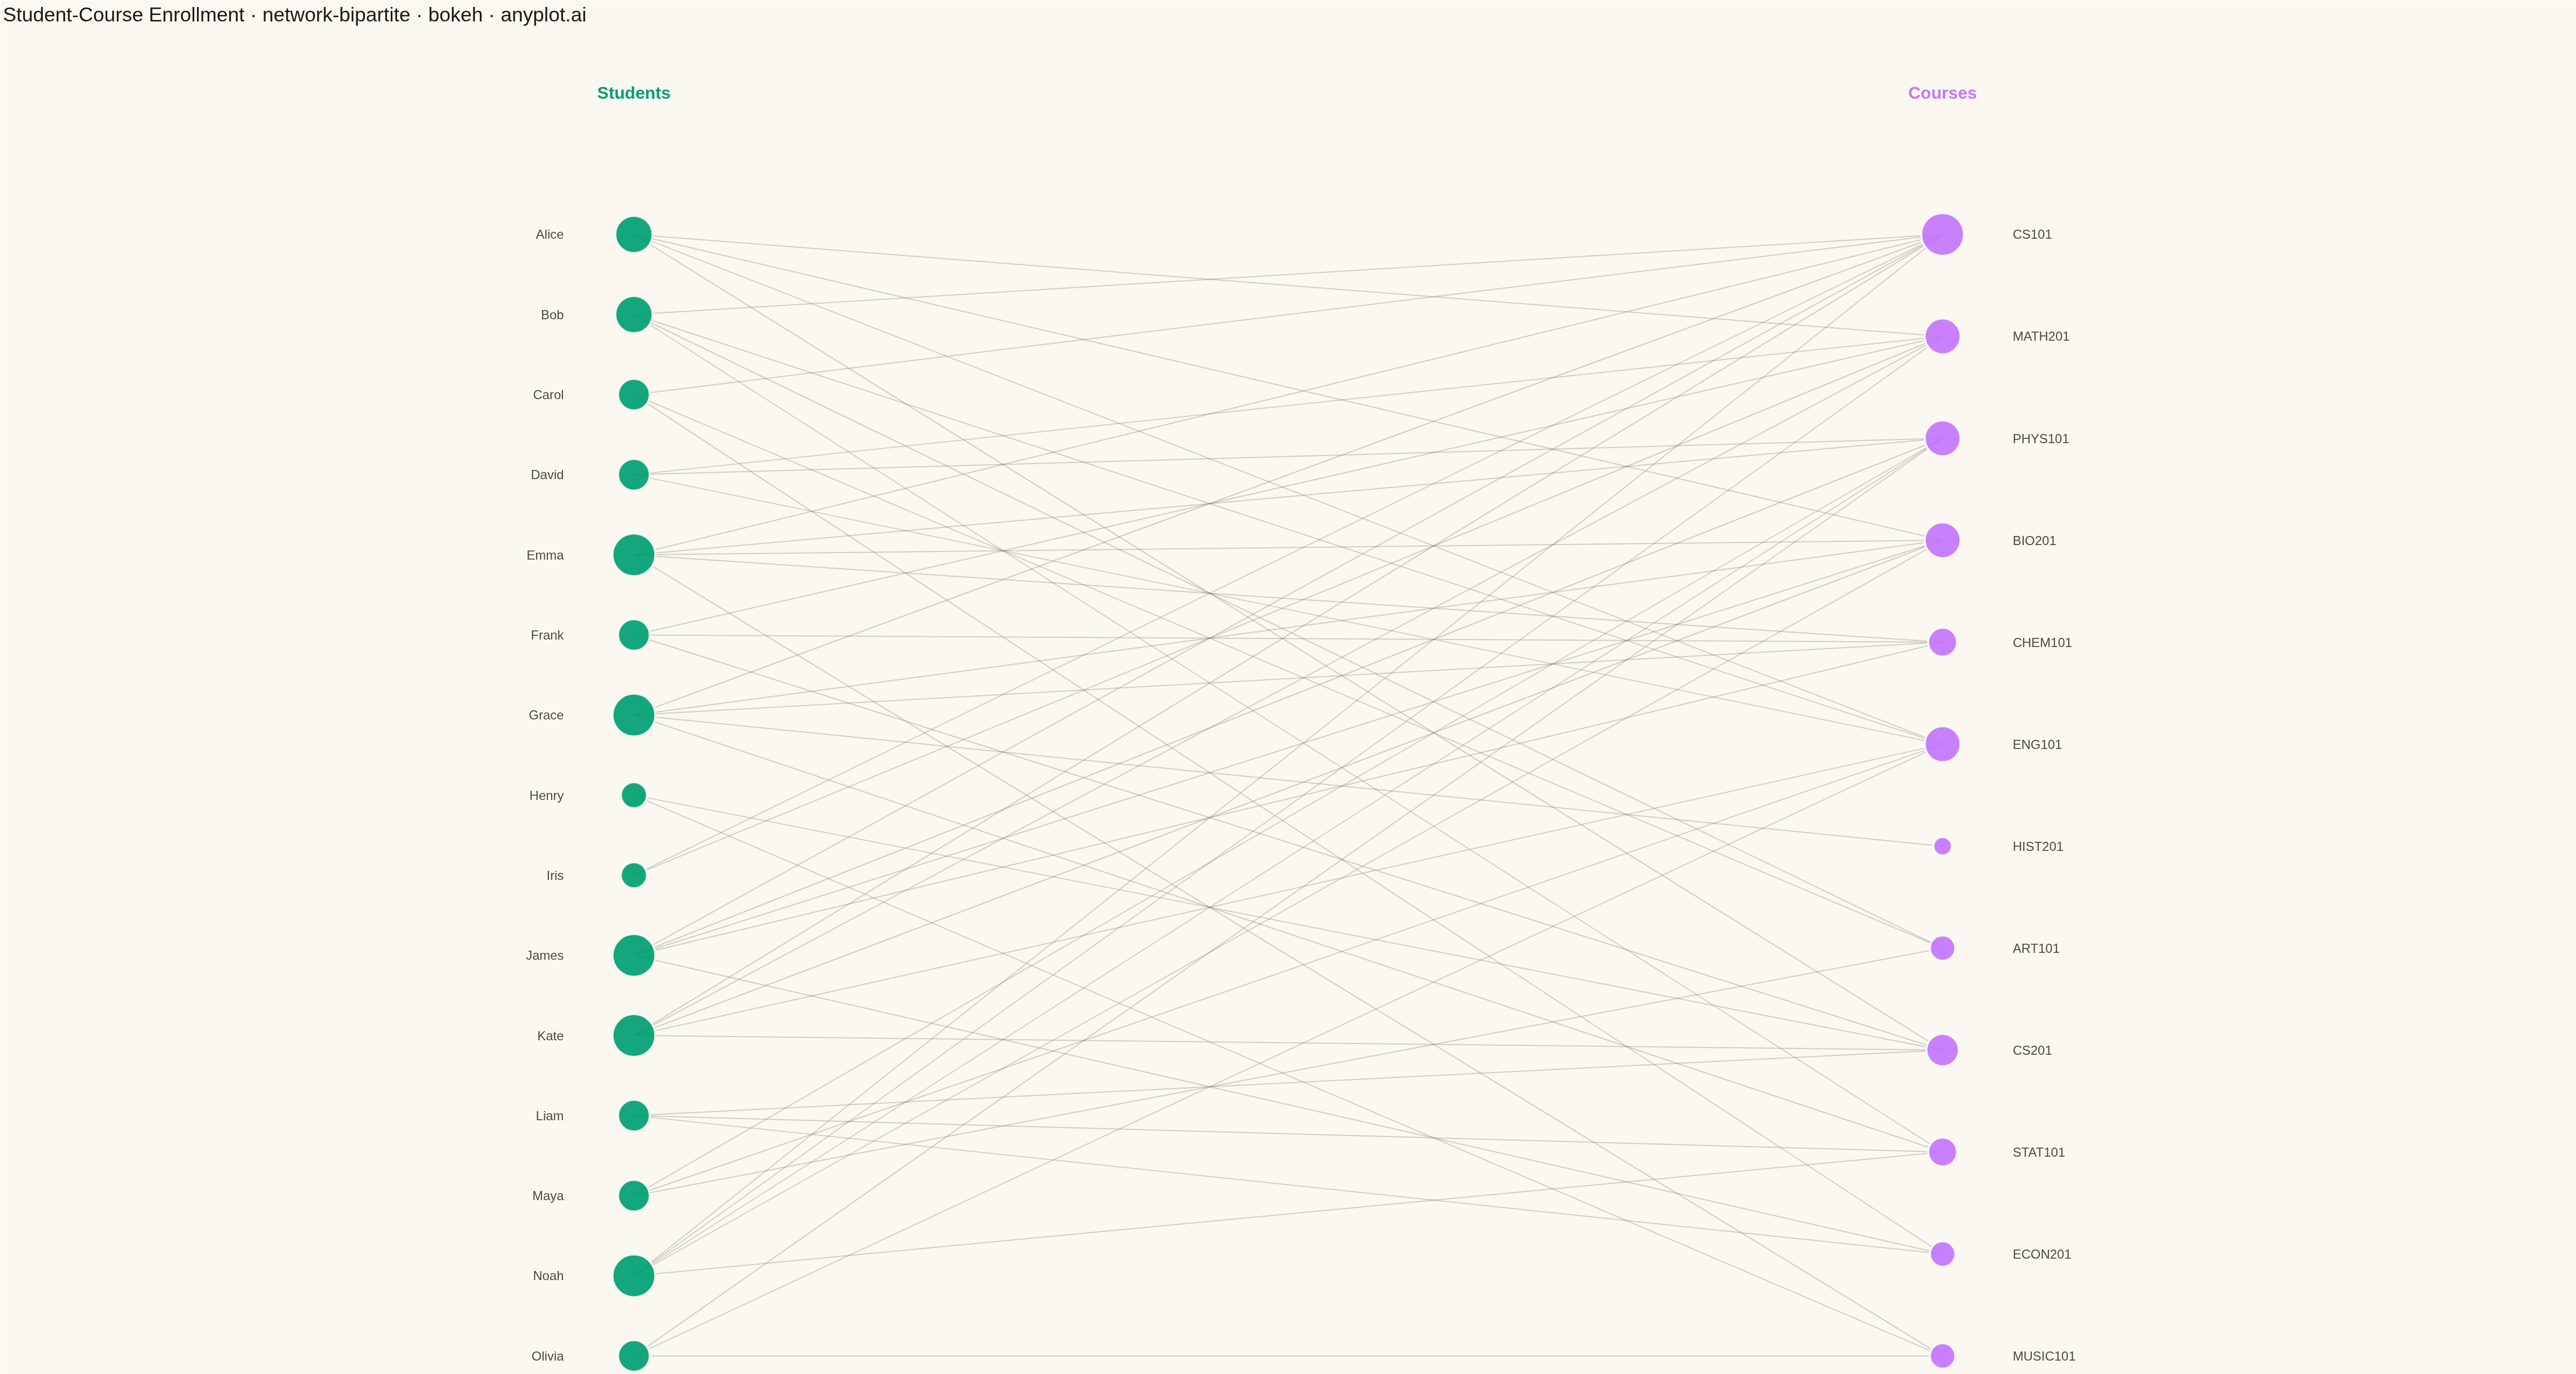
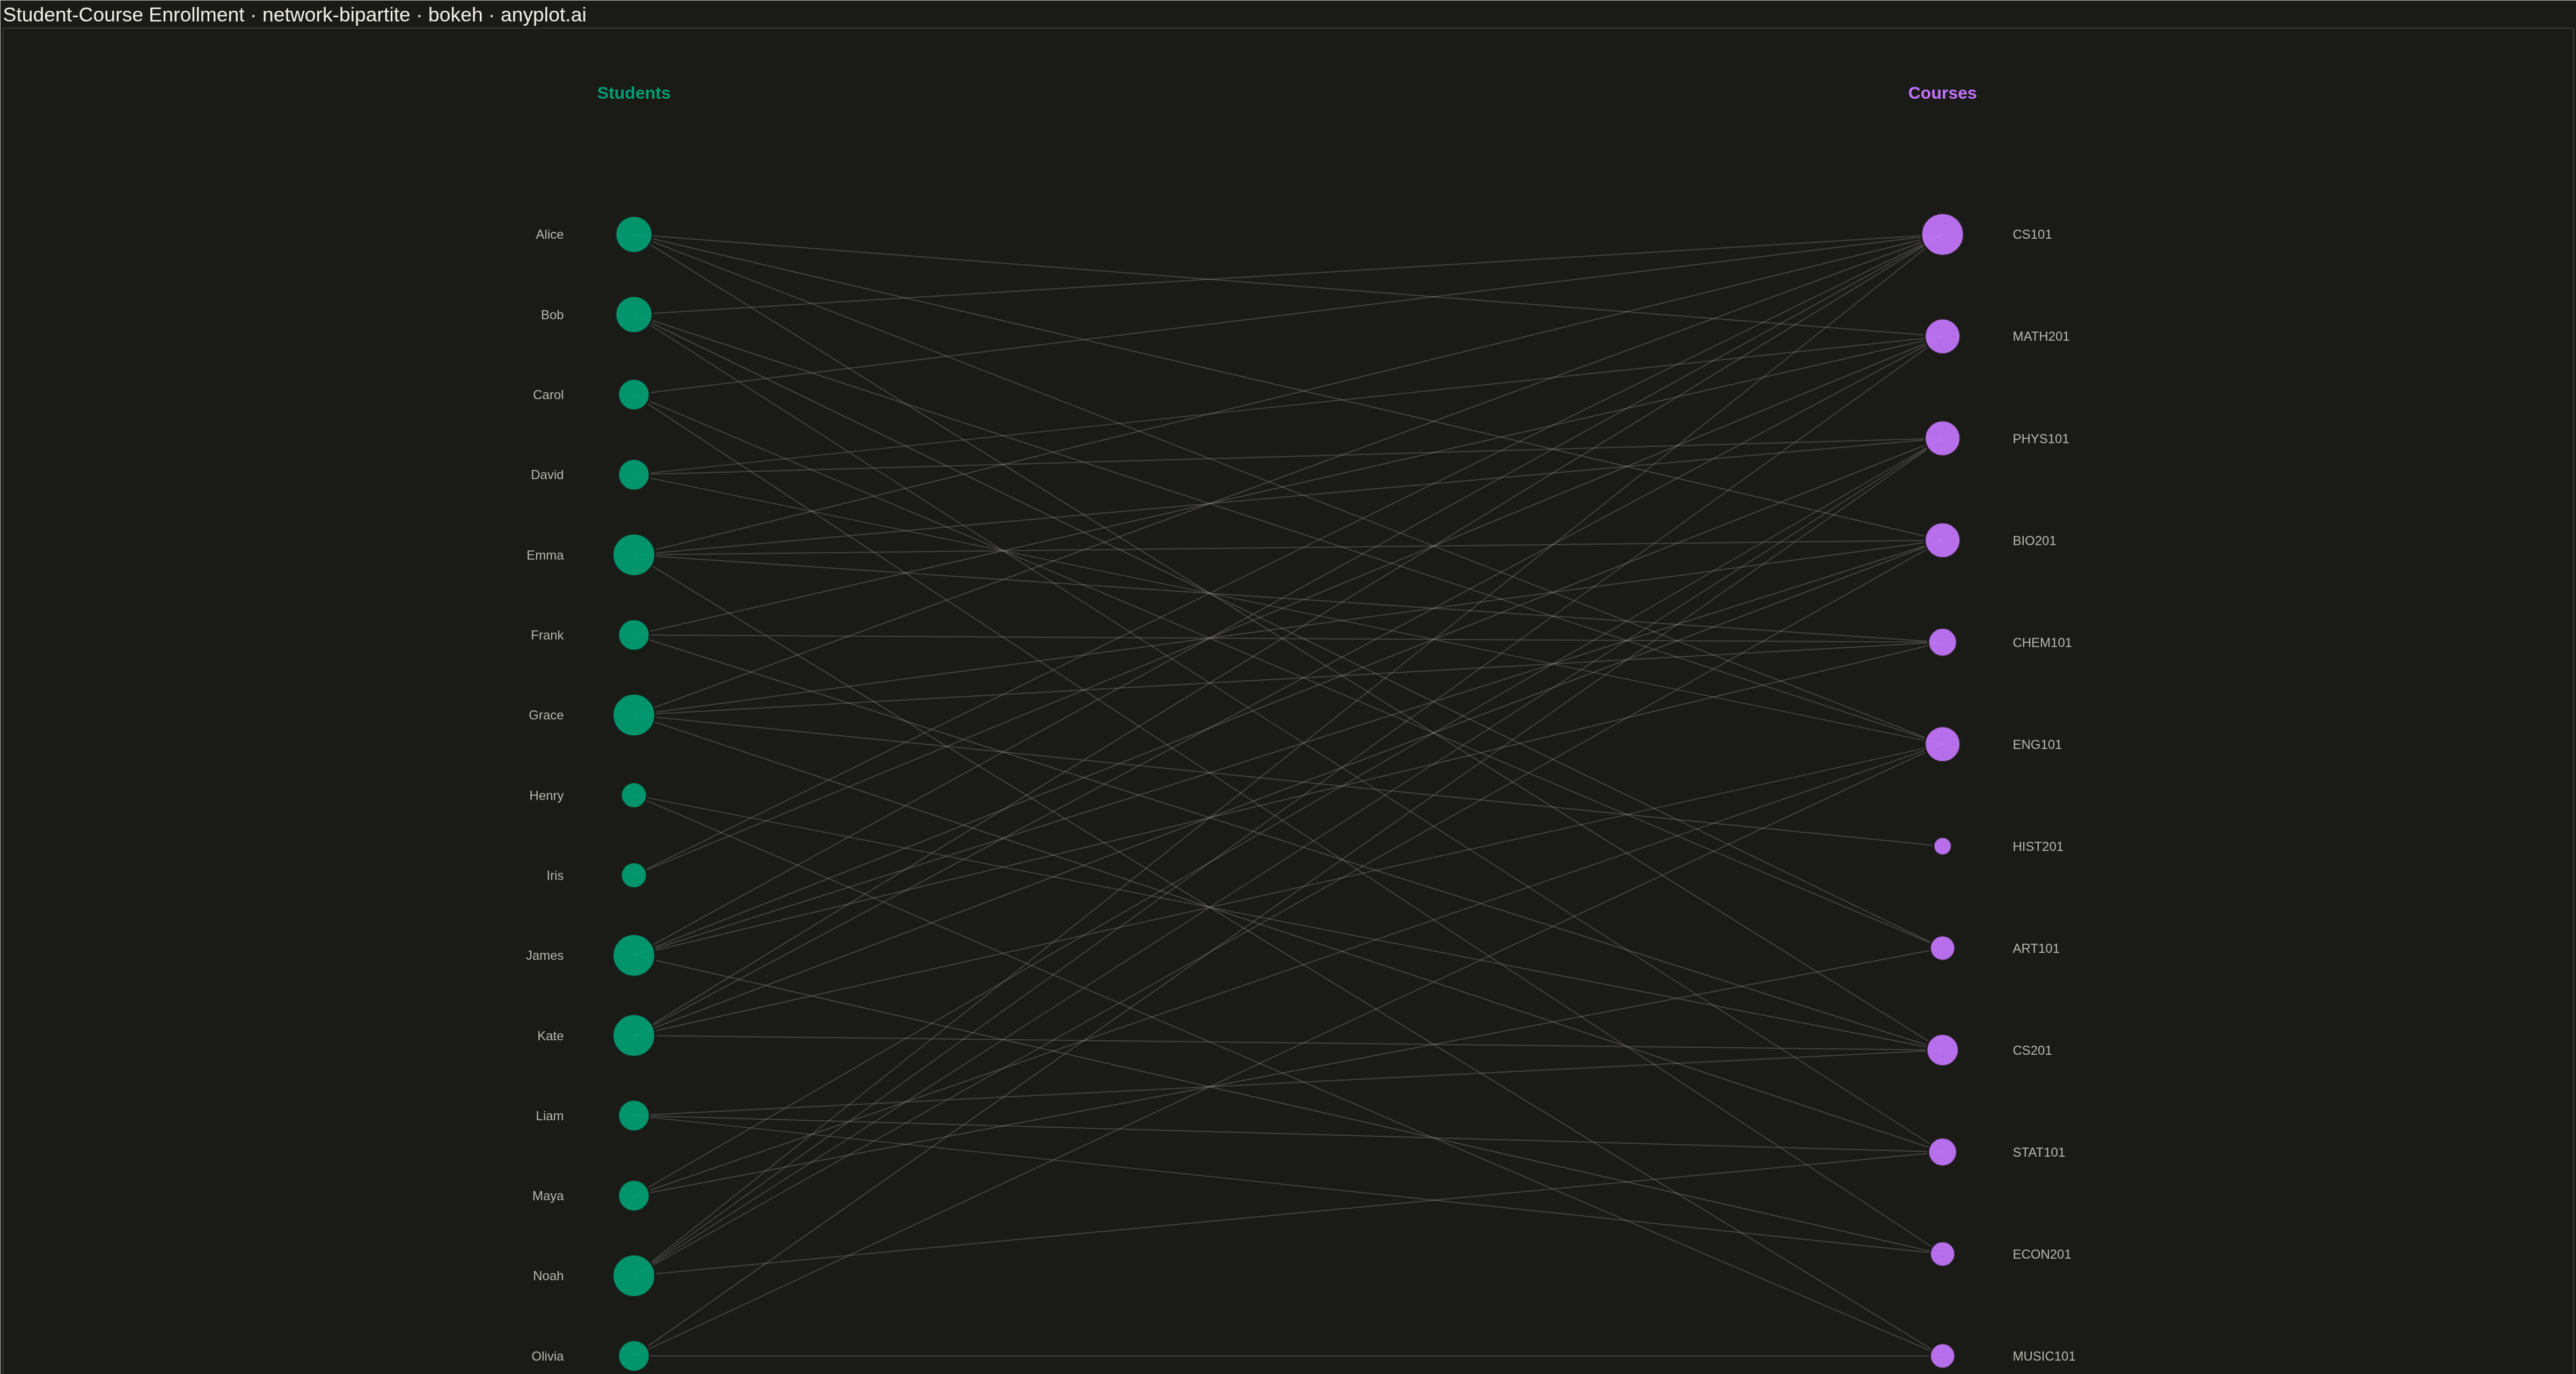
A bipartite network graph visualizes relationships between two distinct sets of entities, where edges only connect nodes from different sets — never within the same set. The two node groups are arranged in separate columns or rows, making the two-mode structure immediately apparent. This layout is fundamental for understanding cross-category relationships, revealing which entities from one set are linked to which entities in the other, and exposing patterns like hubs, clusters, and isolated nodes.
""" anyplot.ai
network-bipartite: Bipartite Network Graph
Library: bokeh 3.9.0 | Python 3.13.13
Quality: 84/100 | Created: 2026-05-14
"""

import sys


sys.path.pop(0)  # prevent bokeh.py from shadowing the bokeh package

import os
import time
from pathlib import Path

import numpy as np
from bokeh.io import output_file, save
from bokeh.plotting import figure
from selenium import webdriver
from selenium.webdriver.chrome.options import Options


# Theme
THEME = os.getenv("ANYPLOT_THEME", "light")
PAGE_BG = "#FAF8F1" if THEME == "light" else "#1A1A17"
ELEVATED_BG = "#FFFDF6" if THEME == "light" else "#242420"
INK = "#1A1A17" if THEME == "light" else "#F0EFE8"
INK_SOFT = "#4A4A44" if THEME == "light" else "#B8B7B0"
INK_MUTED = "#6B6A63" if THEME == "light" else "#A8A79F"

COLOR_A = "#009E73"  # Students - Okabe-Ito position 1
COLOR_B = "#C475FD"  # Courses  - Okabe-Ito position 2

# Data: student-course enrollment network
np.random.seed(42)

students = [
    "Alice",
    "Bob",
    "Carol",
    "David",
    "Emma",
    "Frank",
    "Grace",
    "Henry",
    "Iris",
    "James",
    "Kate",
    "Liam",
    "Maya",
    "Noah",
    "Olivia",
]
courses = [
    "CS101",
    "MATH201",
    "PHYS101",
    "BIO201",
    "CHEM101",
    "ENG101",
    "HIST201",
    "ART101",
    "CS201",
    "STAT101",
    "ECON201",
    "MUSIC101",
]

n_s = len(students)
n_c = len(courses)

# Generate enrollment edges (weighted toward popular courses)
course_weights = np.array([3, 3, 2, 2, 2, 2, 1, 1, 2, 2, 1, 1], dtype=float)
course_weights /= course_weights.sum()

edges = set()
for i in range(n_s):
    n_enroll = np.random.randint(2, 6)
    chosen = np.random.choice(n_c, size=n_enroll, replace=False, p=course_weights)
    for c in chosen:
        edges.add((i, int(c)))
edges = sorted(edges)

# Node degrees
s_degree = np.zeros(n_s)
c_degree = np.zeros(n_c)
for s, c in edges:
    s_degree[s] += 1
    c_degree[c] += 1

# Layout: students left (x=0.22), courses right (x=0.78)
X_LEFT = 0.22
X_RIGHT = 0.78
s_y = np.linspace(0.92, 0.05, n_s)
c_y = np.linspace(0.92, 0.05, n_c)

# Node sizes proportional to degree
s_sizes = 28 + 52 * (s_degree / s_degree.max())
c_sizes = 28 + 52 * (c_degree / c_degree.max())

# Edge segment coordinates
seg_x0 = [X_LEFT] * len(edges)
seg_y0 = [s_y[s] for s, c in edges]
seg_x1 = [X_RIGHT] * len(edges)
seg_y1 = [c_y[c] for s, c in edges]

# Figure
p = figure(
    width=4800,
    height=2700,
    x_range=(-0.05, 1.05),
    y_range=(-0.02, 1.08),
    toolbar_location=None,
    tools="",
    title="Student-Course Enrollment · network-bipartite · bokeh · anyplot.ai",
)

# Edges
p.segment(x0=seg_x0, y0=seg_y0, x1=seg_x1, y1=seg_y1, line_color=INK_MUTED, line_alpha=0.30, line_width=2)

# Student nodes (set A)
p.scatter(
    x=[X_LEFT] * n_s, y=s_y.tolist(), size=s_sizes.tolist(), color=COLOR_A, line_color=PAGE_BG, line_width=4, alpha=0.92
)

# Course nodes (set B)
p.scatter(
    x=[X_RIGHT] * n_c,
    y=c_y.tolist(),
    size=c_sizes.tolist(),
    color=COLOR_B,
    line_color=PAGE_BG,
    line_width=4,
    alpha=0.92,
)

# Student labels (right-aligned, left of nodes)
p.text(
    x=[X_LEFT - 0.03] * n_s,
    y=s_y.tolist(),
    text=students,
    text_align="right",
    text_baseline="middle",
    text_font_size="18pt",
    text_color=INK_SOFT,
)

# Course labels (left-aligned, right of nodes)
p.text(
    x=[X_RIGHT + 0.03] * n_c,
    y=c_y.tolist(),
    text=courses,
    text_align="left",
    text_baseline="middle",
    text_font_size="18pt",
    text_color=INK_SOFT,
)

# Column headers (colored to match node sets)
p.text(
    x=[X_LEFT, X_RIGHT],
    y=[1.03, 1.03],
    text=["Students", "Courses"],
    text_align="center",
    text_baseline="middle",
    text_font_size="24pt",
    text_font_style="bold",
    text_color=[COLOR_A, COLOR_B],
)

# Theme-adaptive chrome
p.background_fill_color = PAGE_BG
p.border_fill_color = PAGE_BG
p.outline_line_color = None
p.xaxis.visible = False
p.yaxis.visible = False
p.xgrid.visible = False
p.ygrid.visible = False

p.title.text_font_size = "28pt"
p.title.text_color = INK
p.title.text_font_style = "normal"

# Save HTML + PNG
output_file(f"plot-{THEME}.html")
save(p)

W, H = 4800, 2700
opts = Options()
for arg in (
    "--headless=new",
    "--no-sandbox",
    "--disable-dev-shm-usage",
    "--disable-gpu",
    f"--window-size={W},{H}",
    "--hide-scrollbars",
):
    opts.add_argument(arg)
driver = webdriver.Chrome(options=opts)
driver.set_window_size(W, H)
driver.get(f"file://{Path(f'plot-{THEME}.html').resolve()}")
time.sleep(3)
driver.save_screenshot(f"plot-{THEME}.png")
driver.quit()
Runnable source as JSON, for any HTTP client: https://api.anyplot.ai/specs/network-bipartite/bokeh/code. Any spec id and library id listed in llms-full.txt fit the same URL shape; every URL below is complete and callable.
{
  "spec_id": "network-bipartite",
  "language": "python",
  "library": "bokeh",
  "page": "https://anyplot.ai/network-bipartite/python/bokeh",
  "hub": "https://anyplot.ai/network-bipartite",
  "code_json": "https://api.anyplot.ai/specs/network-bipartite/bokeh/code",
  "spec_json": "https://api.anyplot.ai/specs/network-bipartite",
  "render_light_png": "https://storage.googleapis.com/anyplot-images/plots/network-bipartite/python/bokeh/plot-light.png",
  "render_dark_png": "https://storage.googleapis.com/anyplot-images/plots/network-bipartite/python/bokeh/plot-dark.png",
  "interactive_light_html": "https://storage.googleapis.com/anyplot-images/plots/network-bipartite/python/bokeh/plot-light.html",
  "interactive_dark_html": "https://storage.googleapis.com/anyplot-images/plots/network-bipartite/python/bokeh/plot-dark.html",
  "quality_score": 84.0,
  "license": "MIT",
  "guide": "https://anyplot.ai/llms.txt"
}
Part of Bipartite Network Graph on anyplot.ai.