The same plot in 14 other libraries — Python: Altair, Bokeh, lets-plot, Matplotlib, Plotly, plotnine, Seaborn; R: ggplot2; Julia: Makie.jl; JavaScript: Chart.js, D3.js, Apache ECharts, Highcharts, MUI X Charts. Compare all 15 side by side: Bipartite Network Graph in Python, R, Julia and JavaScript.
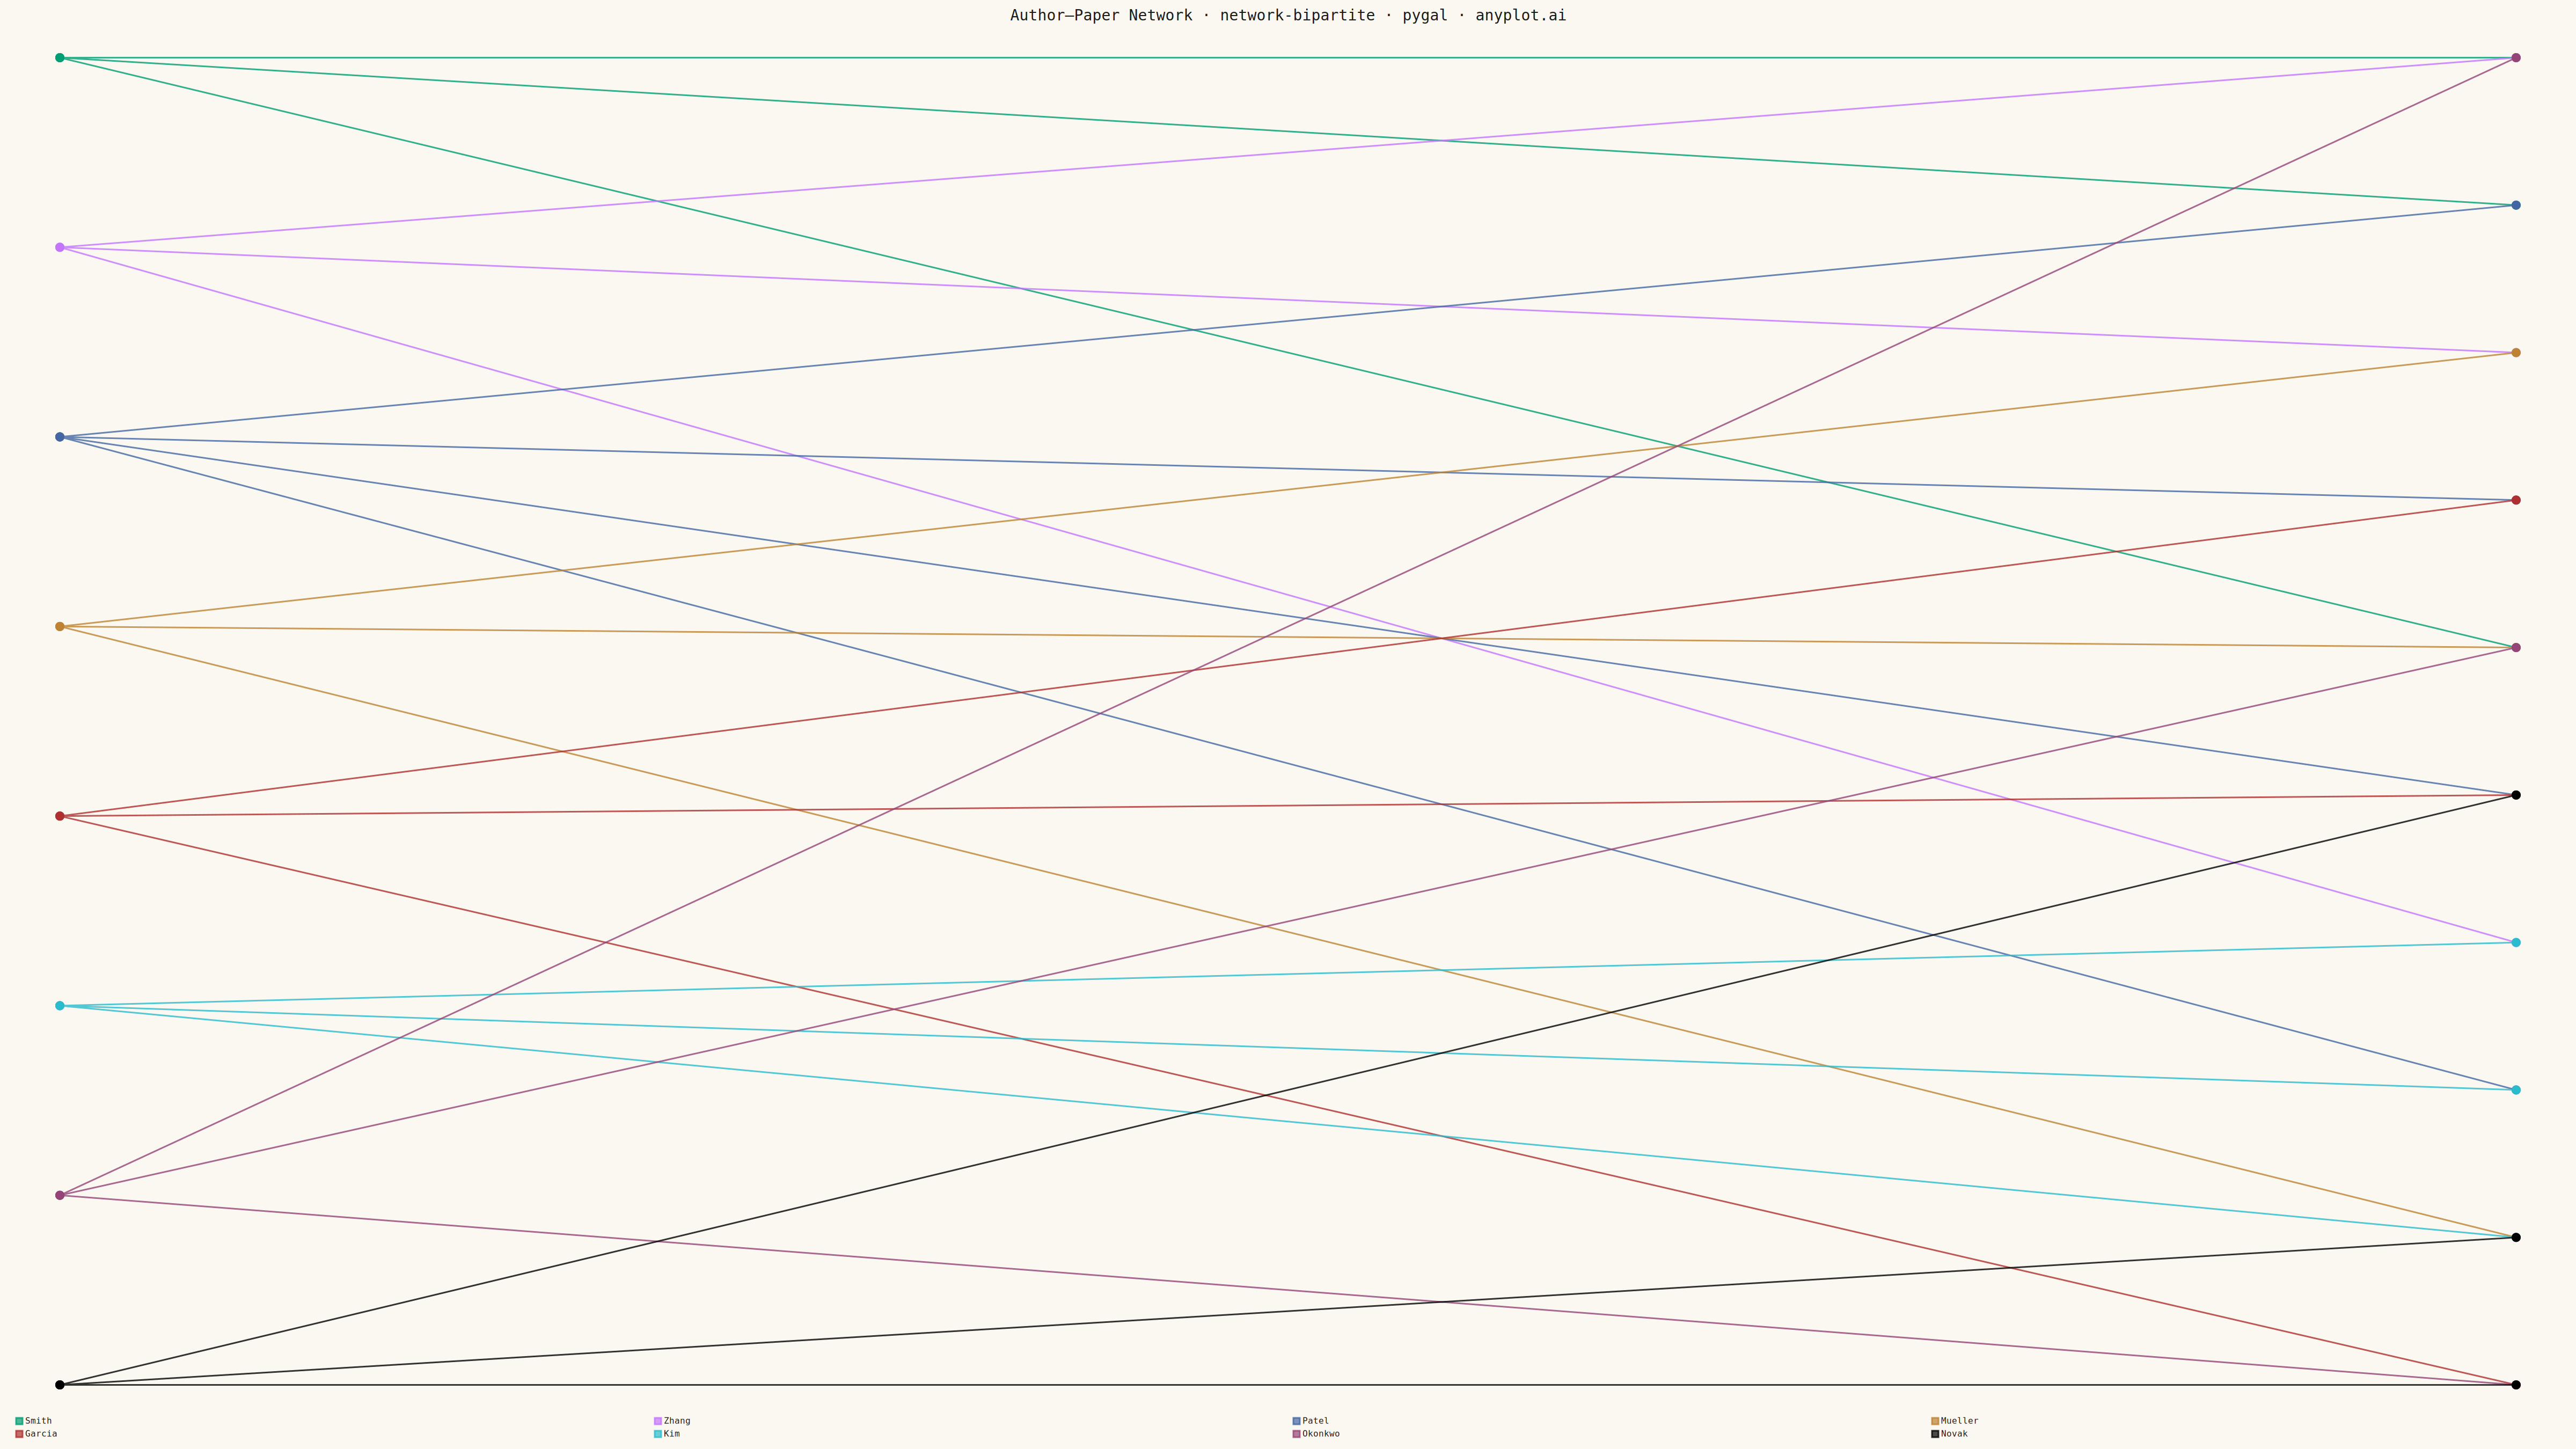
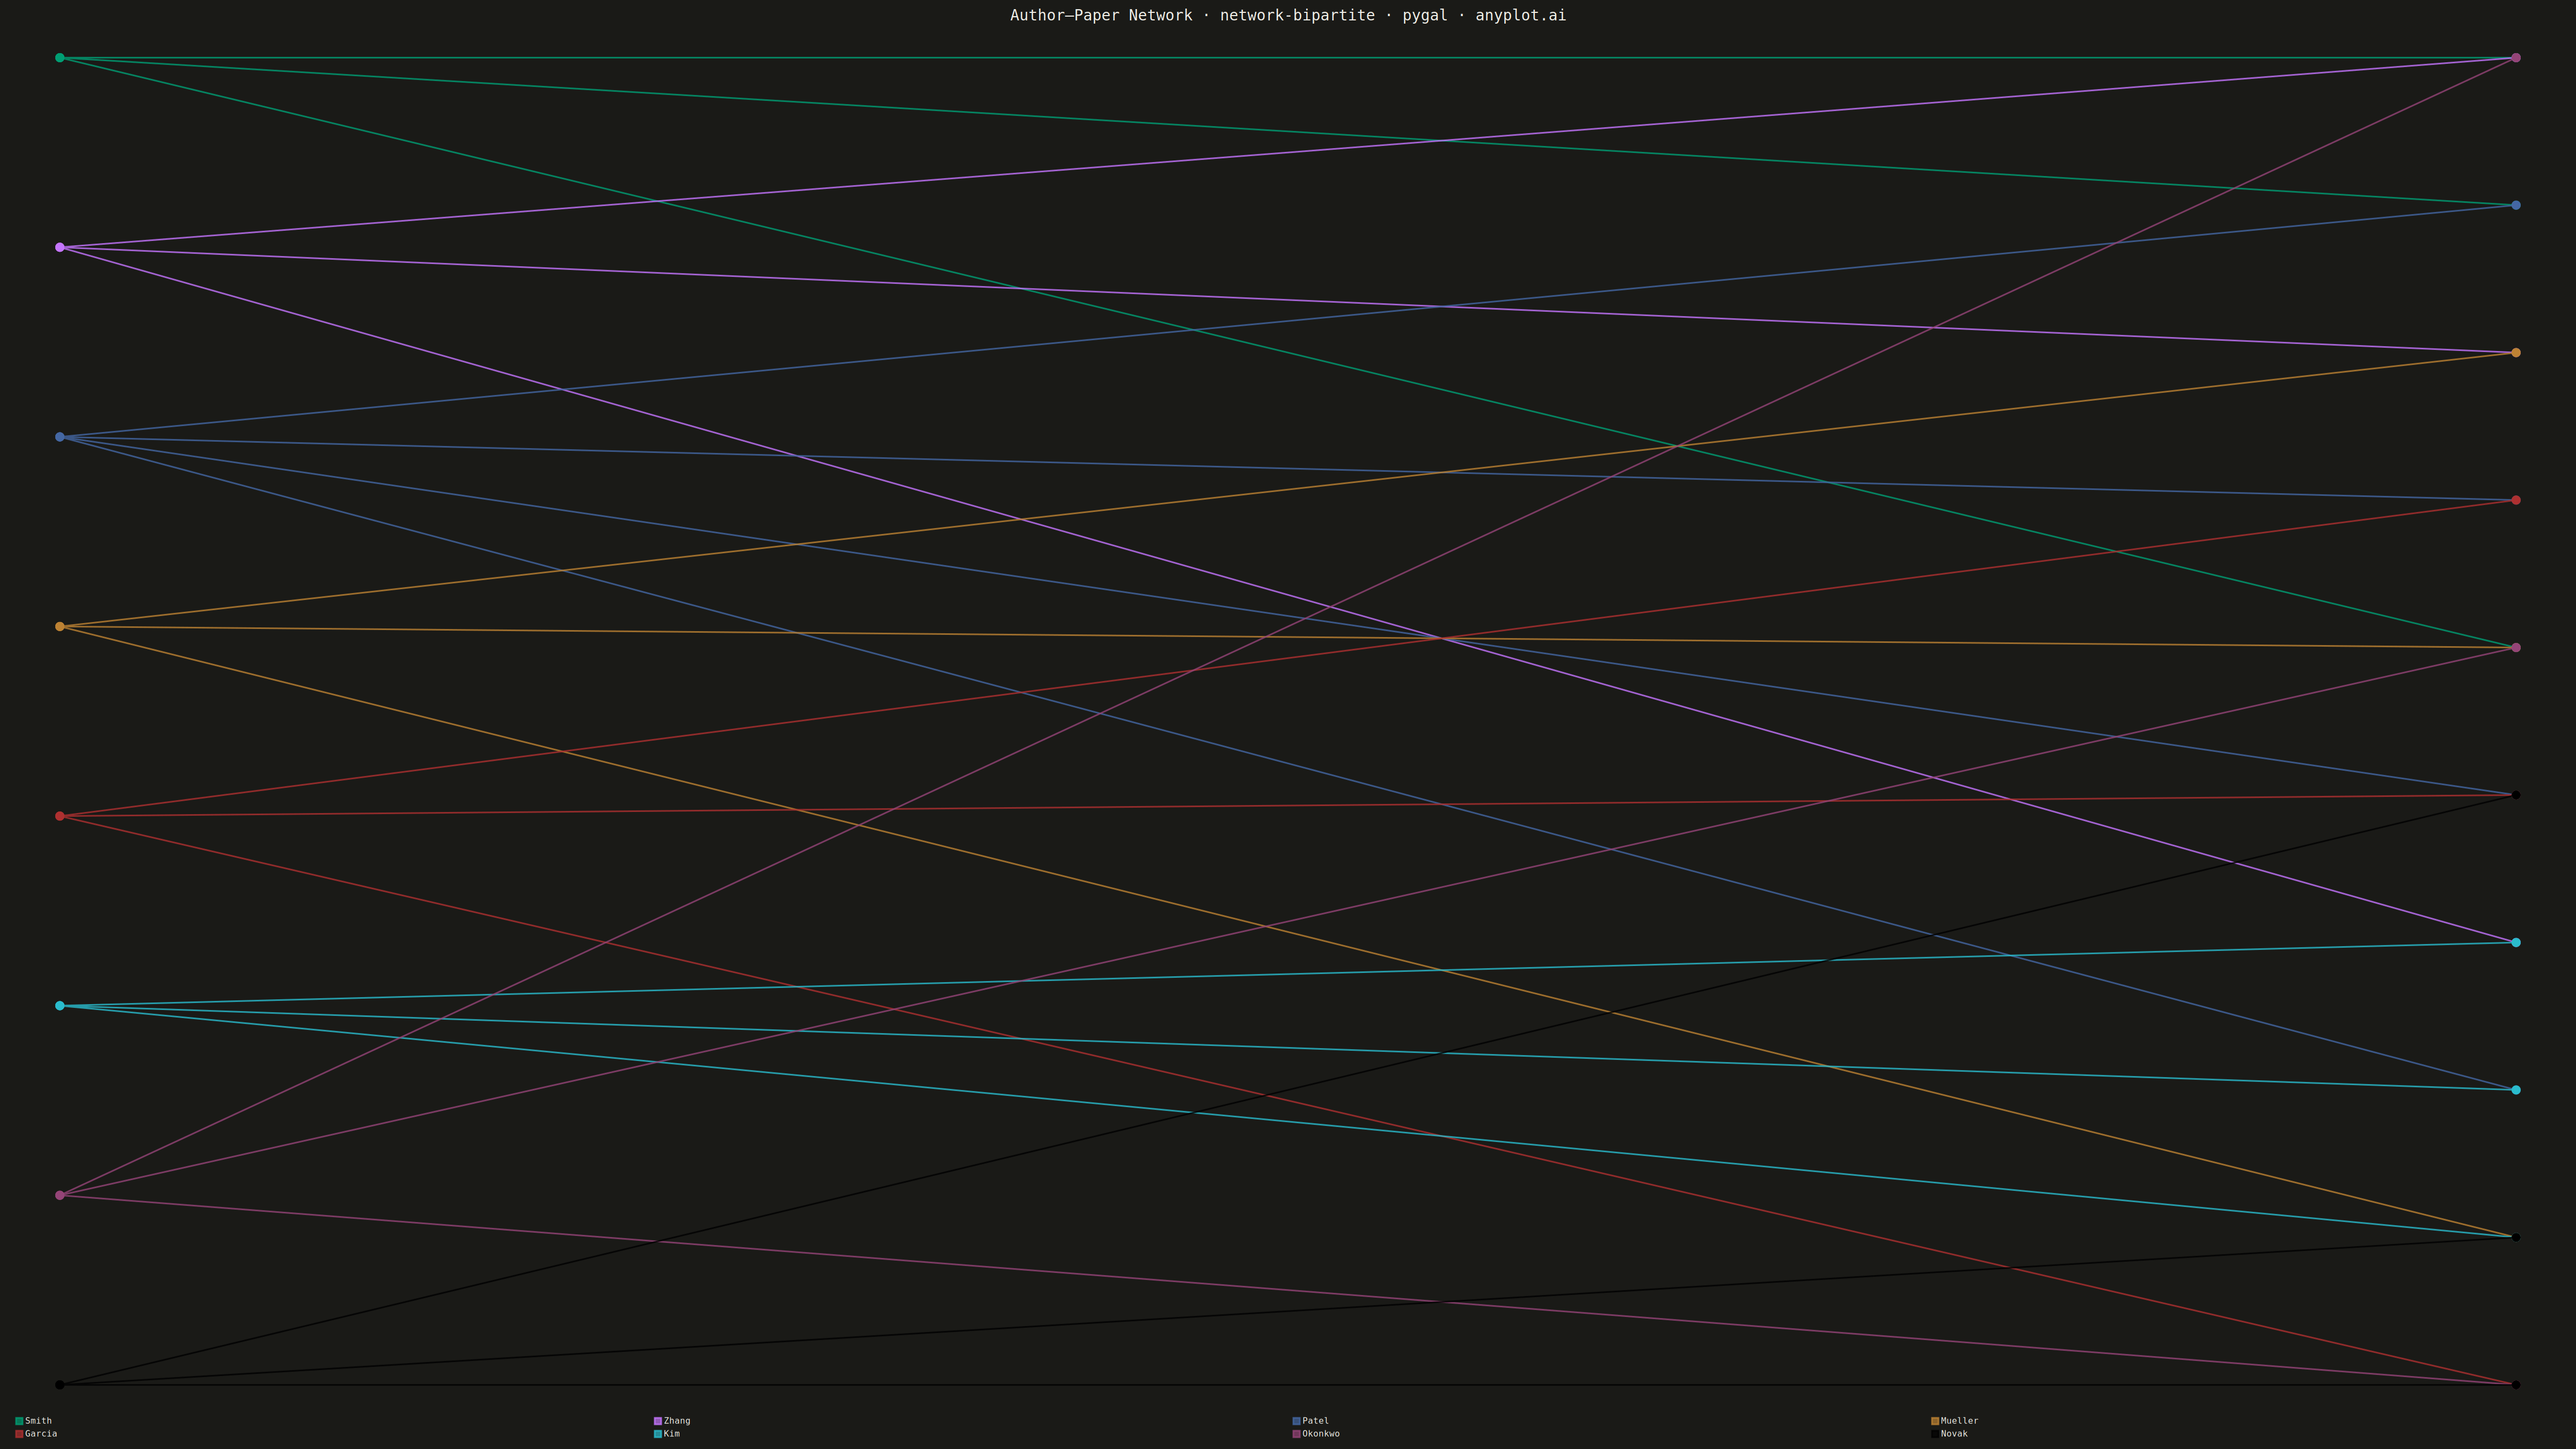
A bipartite network graph visualizes relationships between two distinct sets of entities, where edges only connect nodes from different sets — never within the same set. The two node groups are arranged in separate columns or rows, making the two-mode structure immediately apparent. This layout is fundamental for understanding cross-category relationships, revealing which entities from one set are linked to which entities in the other, and exposing patterns like hubs, clusters, and isolated nodes.
""" anyplot.ai
network-bipartite: Bipartite Network Graph
Library: pygal 3.1.0 | Python 3.13.13
Quality: 79/100 | Created: 2026-05-14
"""

import os
import sys


# Remove current directory from path to avoid importing this file as 'pygal'
_cwd = sys.path[0] if sys.path[0] else "."
if _cwd in sys.path:
    sys.path.remove(_cwd)

import pygal
from pygal.style import Style


sys.path.insert(0, _cwd)

THEME = os.getenv("ANYPLOT_THEME", "light")
PAGE_BG = "#FAF8F1" if THEME == "light" else "#1A1A17"
INK = "#1A1A17" if THEME == "light" else "#F0EFE8"
INK_MUTED = "#6B6A63" if THEME == "light" else "#A8A79F"

IMPRINT = ("#009E73", "#C475FD", "#4467A3", "#BD8233", "#AE3030", "#2ABCCD", "#954477")

custom_style = Style(
    background=PAGE_BG,
    plot_background=PAGE_BG,
    foreground=INK,
    foreground_strong=INK,
    foreground_subtle=INK_MUTED,
    colors=IMPRINT,
    title_font_size=28,
    label_font_size=18,
    major_label_font_size=18,
    legend_font_size=16,
    value_font_size=14,
    stroke_width=3,
)

# Data: Author-Paper Collaboration Network
authors = ["Smith", "Zhang", "Patel", "Mueller", "Garcia", "Kim", "Okonkwo", "Novak"]
papers = ["P01", "P02", "P03", "P04", "P05", "P06", "P07", "P08", "P09", "P10"]

author_papers = {
    "Smith": ["P01", "P02", "P05"],
    "Zhang": ["P01", "P03", "P07"],
    "Patel": ["P02", "P04", "P06", "P08"],
    "Mueller": ["P03", "P05", "P09"],
    "Garcia": ["P04", "P06", "P10"],
    "Kim": ["P07", "P08", "P09"],
    "Okonkwo": ["P01", "P05", "P10"],
    "Novak": ["P06", "P09", "P10"],
}

# Y positions: both sets span 1–8 so lines cross cleanly
n_authors = len(authors)
n_papers = len(papers)
author_y = {a: float(n_authors - i) for i, a in enumerate(authors)}
paper_y = {p: 1.0 + (n_papers - 1 - i) * (n_authors - 1.0) / (n_papers - 1) for i, p in enumerate(papers)}

AUTHOR_X = 0
PAPER_X = 10

# Chart
chart = pygal.XY(
    style=custom_style,
    width=4800,
    height=2700,
    title="Author–Paper Network · network-bipartite · pygal · anyplot.ai",
    show_x_guides=False,
    show_y_guides=False,
    show_y_labels=False,
    show_x_labels=False,
    dots_size=8,
    legend_at_bottom=True,
    legend_at_bottom_columns=4,
)

# One series per author; each edge is a two-point segment separated by None
for author in authors:
    pts = []
    for paper in author_papers[author]:
        pts.extend(
            [
                {"value": (AUTHOR_X, author_y[author]), "label": author},
                {"value": (PAPER_X, paper_y[paper]), "label": paper},
                None,
            ]
        )
    chart.add(author, pts)

# Save
chart.render_to_png(f"plot-{THEME}.png")
with open(f"plot-{THEME}.html", "wb") as f:
    f.write(chart.render())
Runnable source as JSON, for any HTTP client: https://api.anyplot.ai/specs/network-bipartite/pygal/code. Any spec id and library id listed in llms-full.txt fit the same URL shape; every URL below is complete and callable.
{
  "spec_id": "network-bipartite",
  "language": "python",
  "library": "pygal",
  "page": "https://anyplot.ai/network-bipartite/python/pygal",
  "hub": "https://anyplot.ai/network-bipartite",
  "code_json": "https://api.anyplot.ai/specs/network-bipartite/pygal/code",
  "spec_json": "https://api.anyplot.ai/specs/network-bipartite",
  "render_light_png": "https://storage.googleapis.com/anyplot-images/plots/network-bipartite/python/pygal/plot-light.png",
  "render_dark_png": "https://storage.googleapis.com/anyplot-images/plots/network-bipartite/python/pygal/plot-dark.png",
  "interactive_light_html": "https://storage.googleapis.com/anyplot-images/plots/network-bipartite/python/pygal/plot-light.html",
  "interactive_dark_html": "https://storage.googleapis.com/anyplot-images/plots/network-bipartite/python/pygal/plot-dark.html",
  "quality_score": 79.0,
  "license": "MIT",
  "guide": "https://anyplot.ai/llms.txt"
}
Part of Bipartite Network Graph on anyplot.ai.