The same plot in 14 other libraries — Python: Altair, Bokeh, Matplotlib, Plotly, plotnine, Pygal, Seaborn; R: ggplot2; Julia: Makie.jl; JavaScript: Chart.js, D3.js, Apache ECharts, Highcharts, MUI X Charts. Compare all 15 side by side: Bipartite Network Graph in Python, R, Julia and JavaScript.
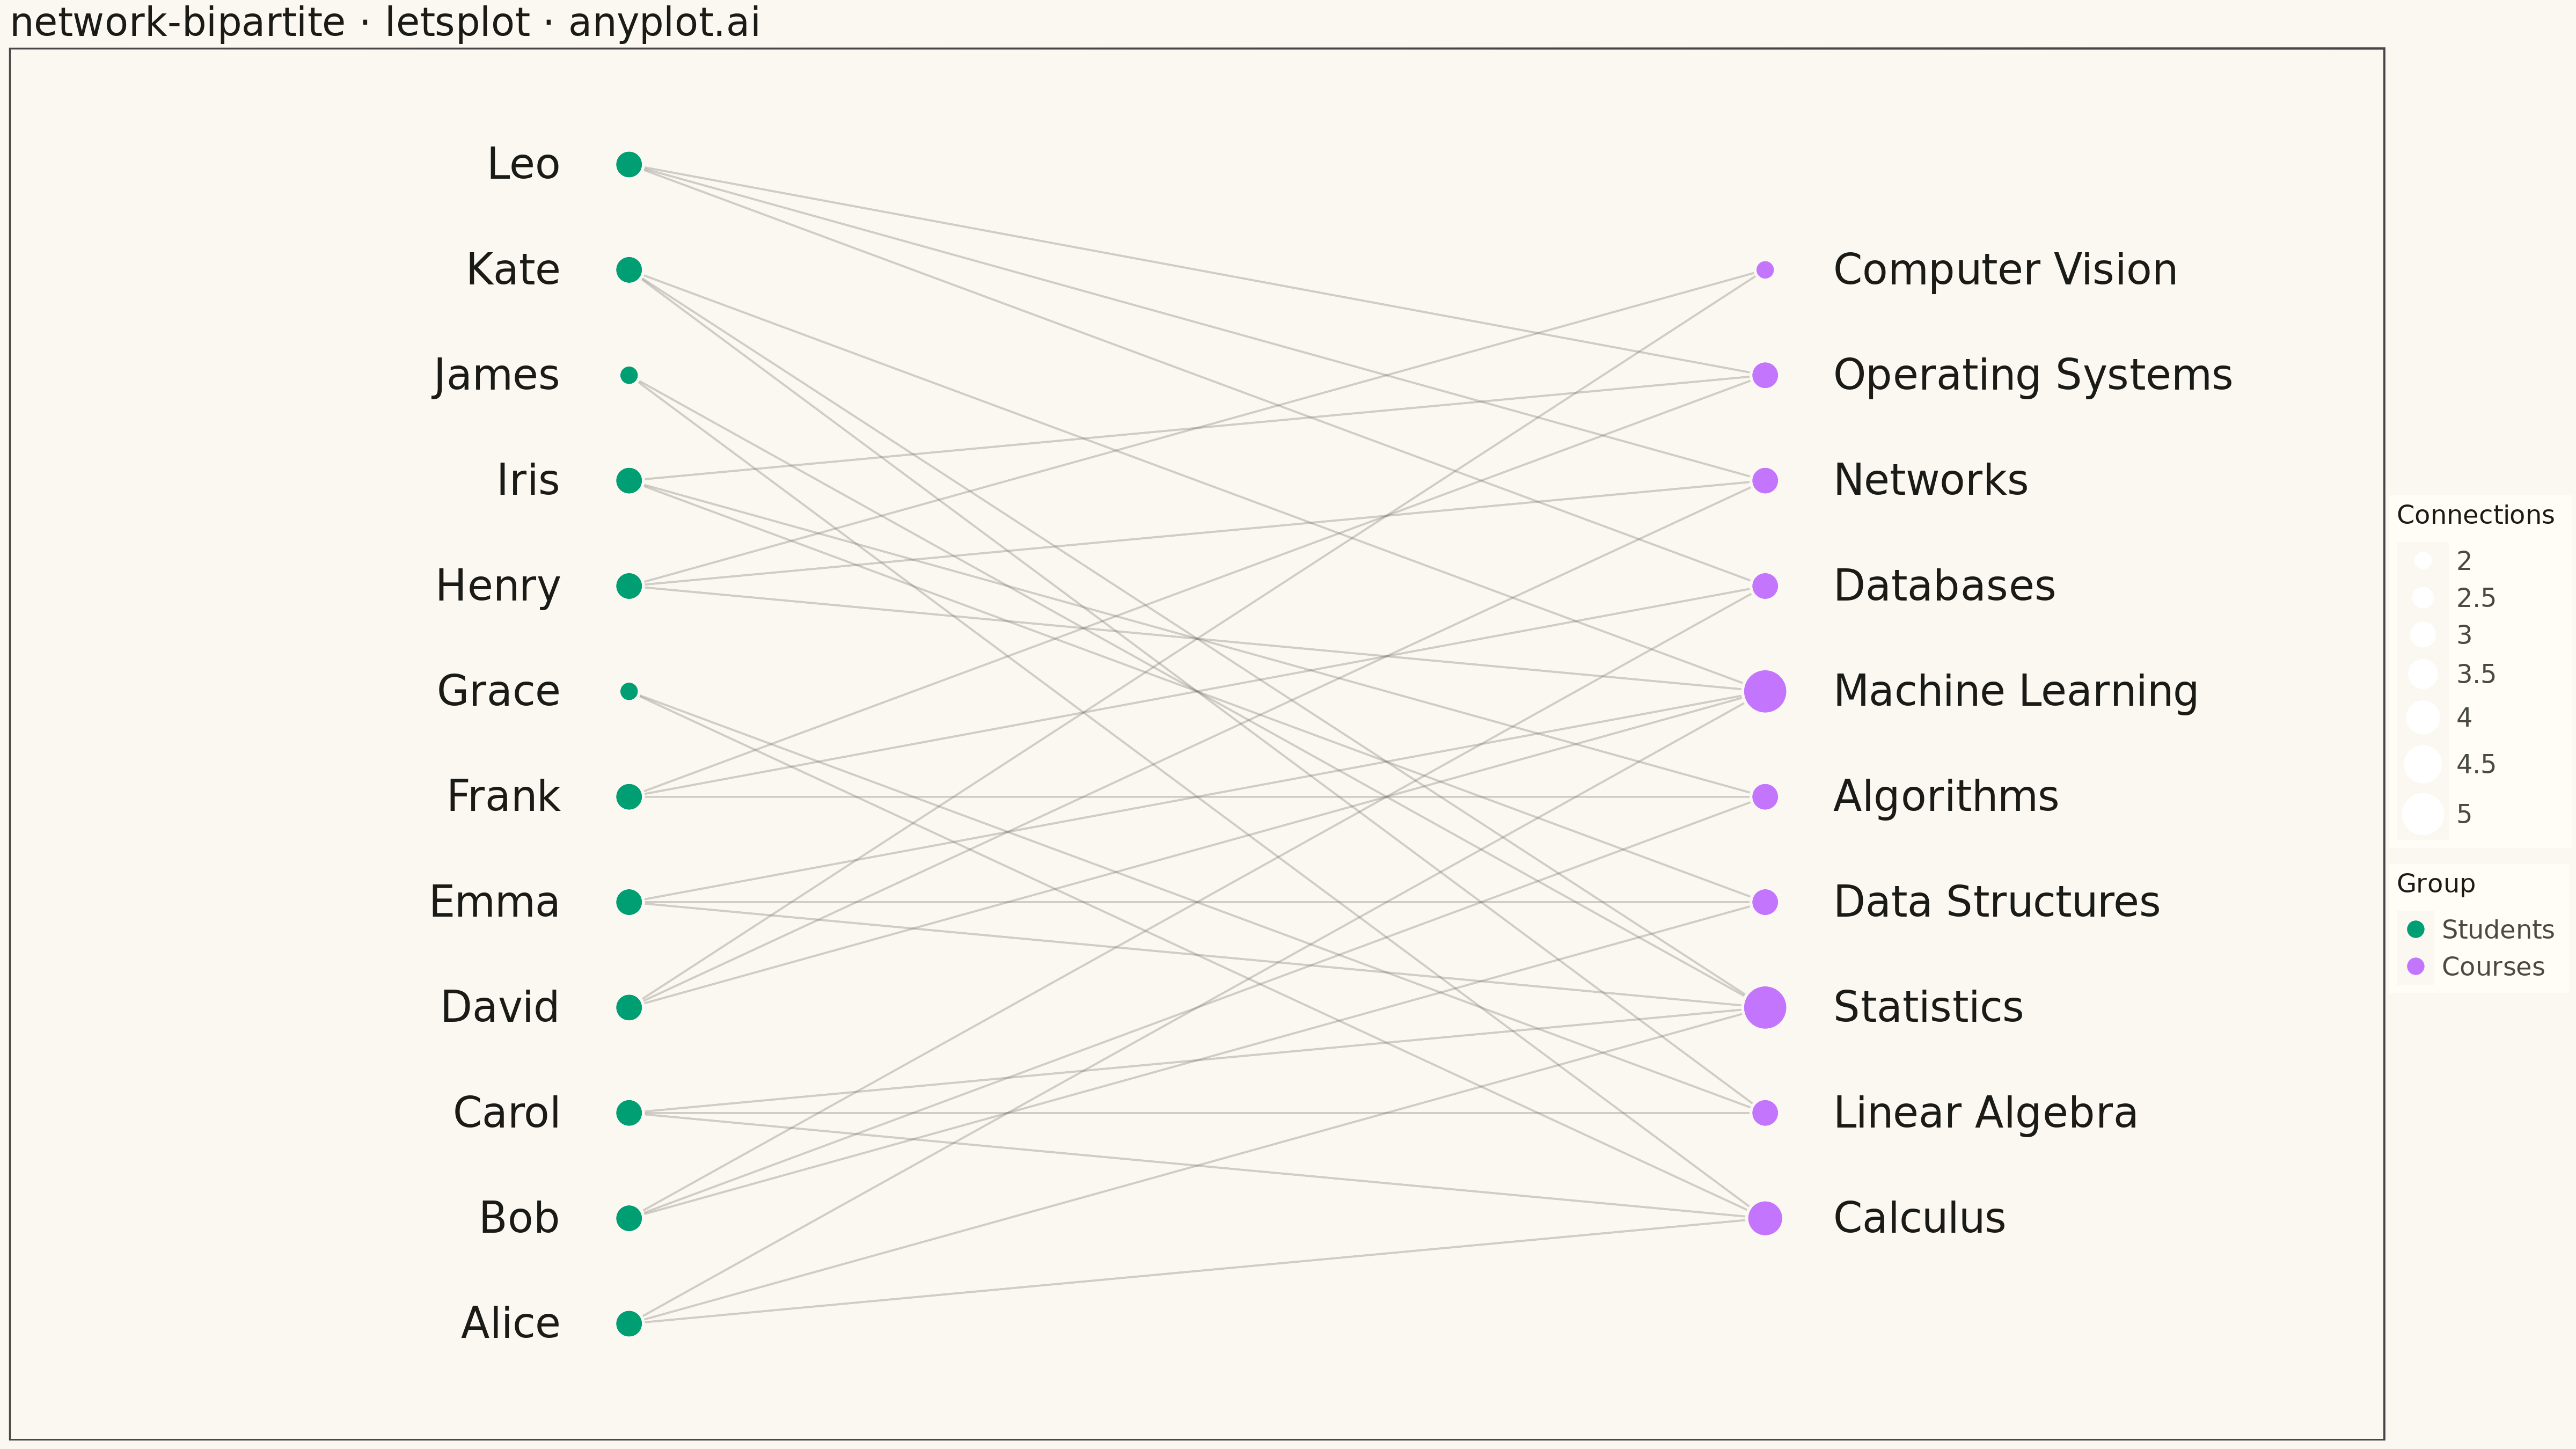
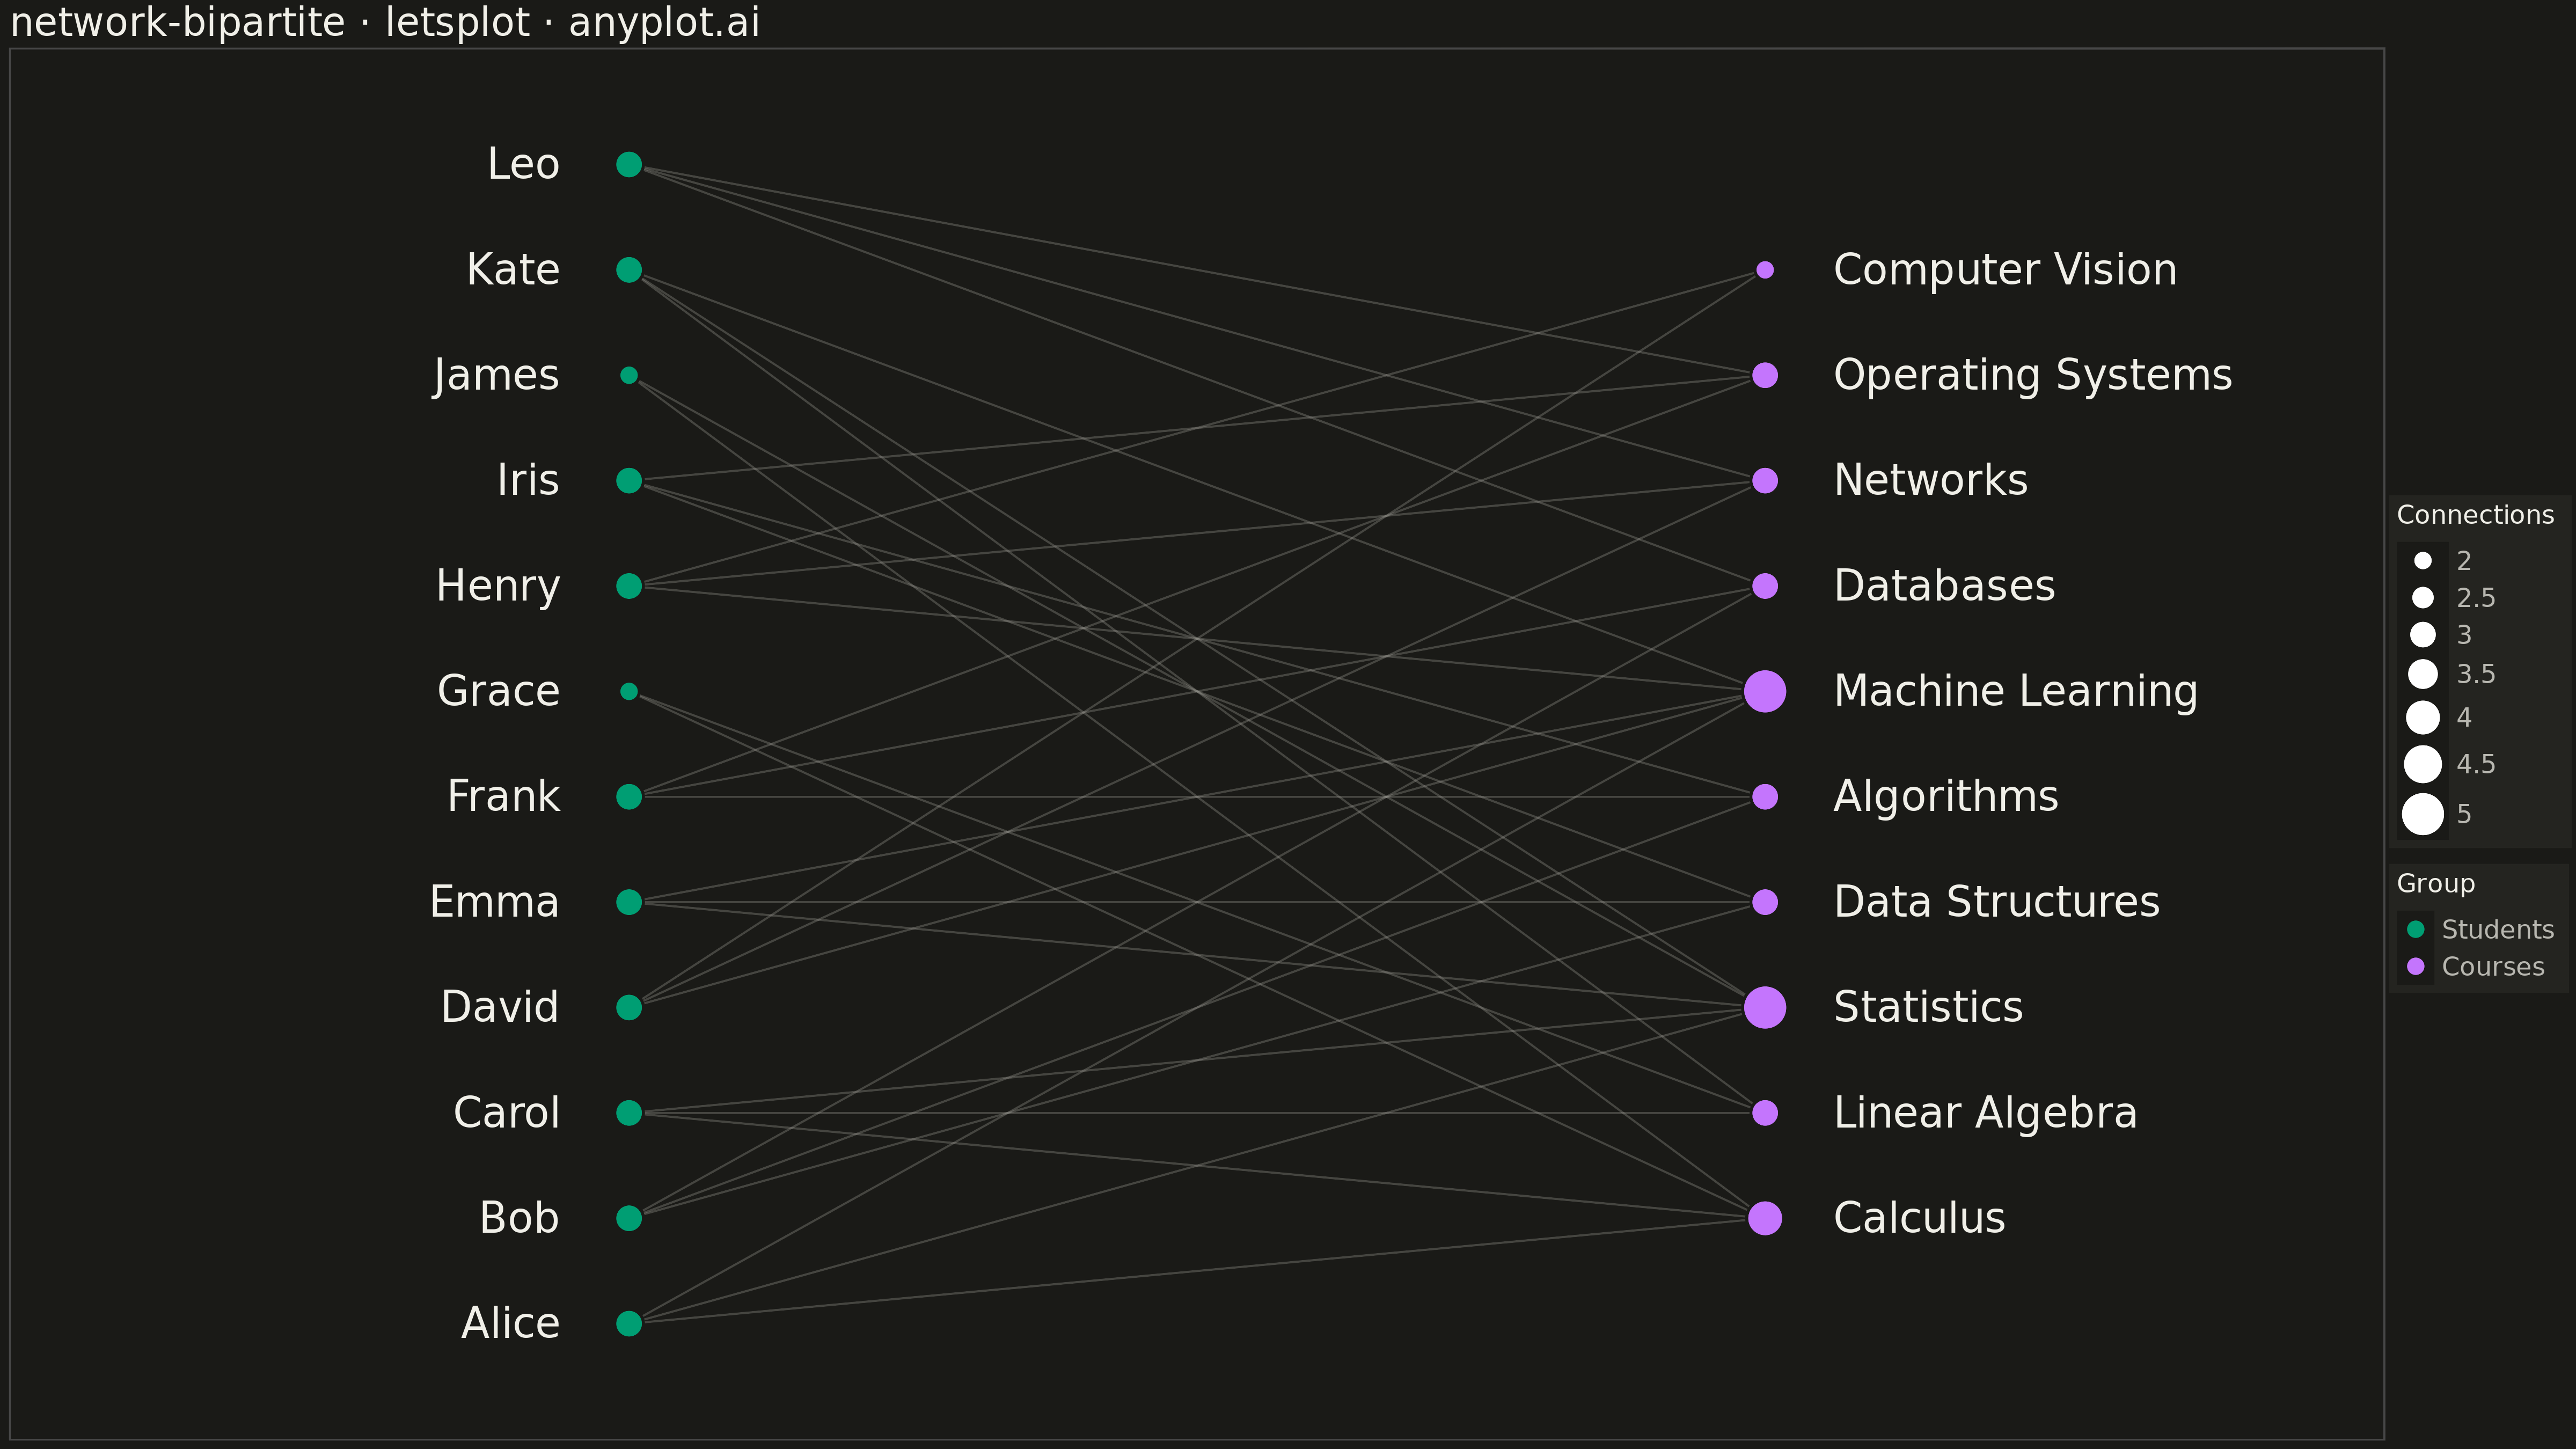
A bipartite network graph visualizes relationships between two distinct sets of entities, where edges only connect nodes from different sets — never within the same set. The two node groups are arranged in separate columns or rows, making the two-mode structure immediately apparent. This layout is fundamental for understanding cross-category relationships, revealing which entities from one set are linked to which entities in the other, and exposing patterns like hubs, clusters, and isolated nodes.
""" anyplot.ai
network-bipartite: Bipartite Network Graph
Library: letsplot 4.9.0 | Python 3.13.13
Quality: 85/100 | Created: 2026-05-14
"""

import os

import pandas as pd
from lets_plot import (
    LetsPlot,
    aes,
    element_blank,
    element_rect,
    element_text,
    geom_point,
    geom_segment,
    geom_text,
    ggplot,
    ggsave,
    ggsize,
    labs,
    scale_fill_manual,
    scale_size,
    theme,
    xlim,
    ylim,
)


LetsPlot.setup_html()

# Theme tokens
THEME = os.getenv("ANYPLOT_THEME", "light")
PAGE_BG = "#FAF8F1" if THEME == "light" else "#1A1A17"
ELEVATED_BG = "#FFFDF6" if THEME == "light" else "#242420"
INK = "#1A1A17" if THEME == "light" else "#F0EFE8"
INK_SOFT = "#4A4A44" if THEME == "light" else "#B8B7B0"
INK_MUTED = "#6B6A63" if THEME == "light" else "#A8A79F"

STUDENT_COLOR = "#009E73"
COURSE_COLOR = "#C475FD"

# Data — student-course enrollment network
students = ["Alice", "Bob", "Carol", "David", "Emma", "Frank", "Grace", "Henry", "Iris", "James", "Kate", "Leo"]
courses = [
    "Calculus",
    "Linear Algebra",
    "Statistics",
    "Data Structures",
    "Algorithms",
    "Machine Learning",
    "Databases",
    "Networks",
    "Operating Systems",
    "Computer Vision",
]

edges_raw = [
    ("Alice", "Calculus"),
    ("Alice", "Statistics"),
    ("Alice", "Machine Learning"),
    ("Bob", "Data Structures"),
    ("Bob", "Algorithms"),
    ("Bob", "Databases"),
    ("Carol", "Calculus"),
    ("Carol", "Linear Algebra"),
    ("Carol", "Statistics"),
    ("David", "Machine Learning"),
    ("David", "Computer Vision"),
    ("David", "Networks"),
    ("Emma", "Statistics"),
    ("Emma", "Machine Learning"),
    ("Emma", "Data Structures"),
    ("Frank", "Algorithms"),
    ("Frank", "Operating Systems"),
    ("Frank", "Databases"),
    ("Grace", "Calculus"),
    ("Grace", "Linear Algebra"),
    ("Henry", "Machine Learning"),
    ("Henry", "Networks"),
    ("Henry", "Computer Vision"),
    ("Iris", "Data Structures"),
    ("Iris", "Algorithms"),
    ("Iris", "Operating Systems"),
    ("James", "Calculus"),
    ("James", "Statistics"),
    ("Kate", "Machine Learning"),
    ("Kate", "Statistics"),
    ("Kate", "Linear Algebra"),
    ("Leo", "Databases"),
    ("Leo", "Networks"),
    ("Leo", "Operating Systems"),
]

# Compute node degrees
student_degree = dict.fromkeys(students, 0)
course_degree = dict.fromkeys(courses, 0)
for s, c in edges_raw:
    student_degree[s] += 1
    course_degree[c] += 1

# Vertical positions: students at x=0, courses at x=1 (vertically centered)
n_students = len(students)
n_courses = len(courses)
course_offset = (n_students - 1 - (n_courses - 1)) / 2.0  # = 1.0

student_y = {s: float(i) for i, s in enumerate(students)}
course_y = {c: float(i) + course_offset for i, c in enumerate(courses)}

# Edge dataframe
edges_df = pd.DataFrame(edges_raw, columns=["student", "course"])
edges_df["x"] = 0.0
edges_df["y"] = edges_df["student"].map(student_y)
edges_df["xend"] = 1.0
edges_df["yend"] = edges_df["course"].map(course_y)

# Node dataframes (separate for label positioning)
student_nodes = pd.DataFrame(
    {
        "name": students,
        "x": 0.0,
        "x_label": -0.06,
        "y": [student_y[s] for s in students],
        "group": "Students",
        "degree": [student_degree[s] for s in students],
    }
)
course_nodes = pd.DataFrame(
    {
        "name": courses,
        "x": 1.0,
        "x_label": 1.06,
        "y": [course_y[c] for c in courses],
        "group": "Courses",
        "degree": [course_degree[c] for c in courses],
    }
)
nodes_df = pd.concat([student_nodes, course_nodes], ignore_index=True)

# Theme
anyplot_theme = theme(
    plot_background=element_rect(fill=PAGE_BG, color=PAGE_BG),
    panel_background=element_rect(fill=PAGE_BG),
    panel_grid_major=element_blank(),
    panel_grid_minor=element_blank(),
    axis_title=element_blank(),
    axis_text=element_blank(),
    axis_ticks=element_blank(),
    axis_line=element_blank(),
    plot_title=element_text(color=INK, size=24),
    legend_background=element_rect(fill=ELEVATED_BG, color=INK_SOFT),
    legend_text=element_text(color=INK_SOFT, size=16),
    legend_title=element_text(color=INK, size=16),
)

title = "network-bipartite · letsplot · anyplot.ai"

# Plot
plot = (
    ggplot()
    + geom_segment(
        data=edges_df, mapping=aes(x="x", y="y", xend="xend", yend="yend"), color=INK_MUTED, alpha=0.3, size=0.5
    )
    + geom_point(data=nodes_df, mapping=aes(x="x", y="y", fill="group", size="degree"), color=PAGE_BG, shape=21)
    + geom_text(data=student_nodes, mapping=aes(x="x_label", y="y", label="name"), hjust=1, color=INK, size=13)
    + geom_text(data=course_nodes, mapping=aes(x="x_label", y="y", label="name"), hjust=0, color=INK, size=13)
    + scale_fill_manual(values={"Students": STUDENT_COLOR, "Courses": COURSE_COLOR})
    + scale_size(range=[5, 12], name="Connections")
    + labs(title=title, fill="Group")
    + anyplot_theme
    + ggsize(1600, 900)
    + xlim(-0.45, 1.45)
    + ylim(-0.5, float(n_students) - 0.5)
)

# Save
ggsave(plot, f"plot-{THEME}.png", path=".", scale=3)
ggsave(plot, f"plot-{THEME}.html", path=".")
Runnable source as JSON, for any HTTP client: https://api.anyplot.ai/specs/network-bipartite/letsplot/code. Any spec id and library id listed in llms-full.txt fit the same URL shape; every URL below is complete and callable.
{
  "spec_id": "network-bipartite",
  "language": "python",
  "library": "letsplot",
  "page": "https://anyplot.ai/network-bipartite/python/letsplot",
  "hub": "https://anyplot.ai/network-bipartite",
  "code_json": "https://api.anyplot.ai/specs/network-bipartite/letsplot/code",
  "spec_json": "https://api.anyplot.ai/specs/network-bipartite",
  "render_light_png": "https://storage.googleapis.com/anyplot-images/plots/network-bipartite/python/letsplot/plot-light.png",
  "render_dark_png": "https://storage.googleapis.com/anyplot-images/plots/network-bipartite/python/letsplot/plot-dark.png",
  "interactive_light_html": "https://storage.googleapis.com/anyplot-images/plots/network-bipartite/python/letsplot/plot-light.html",
  "interactive_dark_html": "https://storage.googleapis.com/anyplot-images/plots/network-bipartite/python/letsplot/plot-dark.html",
  "quality_score": 85.0,
  "license": "MIT",
  "guide": "https://anyplot.ai/llms.txt"
}
Part of Bipartite Network Graph on anyplot.ai.