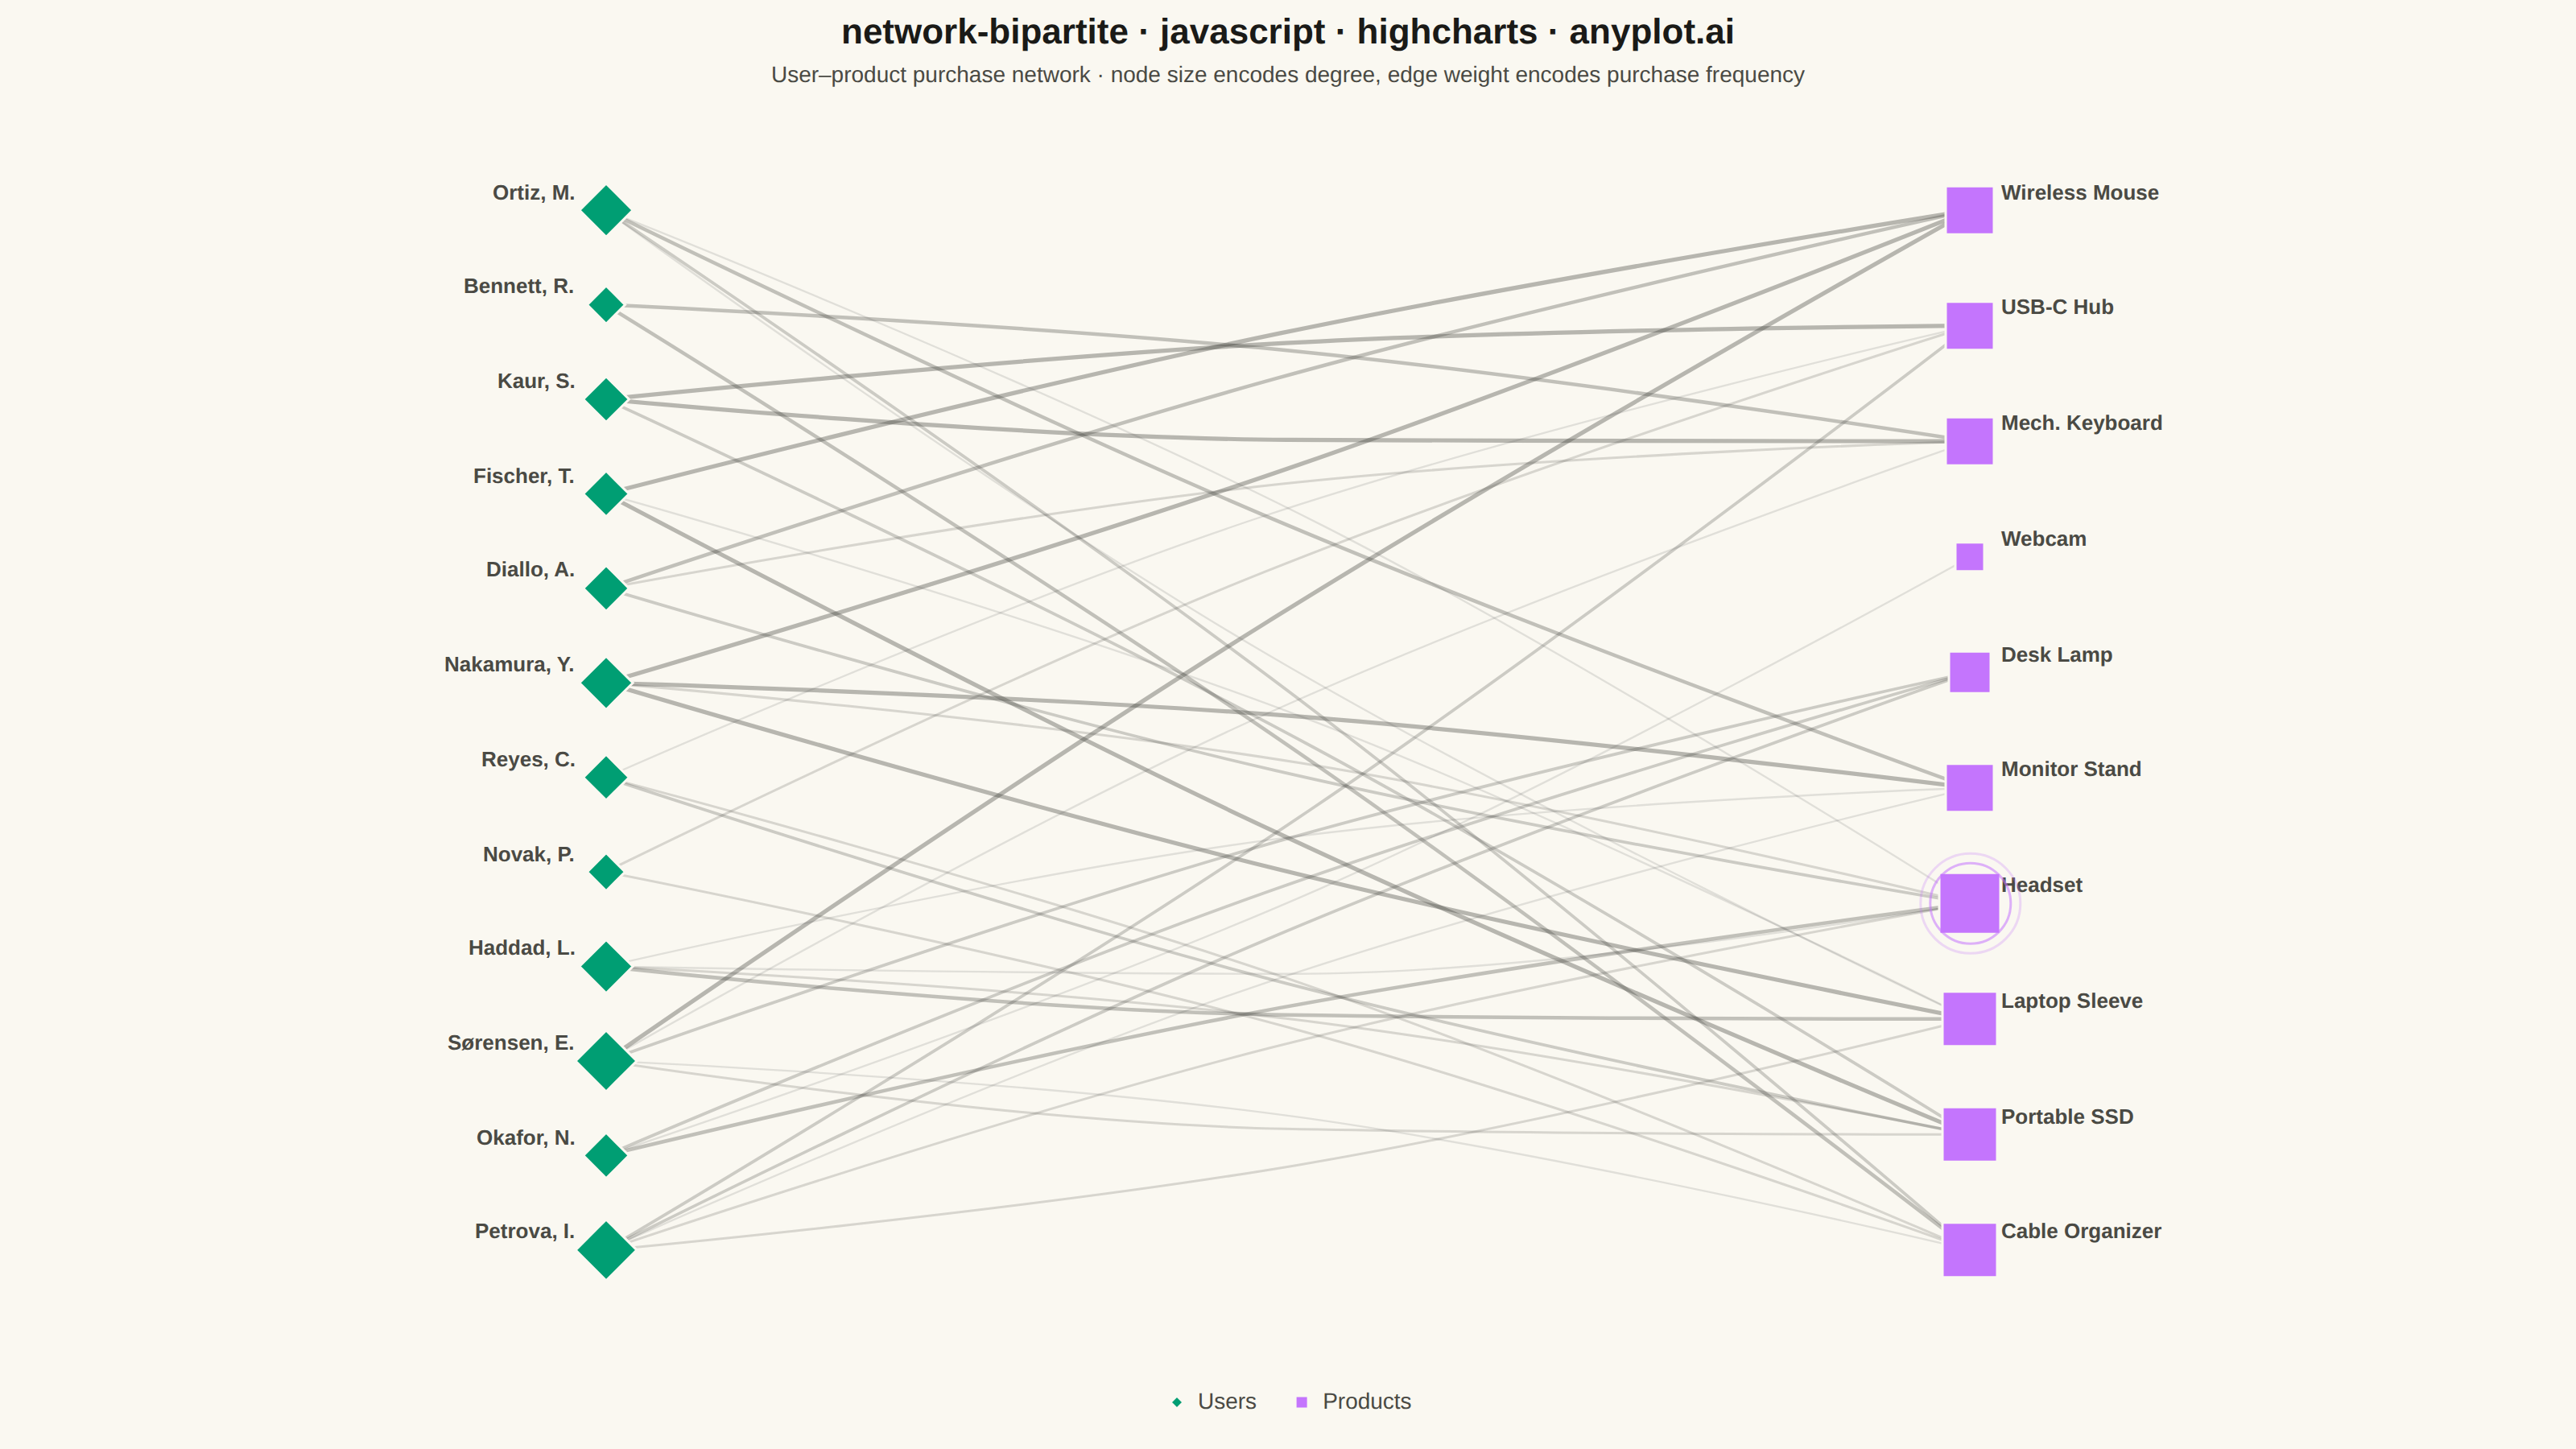
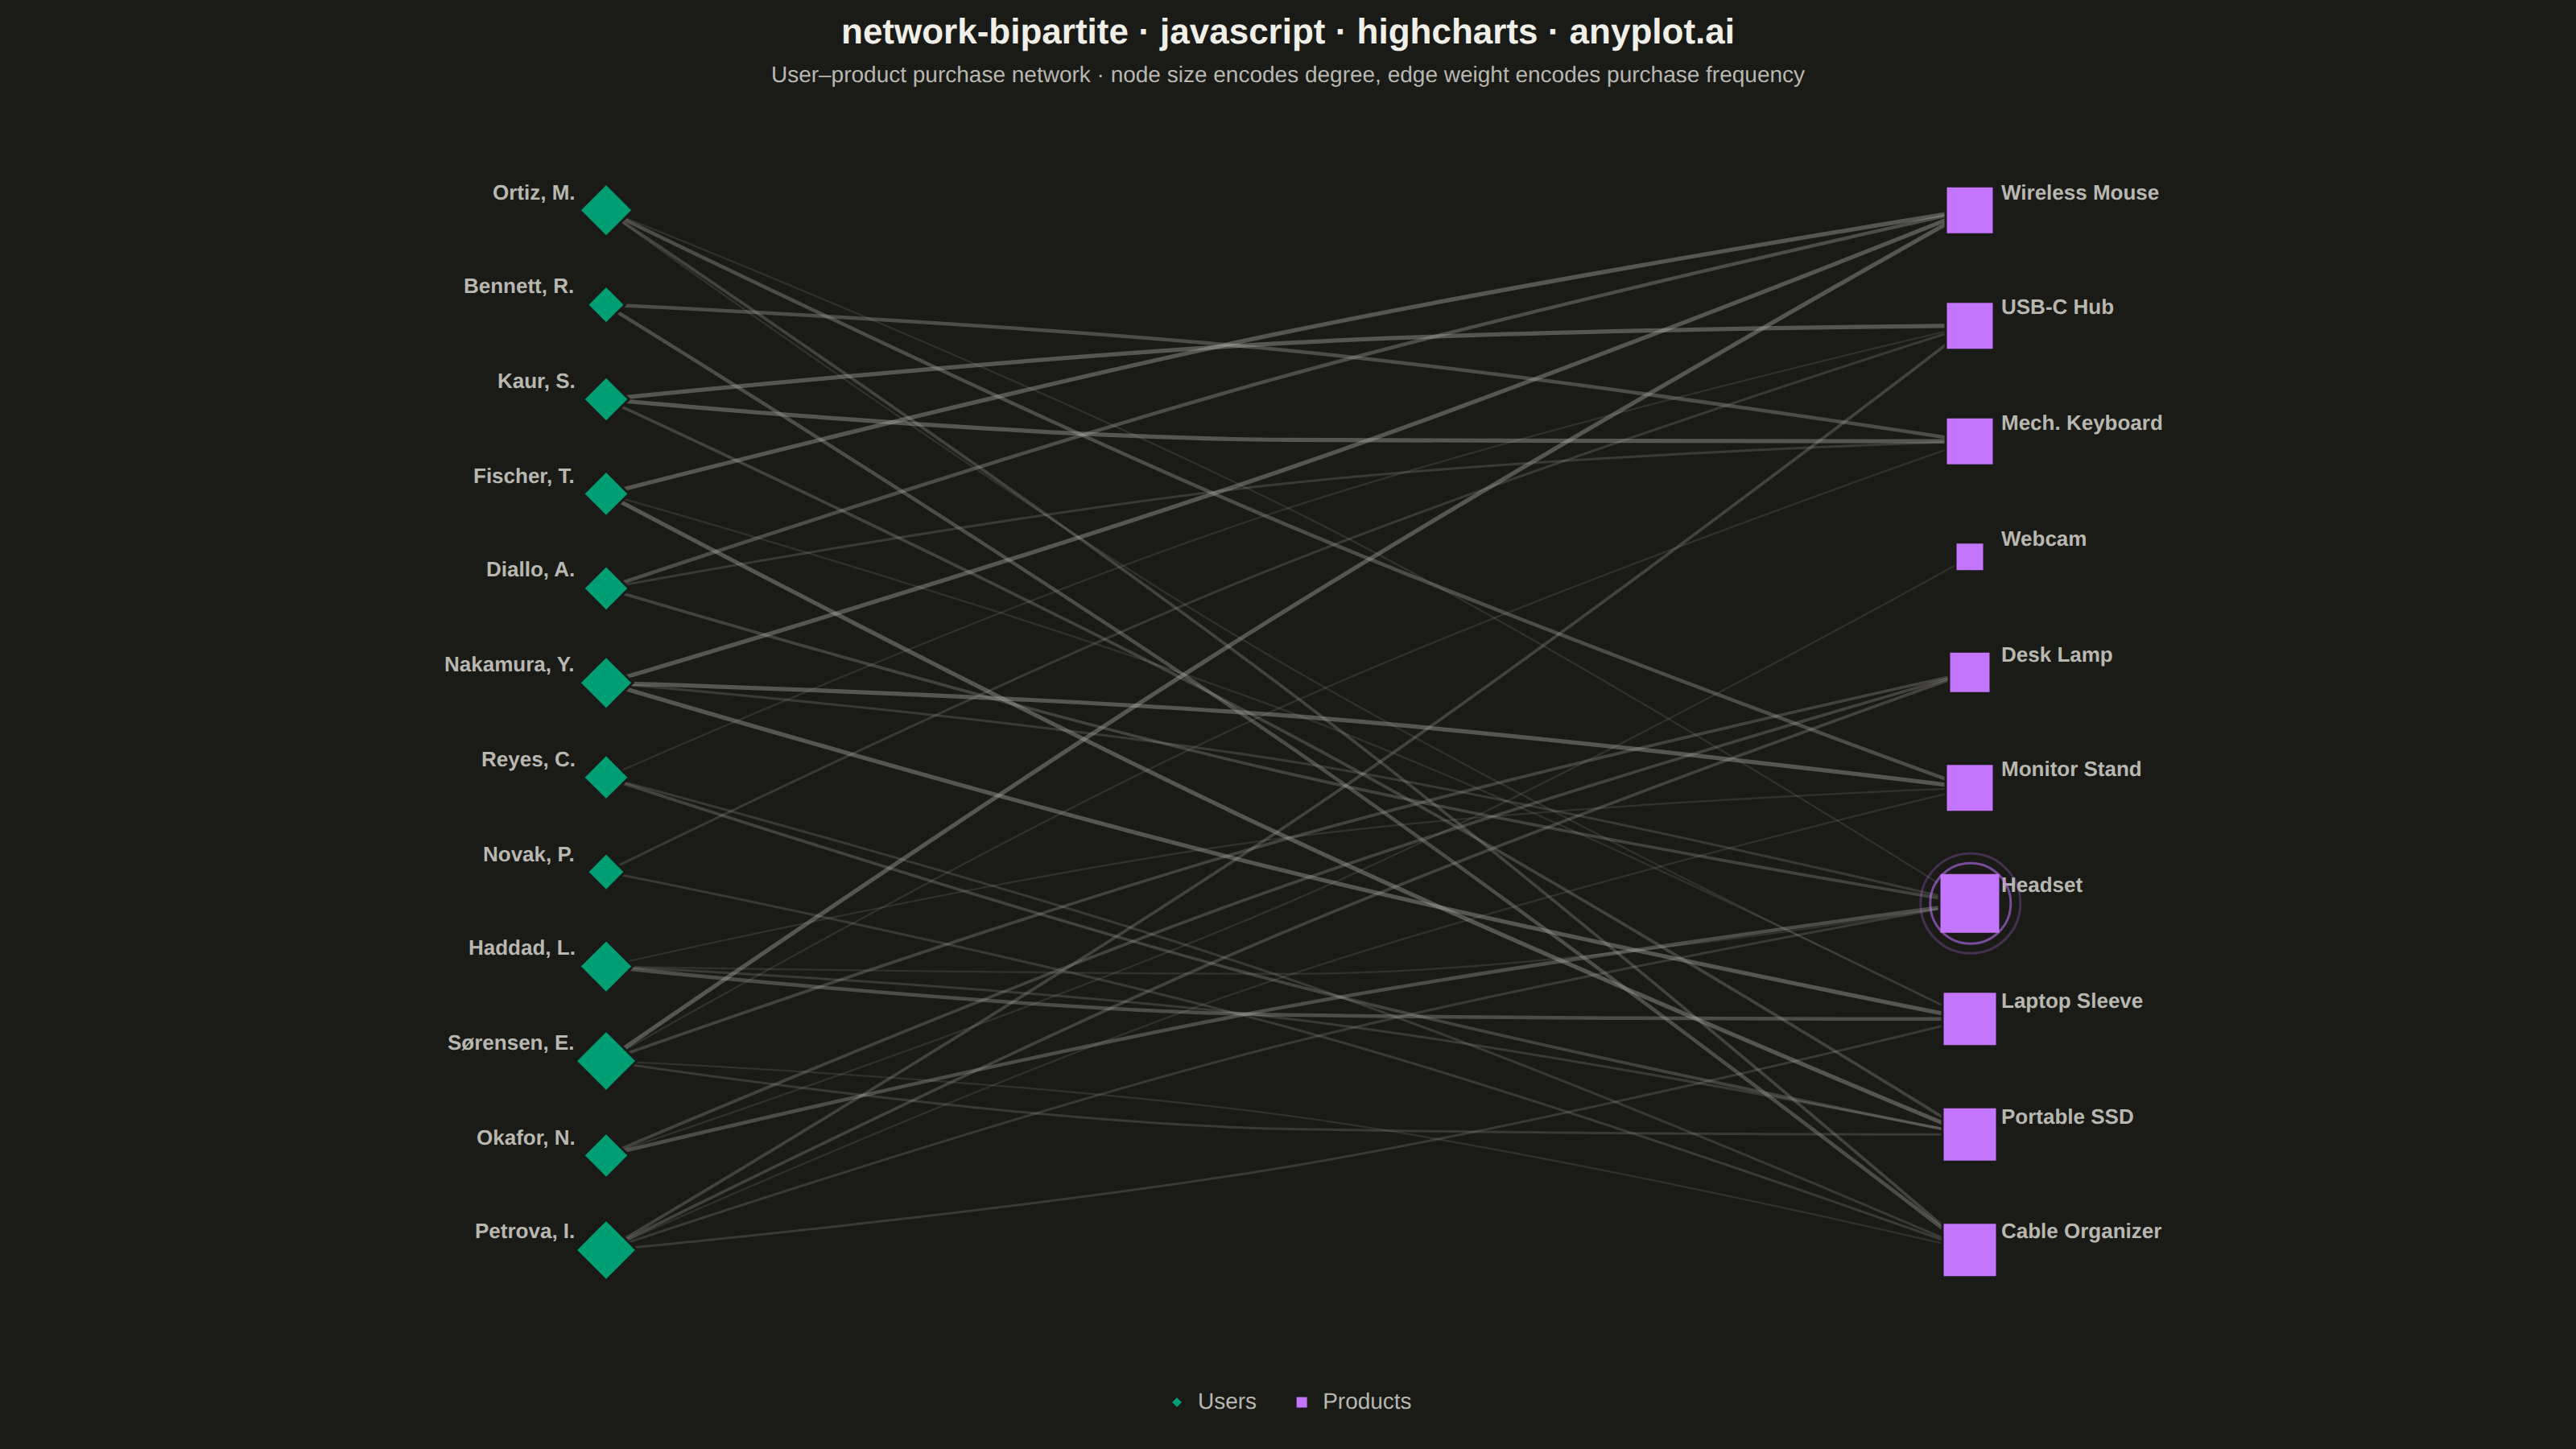
The same plot in 14 other libraries — JavaScript: Chart.js, D3.js, Apache ECharts, MUI X Charts; Python: Altair, Bokeh, lets-plot, Matplotlib, Plotly, plotnine, Pygal, Seaborn; R: ggplot2; Julia: Makie.jl. Compare all 15 side by side: Bipartite Network Graph in Python, R, Julia and JavaScript.
A bipartite network graph visualizes relationships between two distinct sets of entities, where edges only connect nodes from different sets — never within the same set. The two node groups are arranged in separate columns or rows, making the two-mode structure immediately apparent. This layout is fundamental for understanding cross-category relationships, revealing which entities from one set are linked to which entities in the other, and exposing patterns like hubs, clusters, and isolated nodes.
// anyplot.ai
// network-bipartite: Bipartite Network Graph
// Library: highcharts 12.6.0 | JavaScript 22.23.2
// Quality: 91/100 | Created: 2026-09-05

//# anyplot-orientation: landscape
const t = window.ANYPLOT_TOKENS;

// --- Deterministic tiny LCG (no seeded RNG in the browser) ------------------
let seed = 42;
function rand() {
  seed = (seed * 1103515245 + 12345) & 0x7fffffff;
  return seed / 0x7fffffff;
}
function randInt(min, max) {
  return Math.floor(rand() * (max - min + 1)) + min;
}

// --- Data: user -> product purchase network ---------------------------------
const users = [
  "Ortiz, M.",
  "Bennett, R.",
  "Kaur, S.",
  "Fischer, T.",
  "Diallo, A.",
  "Nakamura, Y.",
  "Reyes, C.",
  "Novak, P.",
  "Haddad, L.",
  "Sørensen, E.",
  "Okafor, N.",
  "Petrova, I.",
];
const products = [
  "Wireless Mouse",
  "USB-C Hub",
  "Mech. Keyboard",
  "Webcam",
  "Desk Lamp",
  "Monitor Stand",
  "Headset",
  "Laptop Sleeve",
  "Portable SSD",
  "Cable Organizer",
];

const edges = [];
users.forEach((u) => {
  const n = randInt(2, 5);
  const picked = new Set();
  while (picked.size < n) picked.add(randInt(0, products.length - 1));
  picked.forEach((pi) => {
    edges.push({ source: u, target: products[pi], weight: randInt(1, 5) });
  });
});

// --- Node degree + two-column layout ----------------------------------------
const degreeA = Object.fromEntries(users.map((u) => [u, 0]));
const degreeB = Object.fromEntries(products.map((p) => [p, 0]));
edges.forEach((e) => {
  degreeA[e.source] += 1;
  degreeB[e.target] += 1;
});

function layout(names, x) {
  const n = names.length;
  return names.map((name, i) => ({
    name,
    x,
    y: n === 1 ? 0.5 : 1 - i / (n - 1),
  }));
}
const nodesA = layout(users, 0.06);
const nodesB = layout(products, 0.94);
const posOf = {};
nodesA.forEach((d) => (posOf[d.name] = d));
nodesB.forEach((d) => (posOf[d.name] = d));

const maxDegA = Math.max(...Object.values(degreeA));
const maxDegB = Math.max(...Object.values(degreeB));
function nodeRadius(deg, maxDeg) {
  return 7 + (deg / maxDeg) * 12;
}

// --- Hub node: highest-degree node across both sets, highlighted below ------
let hubNode = null;
let hubDegree = -1;
nodesA.forEach((d) => {
  if (degreeA[d.name] > hubDegree) {
    hubDegree = degreeA[d.name];
    hubNode = { ...d, isUser: true };
  }
});
nodesB.forEach((d) => {
  if (degreeB[d.name] > hubDegree) {
    hubDegree = degreeB[d.name];
    hubNode = { ...d, isUser: false };
  }
});
const hubColor = hubNode.isUser ? t.palette[0] : t.palette[1];
const hubRadius = hubNode.isUser
  ? nodeRadius(degreeA[hubNode.name], maxDegA)
  : nodeRadius(degreeB[hubNode.name], maxDegB);

// --- Edge series: one gently bowed spline per edge (drawn beneath nodes) ----
// A slight perpendicular bend (alternating by index) separates edges that
// would otherwise stack into straight overlapping segments in the crossing
// zone, and doubles as a distinctive Highcharts touch beyond a plain line.
const edgeSeries = edges.map((e, i) => {
  const s = posOf[e.source];
  const dst = posOf[e.target];
  const mx = (s.x + dst.x) / 2;
  const my = (s.y + dst.y) / 2;
  const dx = dst.x - s.x;
  const dy = dst.y - s.y;
  const len = Math.hypot(dx, dy) || 1;
  const bend = (0.03 * (((i % 3) - 1) || 1)) / (0.6 + e.weight / 5);
  const cx = mx + (-dy / len) * bend;
  const cy = my + (dx / len) * bend;
  return {
    type: "spline",
    data: [
      [s.x, s.y],
      [cx, cy],
      [dst.x, dst.y],
    ],
    color: t.inkSoft,
    opacity: 0.08 + (e.weight / 5) * 0.3,
    lineWidth: 0.8 + (e.weight / 5) * 1.8,
    marker: { enabled: false },
    enableMouseTracking: false,
    showInLegend: false,
  };
});

// --- Node series: scatter, color = set membership, size = degree -----------
const userSeries = {
  type: "scatter",
  name: "Users",
  color: t.palette[0],
  data: nodesA.map((d) => ({
    x: d.x,
    y: d.y,
    name: d.name,
    marker: { radius: nodeRadius(degreeA[d.name], maxDegA) },
  })),
  marker: { lineColor: t.pageBg, lineWidth: 1.5 },
  dataLabels: {
    enabled: true,
    format: "{point.name}",
    align: "right",
    x: -14,
    style: { color: t.inkSoft, fontSize: "13px", textOutline: "none" },
  },
};

const productSeries = {
  type: "scatter",
  name: "Products",
  color: t.palette[1],
  data: nodesB.map((d) => ({
    x: d.x,
    y: d.y,
    name: d.name,
    marker: { radius: nodeRadius(degreeB[d.name], maxDegB) },
  })),
  marker: { lineColor: t.pageBg, lineWidth: 1.5 },
  dataLabels: {
    enabled: true,
    format: "{point.name}",
    align: "left",
    x: 14,
    style: { color: t.inkSoft, fontSize: "13px", textOutline: "none" },
  },
};

// --- Chart -------------------------------------------------------------------
Highcharts.chart("container", {
  chart: {
    type: "scatter",
    backgroundColor: "transparent",
    animation: false,
    style: { fontFamily: "inherit" },
    events: {
      // Distinctive Highcharts touch: a renderer-drawn double halo gives the
      // busiest hub a clear focal point instead of relying on size alone.
      load() {
        const chart = this;
        const px = chart.xAxis[0].toPixels(hubNode.x);
        const py = chart.yAxis[0].toPixels(hubNode.y);

        [hubRadius + 6, hubRadius + 12].forEach((r, i) => {
          chart.renderer
            .circle(px, py, r)
            .attr({
              fill: "none",
              stroke: hubColor,
              "stroke-width": 1.5,
              opacity: i === 0 ? 0.55 : 0.25,
              zIndex: 6,
            })
            .add();
        });
      },
    },
  },
  credits: { enabled: false },
  colors: t.palette,
  title: {
    text: "network-bipartite · javascript · highcharts · anyplot.ai",
    style: { color: t.ink, fontSize: "22px", fontWeight: "600" },
  },
  subtitle: {
    text: "User–product purchase network · node size encodes degree, edge weight encodes purchase frequency",
    style: { color: t.inkSoft, fontSize: "14px" },
  },
  xAxis: { visible: false, min: -0.32, max: 1.32 },
  yAxis: { visible: false, min: -0.06, max: 1.06, title: { text: null } },
  legend: {
    enabled: true,
    itemStyle: { color: t.inkSoft, fontSize: "14px" },
    itemHoverStyle: { color: t.ink },
  },
  tooltip: { enabled: false },
  plotOptions: {
    series: { animation: false, states: { hover: { enabled: false } } },
  },
  series: [...edgeSeries, userSeries, productSeries],
});
Runnable source as JSON, for any HTTP client: https://api.anyplot.ai/specs/network-bipartite/highcharts/code. Any spec id and library id listed in llms-full.txt fit the same URL shape; every URL below is complete and callable.
{
  "spec_id": "network-bipartite",
  "language": "javascript",
  "library": "highcharts",
  "page": "https://anyplot.ai/network-bipartite/javascript/highcharts",
  "hub": "https://anyplot.ai/network-bipartite",
  "code_json": "https://api.anyplot.ai/specs/network-bipartite/highcharts/code",
  "spec_json": "https://api.anyplot.ai/specs/network-bipartite",
  "render_light_png": "https://storage.googleapis.com/anyplot-images/plots/network-bipartite/javascript/highcharts/plot-light.png",
  "render_dark_png": "https://storage.googleapis.com/anyplot-images/plots/network-bipartite/javascript/highcharts/plot-dark.png",
  "interactive_light_html": "https://storage.googleapis.com/anyplot-images/plots/network-bipartite/javascript/highcharts/plot-light.html",
  "interactive_dark_html": "https://storage.googleapis.com/anyplot-images/plots/network-bipartite/javascript/highcharts/plot-dark.html",
  "quality_score": 91.0,
  "license": "MIT",
  "guide": "https://anyplot.ai/llms.txt"
}
Part of Bipartite Network Graph on anyplot.ai.