The same plot in 14 other libraries — JavaScript: D3.js, Apache ECharts, Highcharts, MUI X Charts; Python: Altair, Bokeh, lets-plot, Matplotlib, Plotly, plotnine, Pygal, Seaborn; R: ggplot2; Julia: Makie.jl. Compare all 15 side by side: Bipartite Network Graph in Python, R, Julia and JavaScript.
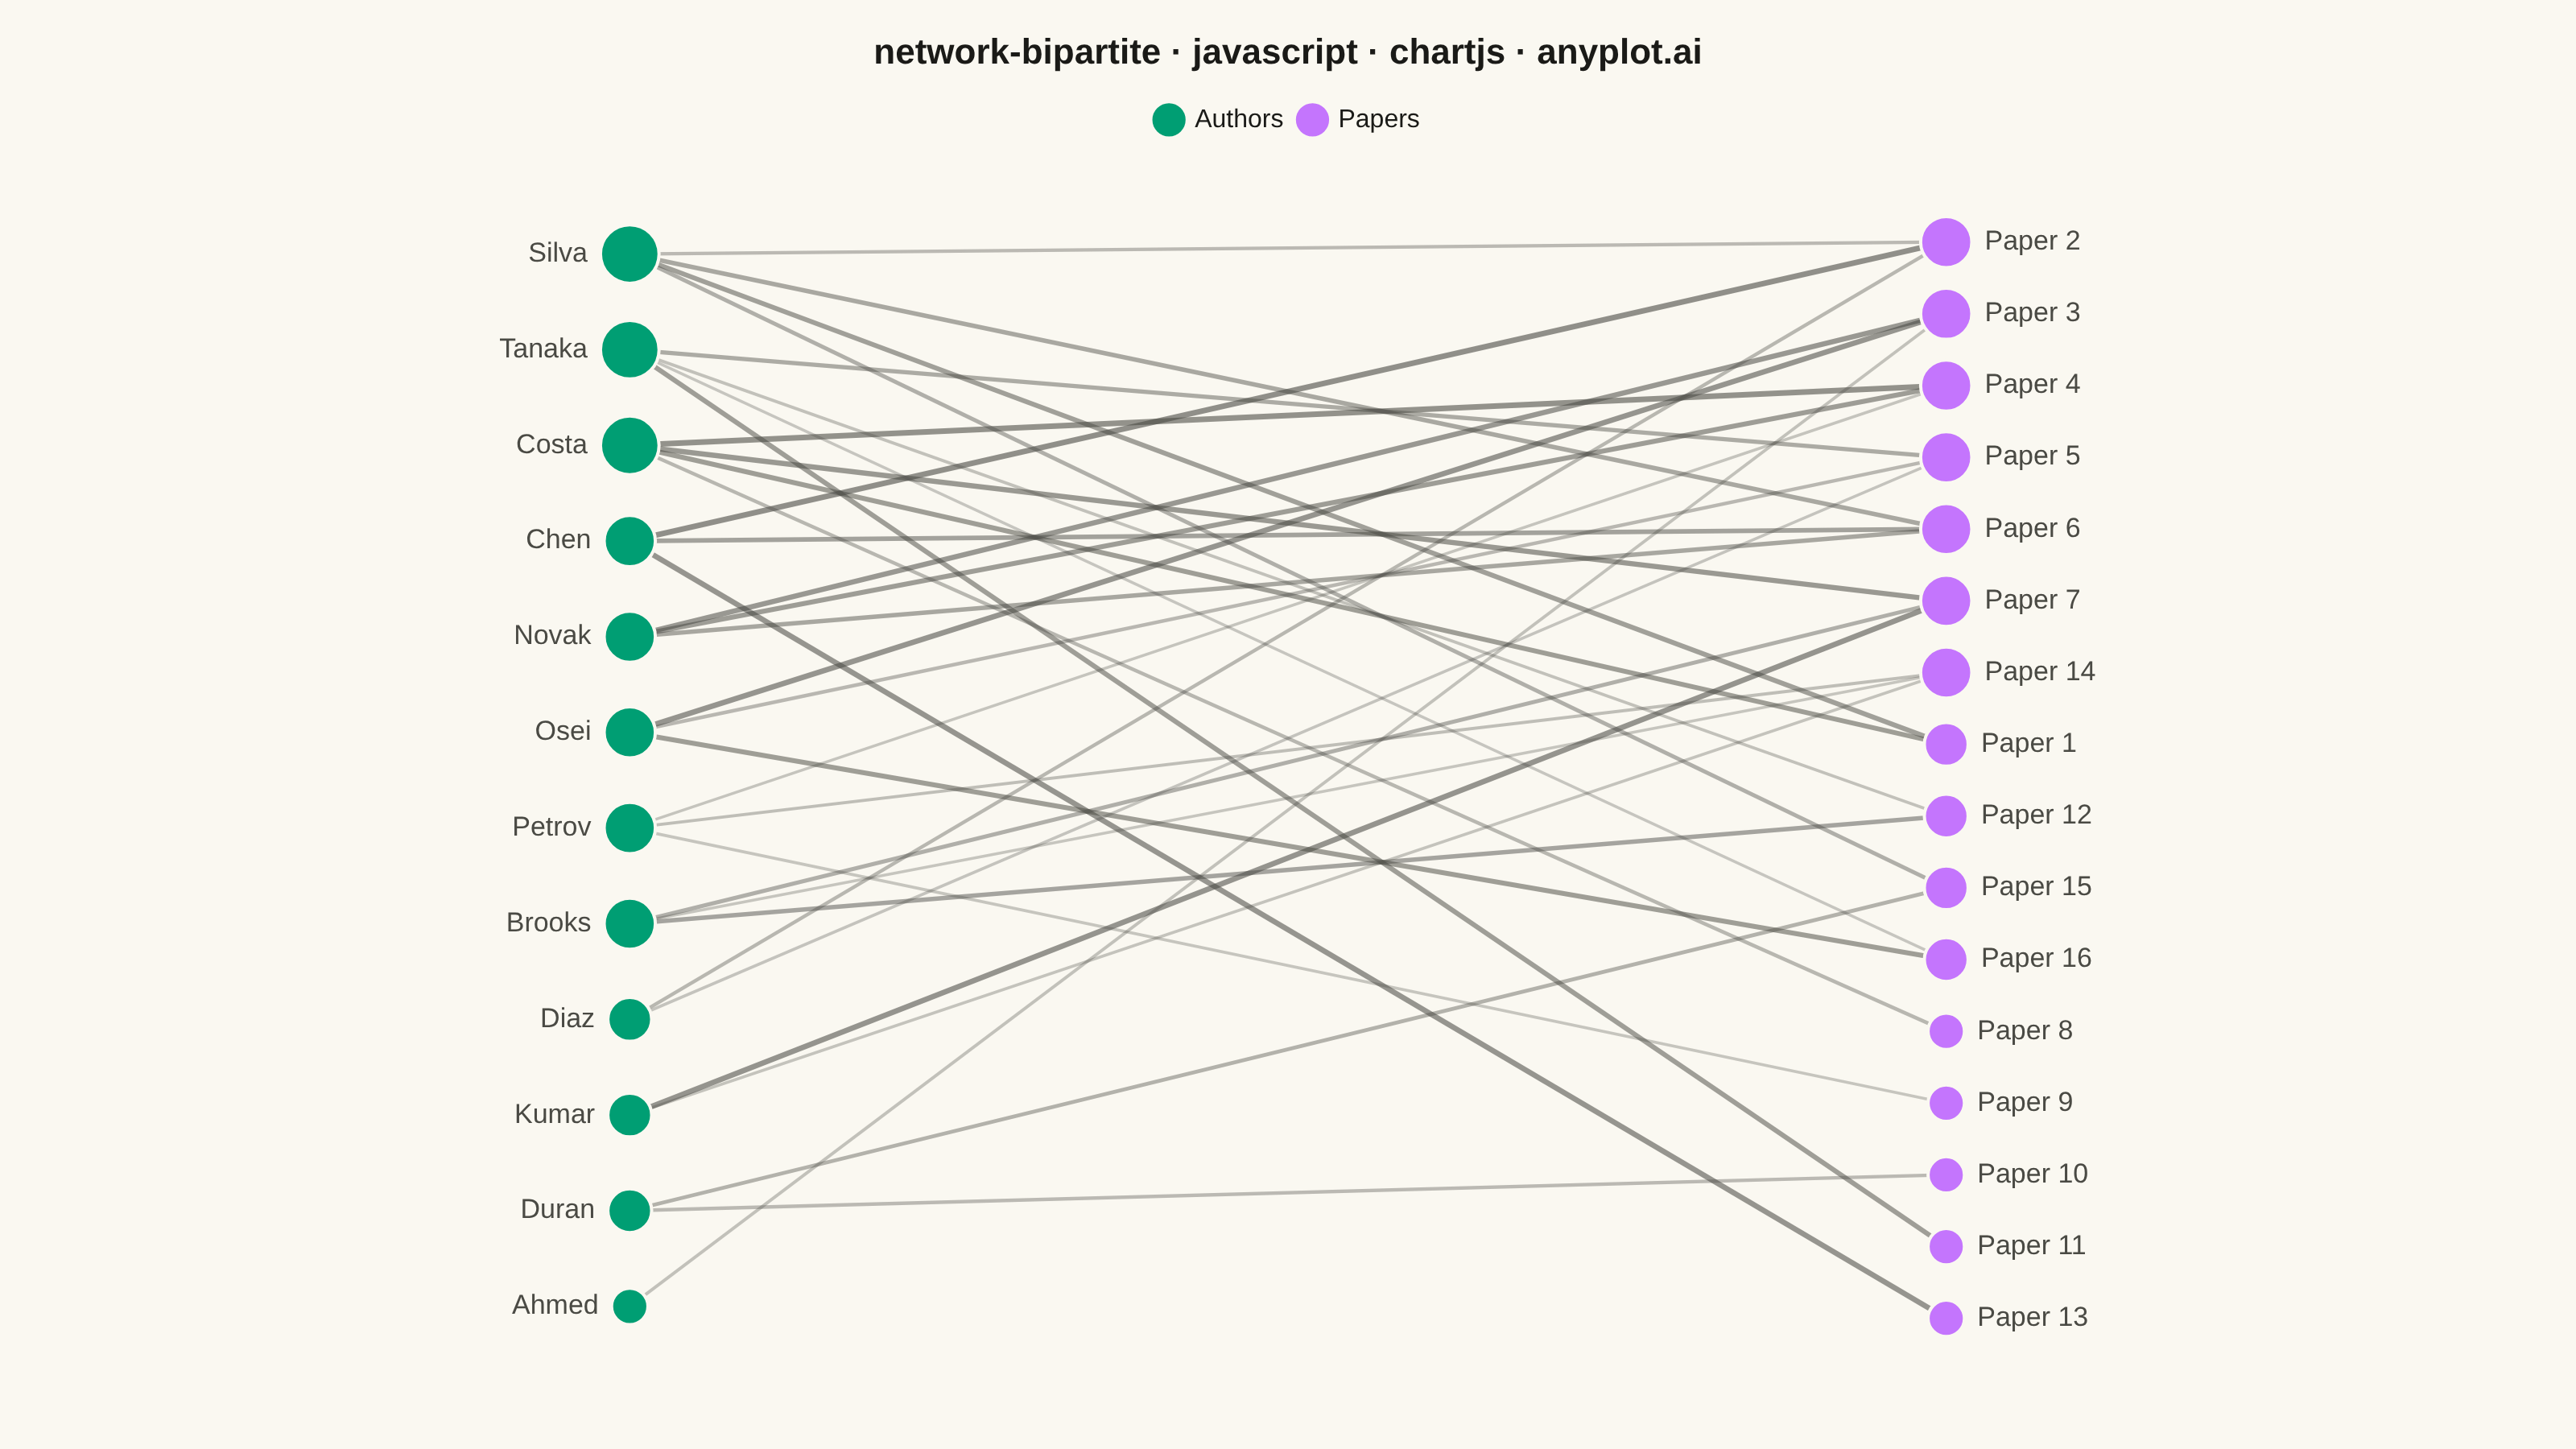
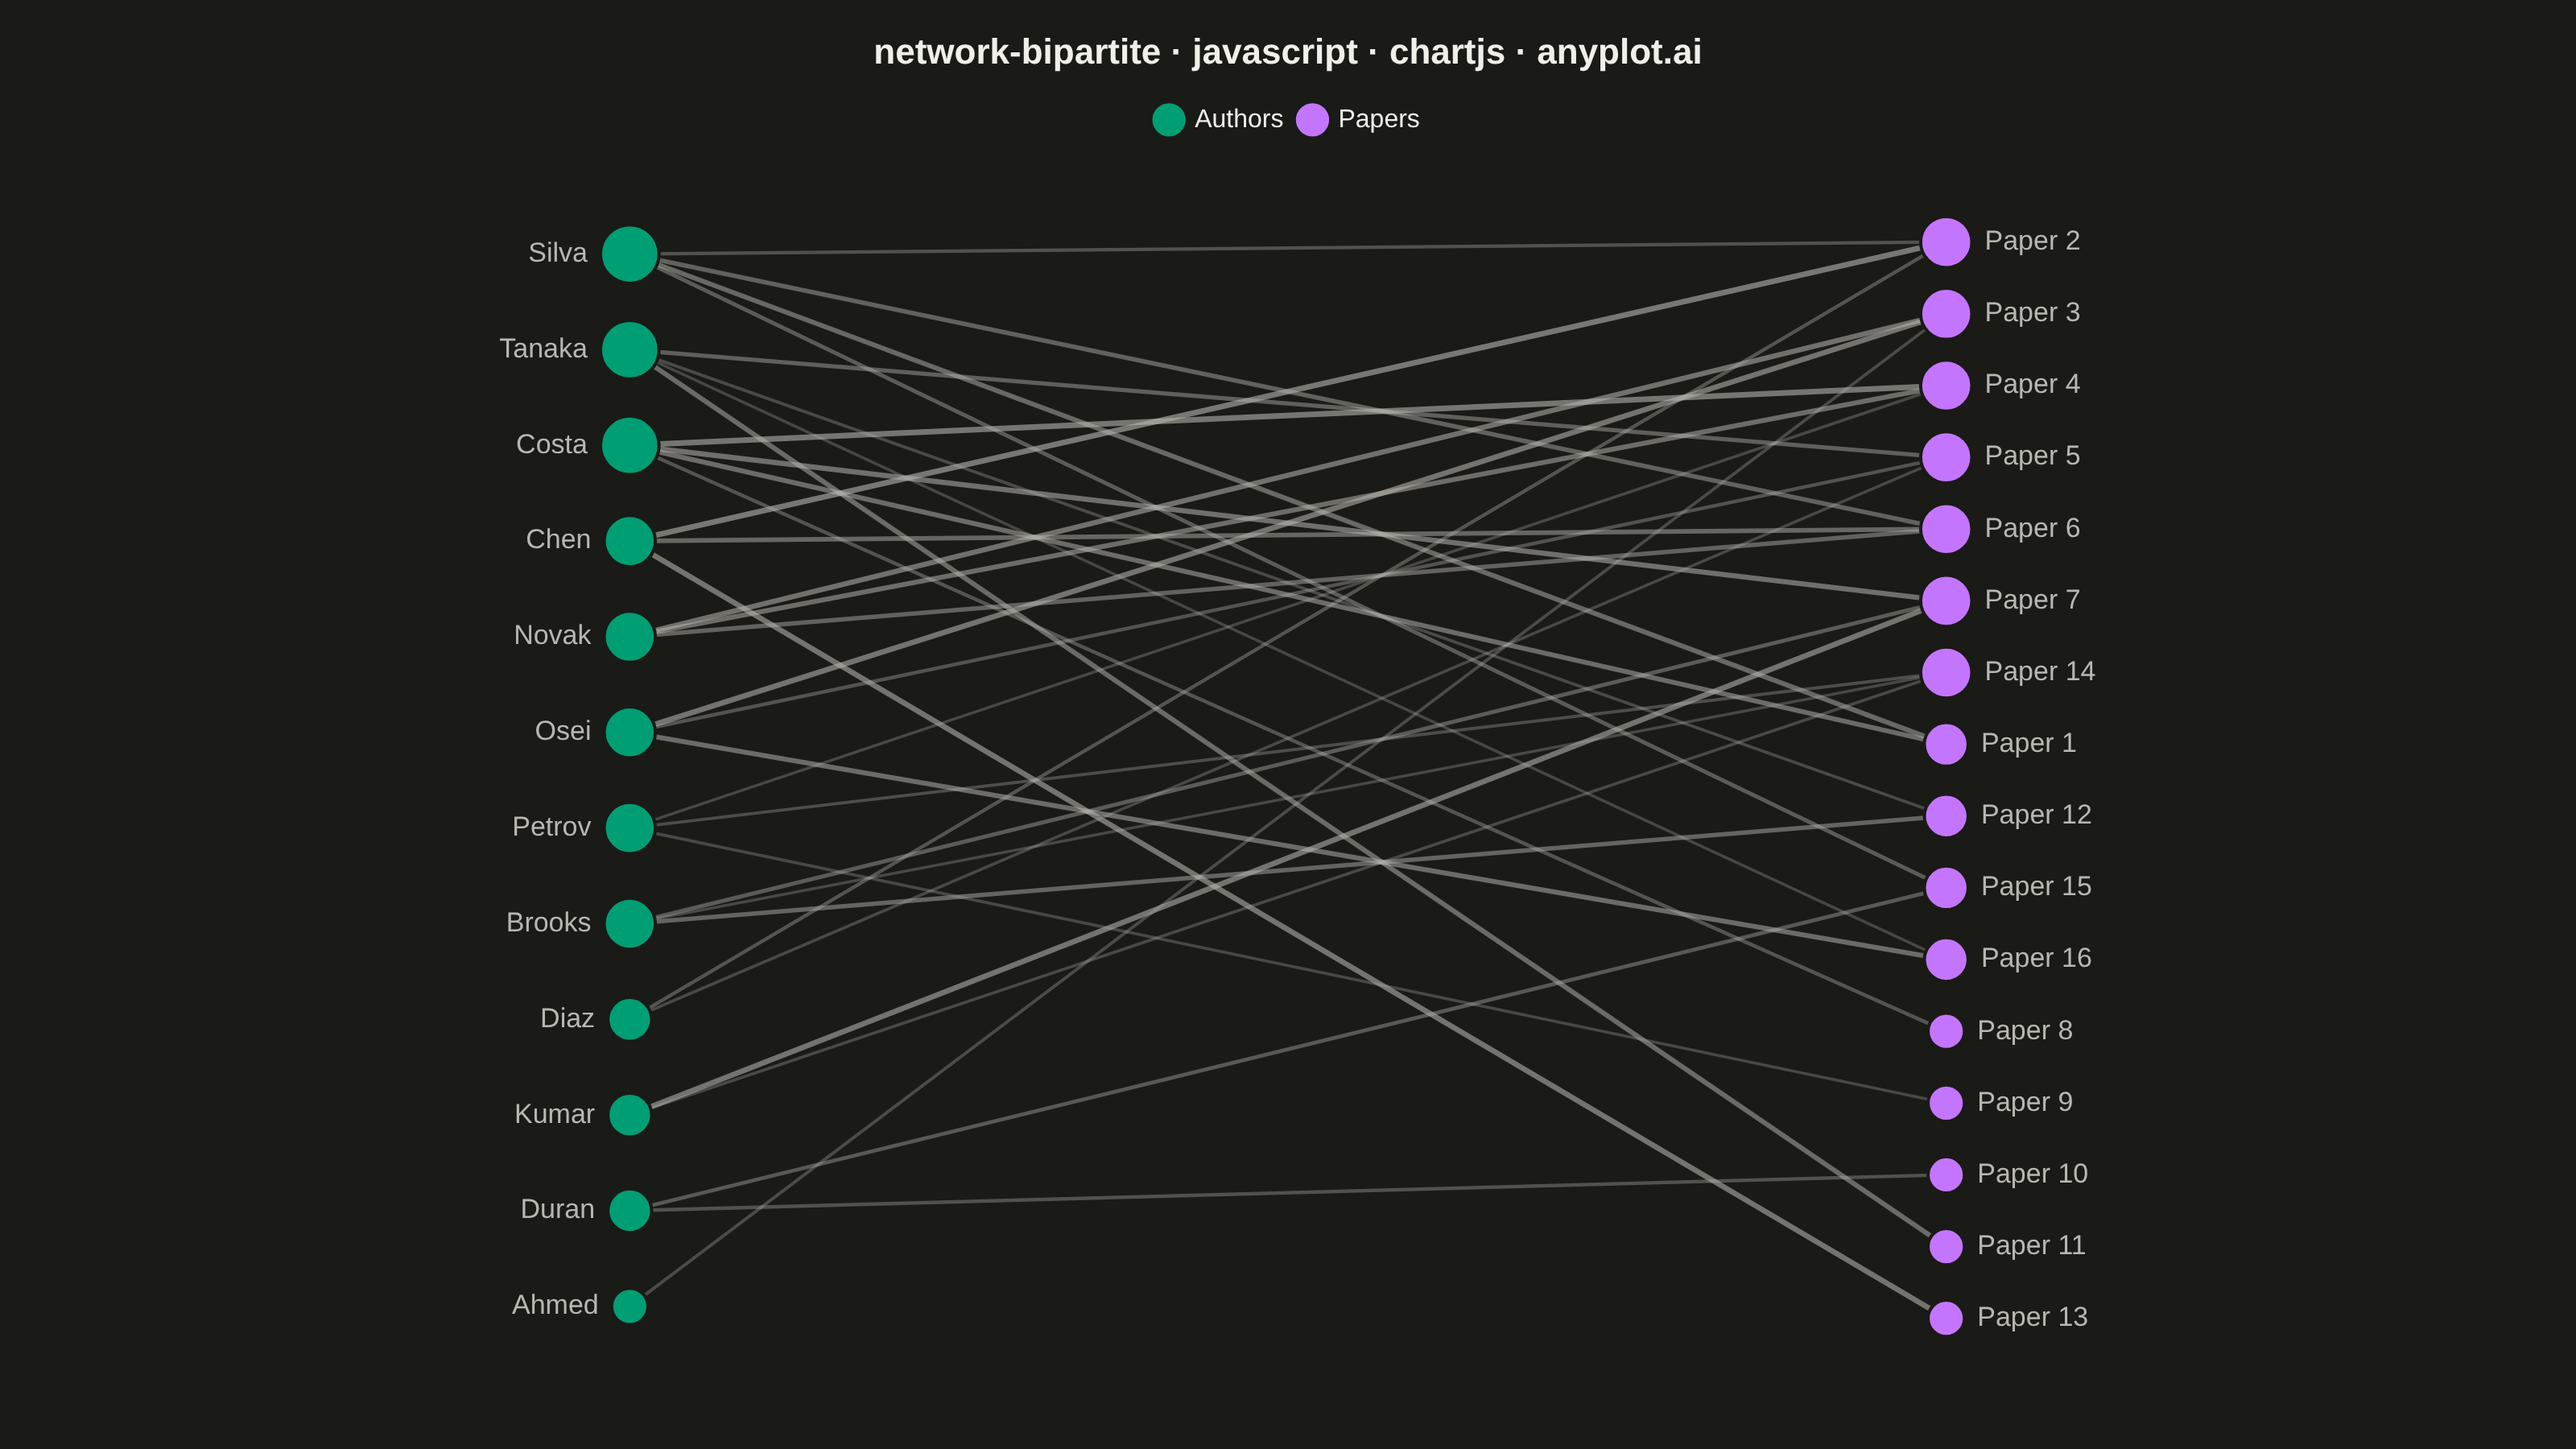
A bipartite network graph visualizes relationships between two distinct sets of entities, where edges only connect nodes from different sets — never within the same set. The two node groups are arranged in separate columns or rows, making the two-mode structure immediately apparent. This layout is fundamental for understanding cross-category relationships, revealing which entities from one set are linked to which entities in the other, and exposing patterns like hubs, clusters, and isolated nodes.
// anyplot.ai
// network-bipartite: Bipartite Network Graph
// Library: chartjs 4.4.7 | JavaScript 22.23.2
// Quality: 87/100 | Created: 2026-09-05

const t = window.ANYPLOT_TOKENS;

// --- Data (in-memory, deterministic) ----------------------------------------
// Author-paper affiliation network: which researchers contributed to which papers.
const authors = [
  "Chen", "Diaz", "Kumar", "Novak", "Osei", "Petrov",
  "Silva", "Tanaka", "Ahmed", "Brooks", "Costa", "Duran",
];
const papers = Array.from({ length: 16 }, (_, i) => `Paper ${i + 1}`);

// Fixed-seed LCG — the browser has no seeded RNG, so pseudo-randomness must be
// hand-rolled for reproducible output.
let seed = 42;
function rand() {
  seed = (seed * 1103515245 + 12345) & 0x7fffffff;
  return seed / 0x7fffffff;
}

// Each paper draws 1-3 co-authors; weight is that author's credited
// contribution share (0.3-1.0), encoded later as edge width/opacity.
const edges = [];
papers.forEach((_, paperIdx) => {
  const numAuthors = 1 + Math.floor(rand() * 3);
  const chosen = new Set();
  while (chosen.size < numAuthors) {
    chosen.add(Math.floor(rand() * authors.length));
  }
  chosen.forEach((authorIdx) => {
    edges.push({ authorIdx, paperIdx, weight: 0.3 + rand() * 0.7 });
  });
});

const authorDegree = authors.map((_, i) => edges.filter((e) => e.authorIdx === i).length);
const paperDegree = papers.map((_, j) => edges.filter((e) => e.paperIdx === j).length);

// Reorder each column by degree (descending) so hub nodes cluster near the
// top on both sides — a simple crossing-minimization heuristic that turns
// the raw insertion-order "hairball" into a readable hub/cluster layout.
const authorOrder = authors.map((_, i) => i).sort((a, b) => authorDegree[b] - authorDegree[a] || a - b);
const paperOrder = papers.map((_, j) => j).sort((a, b) => paperDegree[b] - paperDegree[a] || a - b);
const authorPos = new Array(authors.length);
authorOrder.forEach((origIdx, pos) => {
  authorPos[origIdx] = pos;
});
const paperPos = new Array(papers.length);
paperOrder.forEach((origIdx, pos) => {
  paperPos[origIdx] = pos;
});

const authorY = (i) => 1 - (authorPos[i] + 0.5) / authors.length;
const paperY = (j) => 1 - (paperPos[j] + 0.5) / papers.length;
const radiusFor = (degree) => 9 + Math.min(degree, 8) * 2.3;

function withAlpha(hex, alpha) {
  const r = parseInt(hex.slice(1, 3), 16);
  const g = parseInt(hex.slice(3, 5), 16);
  const b = parseInt(hex.slice(5, 7), 16);
  return `rgba(${r}, ${g}, ${b}, ${alpha})`;
}

// --- Mount -------------------------------------------------------------------
const canvas = document.createElement("canvas");
document.getElementById("container").appendChild(canvas);

// --- Native Chart.js plugin: draws the bipartite edges behind the node
// datasets, then the source/target labels on top — no external package.
const bipartiteLayout = {
  id: "bipartiteLayout",
  beforeDatasetsDraw(chart) {
    const { ctx, scales } = chart;
    ctx.save();
    edges.forEach(({ authorIdx, paperIdx, weight }) => {
      ctx.beginPath();
      ctx.moveTo(scales.x.getPixelForValue(0), scales.y.getPixelForValue(authorY(authorIdx)));
      ctx.lineTo(scales.x.getPixelForValue(1), scales.y.getPixelForValue(paperY(paperIdx)));
      ctx.lineWidth = 1 + weight * 2.5;
      ctx.strokeStyle = withAlpha(t.inkSoft, 0.15 + weight * 0.45);
      ctx.stroke();
    });
    ctx.restore();
  },
  afterDatasetsDraw(chart) {
    const { ctx, scales } = chart;
    ctx.save();
    ctx.font = "17px sans-serif";
    ctx.fillStyle = t.inkSoft;
    ctx.textBaseline = "middle";
    ctx.textAlign = "right";
    authors.forEach((name, i) => {
      const gap = radiusFor(authorDegree[i]) + 8;
      ctx.fillText(name, scales.x.getPixelForValue(0) - gap, scales.y.getPixelForValue(authorY(i)));
    });
    ctx.textAlign = "left";
    papers.forEach((name, j) => {
      const gap = radiusFor(paperDegree[j]) + 8;
      ctx.fillText(name, scales.x.getPixelForValue(1) + gap, scales.y.getPixelForValue(paperY(j)));
    });
    ctx.restore();
  },
};

// --- Chart -------------------------------------------------------------------
new Chart(canvas, {
  type: "scatter",
  data: {
    datasets: [
      {
        label: "Authors",
        data: authors.map((name, i) => ({ x: 0, y: authorY(i), name, degree: authorDegree[i] })),
        backgroundColor: t.palette[0],
        borderColor: t.pageBg,
        borderWidth: 2,
        pointRadius: (ctx) => radiusFor(ctx.raw.degree),
        pointHoverRadius: (ctx) => radiusFor(ctx.raw.degree) + 3,
      },
      {
        label: "Papers",
        data: papers.map((name, j) => ({ x: 1, y: paperY(j), name, degree: paperDegree[j] })),
        backgroundColor: t.palette[1],
        borderColor: t.pageBg,
        borderWidth: 2,
        pointRadius: (ctx) => radiusFor(ctx.raw.degree),
        pointHoverRadius: (ctx) => radiusFor(ctx.raw.degree) + 3,
      },
    ],
  },
  options: {
    responsive: true,
    maintainAspectRatio: false,
    animation: false,
    layout: { padding: { top: 10, bottom: 10, left: 10, right: 10 } },
    plugins: {
      title: {
        display: true,
        text: "network-bipartite · javascript · chartjs · anyplot.ai",
        color: t.ink,
        font: { size: 22 },
      },
      legend: {
        position: "top",
        labels: { color: t.ink, font: { size: 16 }, usePointStyle: true },
      },
      tooltip: {
        callbacks: {
          label: (ctx) => `${ctx.raw.name} (degree ${ctx.raw.degree})`,
        },
      },
    },
    scales: {
      x: { display: false, min: -0.45, max: 1.45 },
      y: { display: false, min: -0.05, max: 1.05 },
    },
  },
  plugins: [bipartiteLayout],
});
Runnable source as JSON, for any HTTP client: https://api.anyplot.ai/specs/network-bipartite/chartjs/code. Any spec id and library id listed in llms-full.txt fit the same URL shape; every URL below is complete and callable.
{
  "spec_id": "network-bipartite",
  "language": "javascript",
  "library": "chartjs",
  "page": "https://anyplot.ai/network-bipartite/javascript/chartjs",
  "hub": "https://anyplot.ai/network-bipartite",
  "code_json": "https://api.anyplot.ai/specs/network-bipartite/chartjs/code",
  "spec_json": "https://api.anyplot.ai/specs/network-bipartite",
  "render_light_png": "https://storage.googleapis.com/anyplot-images/plots/network-bipartite/javascript/chartjs/plot-light.png",
  "render_dark_png": "https://storage.googleapis.com/anyplot-images/plots/network-bipartite/javascript/chartjs/plot-dark.png",
  "interactive_light_html": "https://storage.googleapis.com/anyplot-images/plots/network-bipartite/javascript/chartjs/plot-light.html",
  "interactive_dark_html": "https://storage.googleapis.com/anyplot-images/plots/network-bipartite/javascript/chartjs/plot-dark.html",
  "quality_score": 87.0,
  "license": "MIT",
  "guide": "https://anyplot.ai/llms.txt"
}
Part of Bipartite Network Graph on anyplot.ai.