The same plot in 14 other libraries — JavaScript: Chart.js, D3.js, Highcharts, MUI X Charts; Python: Altair, Bokeh, lets-plot, Matplotlib, Plotly, plotnine, Pygal, Seaborn; R: ggplot2; Julia: Makie.jl. Compare all 15 side by side: Bipartite Network Graph in Python, R, Julia and JavaScript.
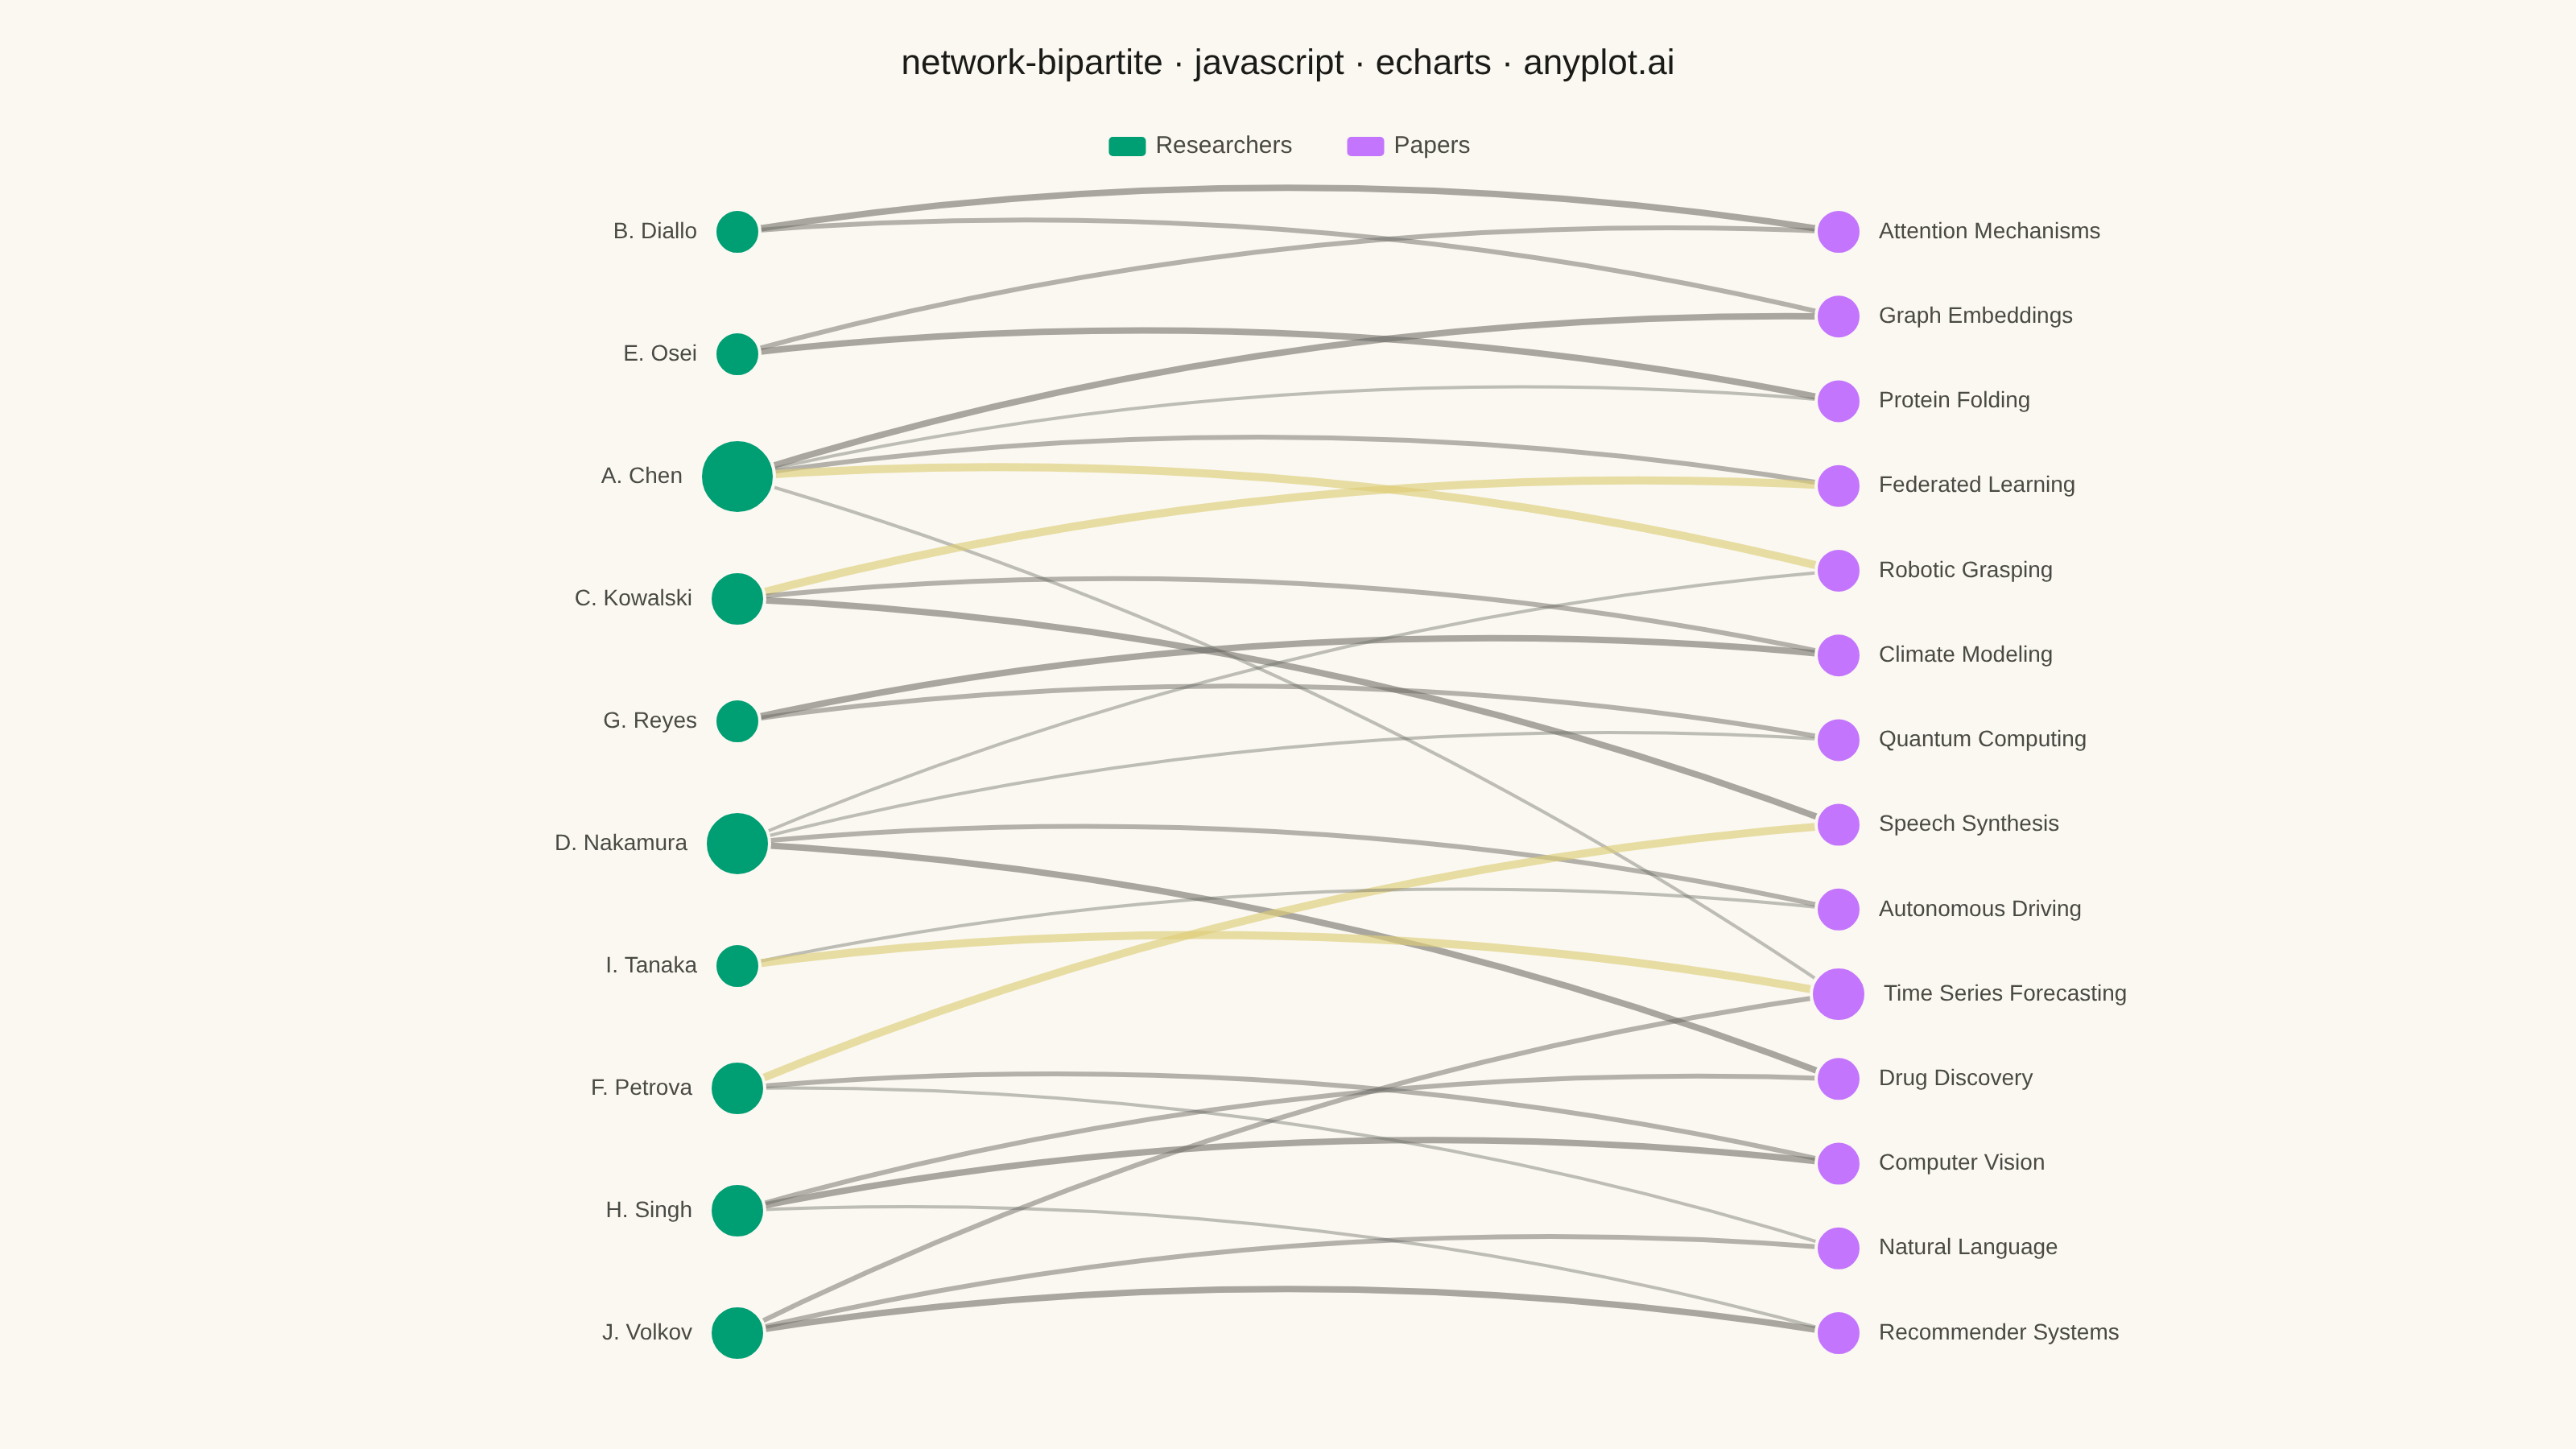
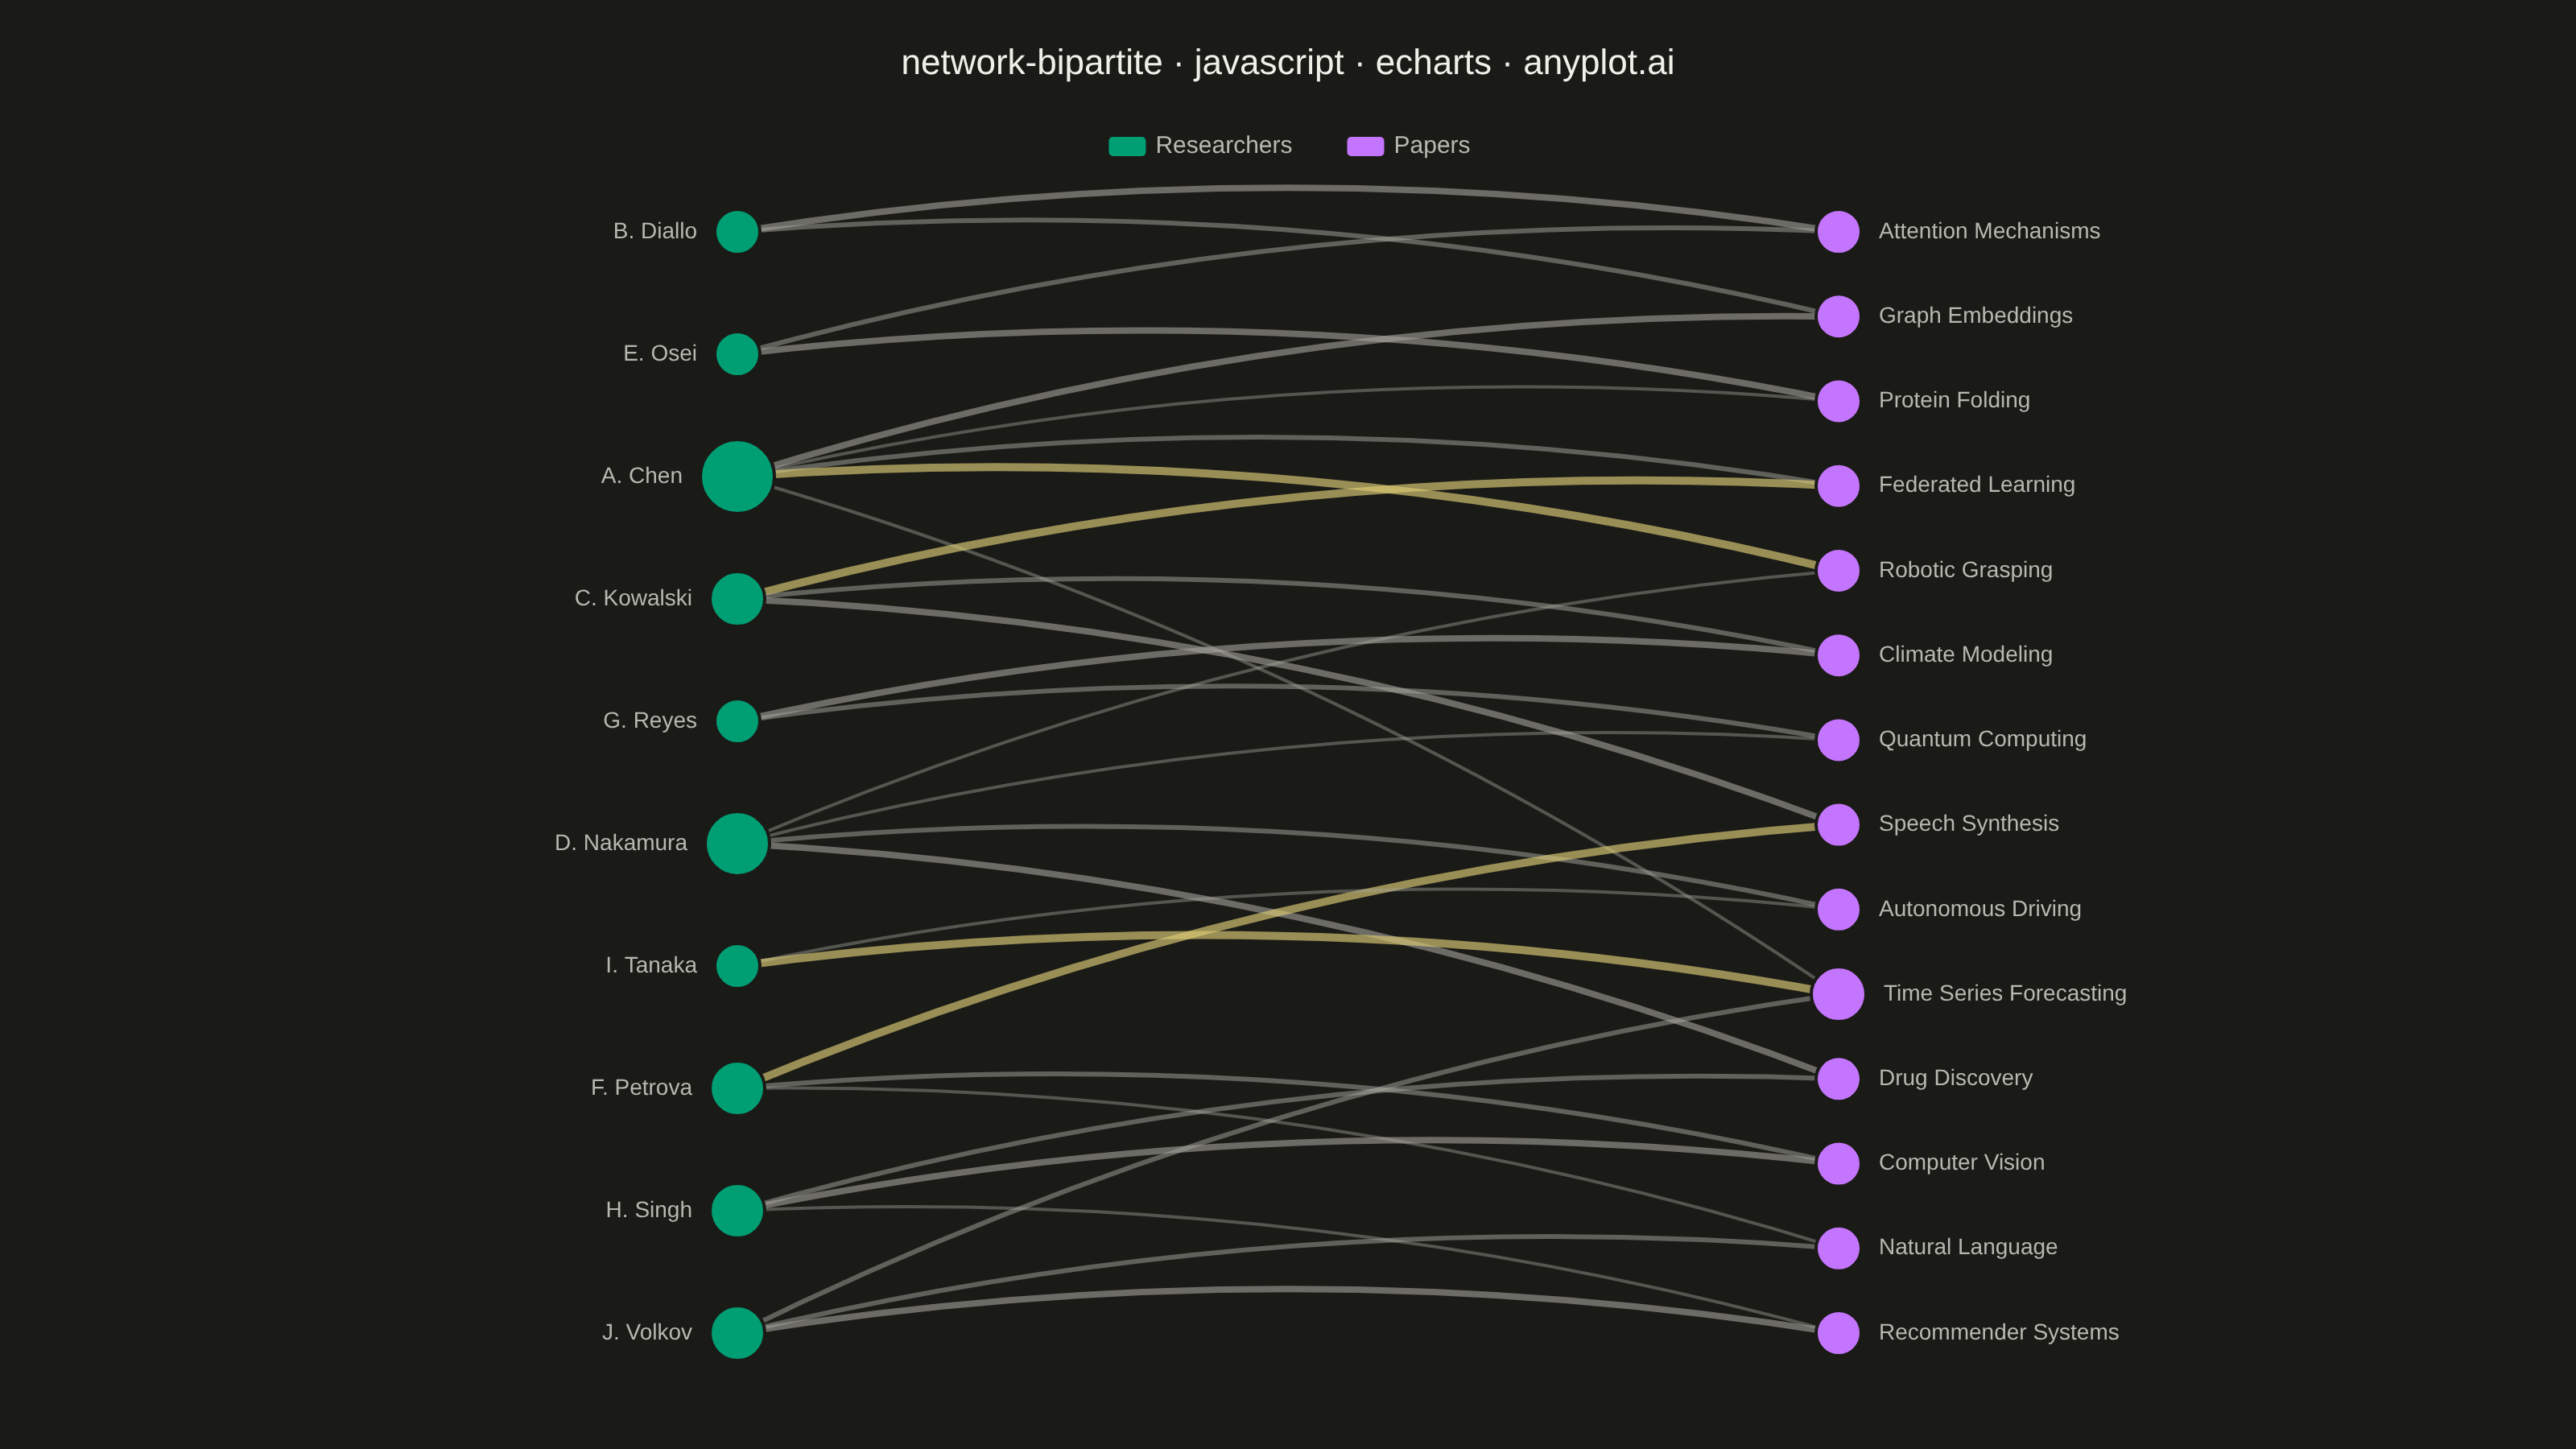
A bipartite network graph visualizes relationships between two distinct sets of entities, where edges only connect nodes from different sets — never within the same set. The two node groups are arranged in separate columns or rows, making the two-mode structure immediately apparent. This layout is fundamental for understanding cross-category relationships, revealing which entities from one set are linked to which entities in the other, and exposing patterns like hubs, clusters, and isolated nodes.
// anyplot.ai
// network-bipartite: Bipartite Network Graph
// Library: echarts 6.1.0 | JavaScript 22.23.2
// Quality: 92/100 | Created: 2026-09-05

const theme = window.ANYPLOT_THEME;
const t = window.ANYPLOT_TOKENS;
const muted = theme === "dark" ? "#A8A79F" : "#6B6A63";

// --- Data (in-memory, deterministic) ----------------------------------------
// Author-paper affiliation network: which researchers contributed to which
// publications. Edge weight = number of shared authorship credits.
const researchers = [
  "A. Chen", "B. Diallo", "C. Kowalski", "D. Nakamura", "E. Osei",
  "F. Petrova", "G. Reyes", "H. Singh", "I. Tanaka", "J. Volkov",
];
const papers = [
  "Graph Embeddings", "Federated Learning", "Attention Mechanisms",
  "Robotic Grasping", "Climate Modeling", "Protein Folding",
  "Speech Synthesis", "Autonomous Driving", "Drug Discovery",
  "Quantum Computing", "Computer Vision", "Natural Language",
  "Recommender Systems", "Time Series Forecasting",
];

// [researcherIndex, paperIndex, weight]
const links = [
  [0, 0, 3], [0, 1, 2], [0, 3, 4], [0, 5, 1], [0, 13, 1],
  [1, 0, 2], [1, 2, 3],
  [2, 1, 4], [2, 4, 2], [2, 6, 3],
  [3, 3, 1], [3, 7, 2], [3, 8, 3], [3, 9, 1],
  [4, 2, 2], [4, 5, 3],
  [5, 6, 4], [5, 10, 2], [5, 11, 1],
  [6, 4, 3], [6, 9, 2],
  [7, 8, 2], [7, 10, 3], [7, 12, 1],
  [8, 7, 1], [8, 13, 4],
  [9, 11, 2], [9, 12, 3], [9, 13, 2],
];

// --- Layout: two fixed columns, degree-weighted node size -------------------
const researcherDegree = researchers.map(
  (_, i) => links.filter((l) => l[0] === i).length,
);
const paperDegree = papers.map(
  (_, j) => links.filter((l) => l[1] === j).length,
);

// Crossing minimization: barycenter heuristic, alternating a few sweeps
// between the two columns so each side settles near the average position
// of its connected neighbors on the other side.
const researcherLinks = researchers.map((_, i) =>
  links.filter((l) => l[0] === i).map((l) => l[1]),
);
const paperLinks = papers.map((_, j) =>
  links.filter((l) => l[1] === j).map((l) => l[0]),
);

const barycenterSort = (order, neighborLists, otherOrder) => {
  const otherRank = new Map(otherOrder.map((idx, pos) => [idx, pos]));
  return order
    .map((idx, pos) => {
      const neighbors = neighborLists[idx];
      const avg = neighbors.length
        ? neighbors.reduce((sum, n) => sum + otherRank.get(n), 0) /
          neighbors.length
        : pos;
      return { idx, avg };
    })
    .sort((a, b) => a.avg - b.avg)
    .map((e) => e.idx);
};

let researcherOrder = researchers.map((_, i) => i);
let paperOrder = papers.map((_, j) => j);
for (let sweep = 0; sweep < 8; sweep++) {
  paperOrder = barycenterSort(paperOrder, paperLinks, researcherOrder);
  researcherOrder = barycenterSort(researcherOrder, researcherLinks, paperOrder);
}
const researcherPos = new Map(researcherOrder.map((idx, pos) => [idx, pos]));
const paperPos = new Map(paperOrder.map((idx, pos) => [idx, pos]));

const yFor = (i, n) => (n === 1 ? 0.5 : i / (n - 1));
const sizeFor = (degree) => 16 + degree * 6;

const nodes = [
  ...researchers.map((name, i) => ({
    id: `r${i}`,
    name,
    category: 0,
    x: 0,
    y: yFor(researcherPos.get(i), researchers.length),
    symbolSize: sizeFor(researcherDegree[i]),
    label: { position: "left" },
  })),
  ...papers.map((name, j) => ({
    id: `p${j}`,
    name,
    category: 1,
    x: 1,
    y: yFor(paperPos.get(j), papers.length),
    symbolSize: sizeFor(paperDegree[j]),
    label: { position: "right" },
  })),
];

const maxWeight = Math.max(...links.map((l) => l[2]));
const edges = links.map(([r, p, weight]) => ({
  source: `r${r}`,
  target: `p${p}`,
  value: weight,
  lineStyle: {
    color: weight === maxWeight ? t.amber : muted,
    width: 1 + (weight / maxWeight) * 4,
    opacity: 0.35 + (weight / maxWeight) * 0.3,
    curveness: 0.08,
  },
  emphasis: {
    lineStyle: { opacity: 1, width: 2 + (weight / maxWeight) * 4 },
    label: { show: true, formatter: "{c}", color: t.ink, fontSize: 12 },
  },
}));

// --- Init ---------------------------------------------------------------------
const chart = echarts.init(document.getElementById("container"));

// --- Option ---------------------------------------------------------------
chart.setOption({
  animation: false,
  backgroundColor: "transparent",
  title: {
    text: "network-bipartite · javascript · echarts · anyplot.ai",
    left: "center",
    top: 24,
    textStyle: { color: t.ink, fontSize: 22, fontWeight: 500 },
  },
  legend: {
    data: ["Researchers", "Papers"],
    top: 78,
    left: "center",
    itemGap: 32,
    textStyle: { color: t.inkSoft, fontSize: 15 },
  },
  series: [
    {
      type: "graph",
      layout: "none",
      preserveAspect: "contain",
      roam: false,
      left: "16%",
      right: "16%",
      top: "16%",
      bottom: "8%",
      symbol: "circle",
      categories: [
        { name: "Researchers", itemStyle: { color: t.palette[0] } },
        { name: "Papers", itemStyle: { color: t.palette[1] } },
      ],
      label: {
        show: true,
        color: t.inkSoft,
        fontSize: 14,
        distance: 10,
      },
      itemStyle: { borderColor: t.pageBg, borderWidth: 2 },
      emphasis: { focus: "adjacency", scale: false, lineStyle: { opacity: 1 } },
      blur: { itemStyle: { opacity: 0.25 }, lineStyle: { opacity: 0.1 } },
      data: nodes,
      links: edges,
    },
  ],
});
Runnable source as JSON, for any HTTP client: https://api.anyplot.ai/specs/network-bipartite/echarts/code. Any spec id and library id listed in llms-full.txt fit the same URL shape; every URL below is complete and callable.
{
  "spec_id": "network-bipartite",
  "language": "javascript",
  "library": "echarts",
  "page": "https://anyplot.ai/network-bipartite/javascript/echarts",
  "hub": "https://anyplot.ai/network-bipartite",
  "code_json": "https://api.anyplot.ai/specs/network-bipartite/echarts/code",
  "spec_json": "https://api.anyplot.ai/specs/network-bipartite",
  "render_light_png": "https://storage.googleapis.com/anyplot-images/plots/network-bipartite/javascript/echarts/plot-light.png",
  "render_dark_png": "https://storage.googleapis.com/anyplot-images/plots/network-bipartite/javascript/echarts/plot-dark.png",
  "interactive_light_html": "https://storage.googleapis.com/anyplot-images/plots/network-bipartite/javascript/echarts/plot-light.html",
  "interactive_dark_html": "https://storage.googleapis.com/anyplot-images/plots/network-bipartite/javascript/echarts/plot-dark.html",
  "quality_score": 92.0,
  "license": "MIT",
  "guide": "https://anyplot.ai/llms.txt"
}
Part of Bipartite Network Graph on anyplot.ai.