The same plot in 14 other libraries — JavaScript: Chart.js, D3.js, Apache ECharts, Highcharts; Python: Altair, Bokeh, lets-plot, Matplotlib, Plotly, plotnine, Pygal, Seaborn; R: ggplot2; Julia: Makie.jl. Compare all 15 side by side: Bipartite Network Graph in Python, R, Julia and JavaScript.
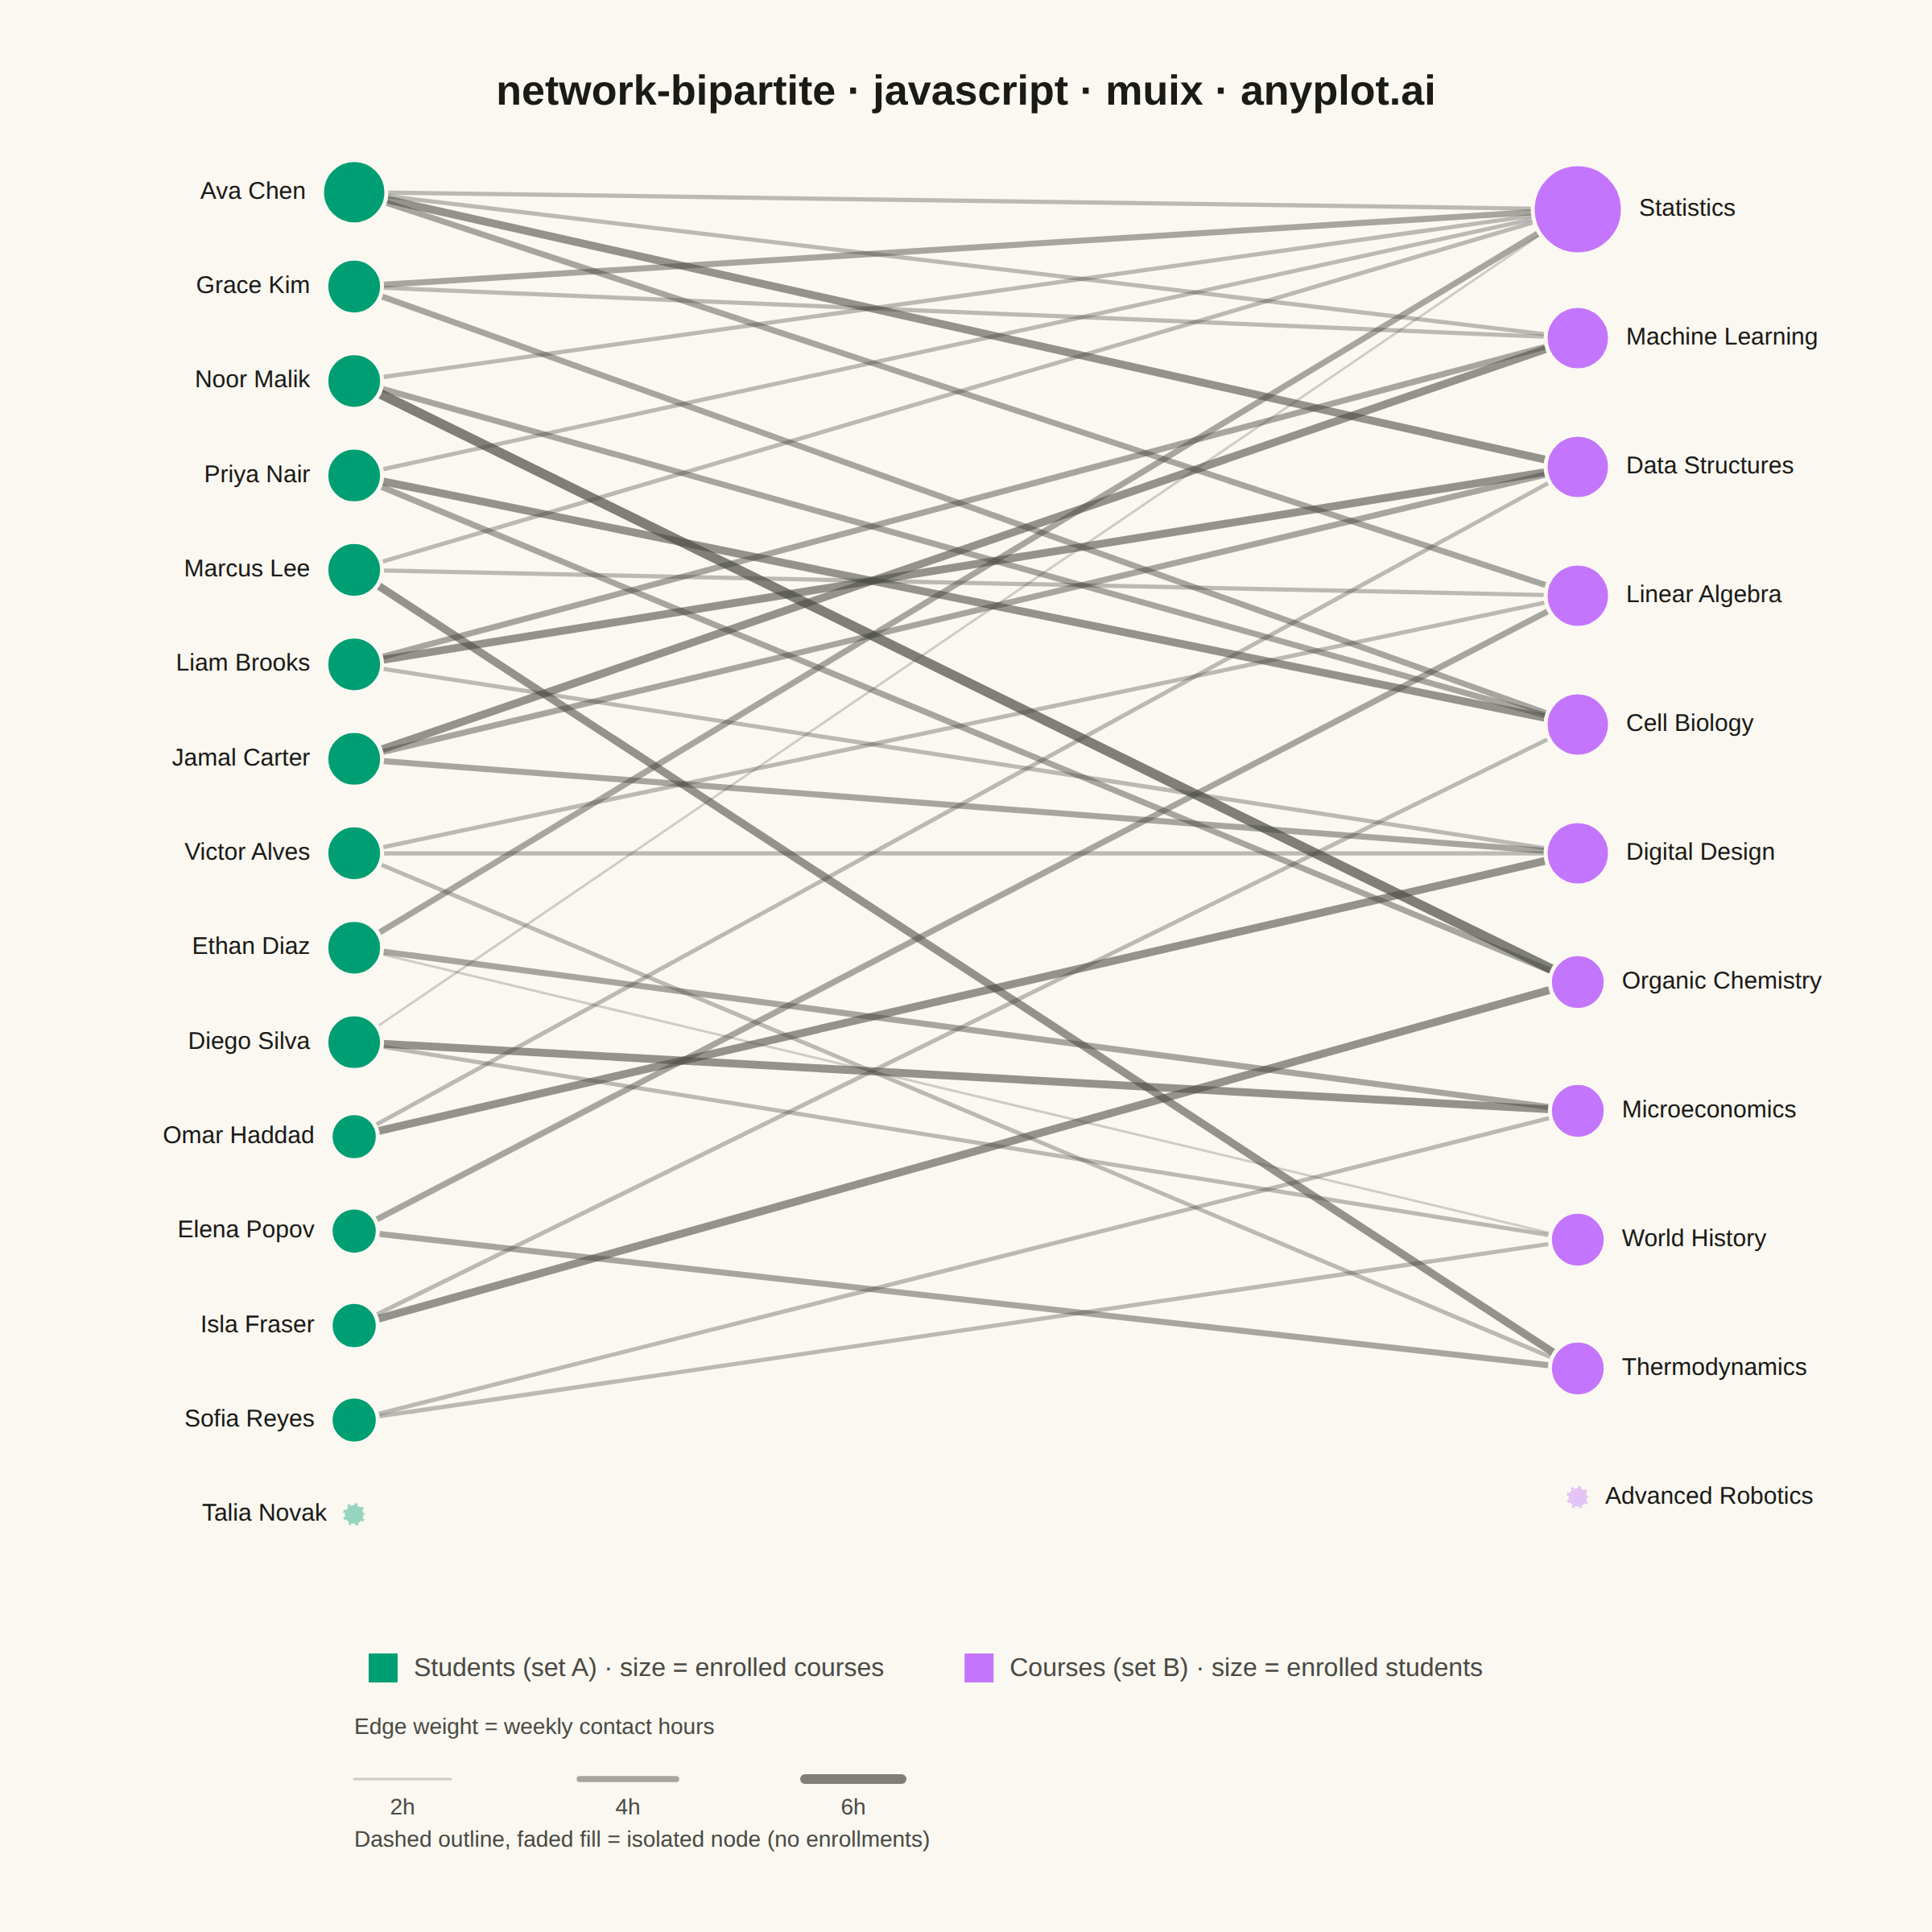
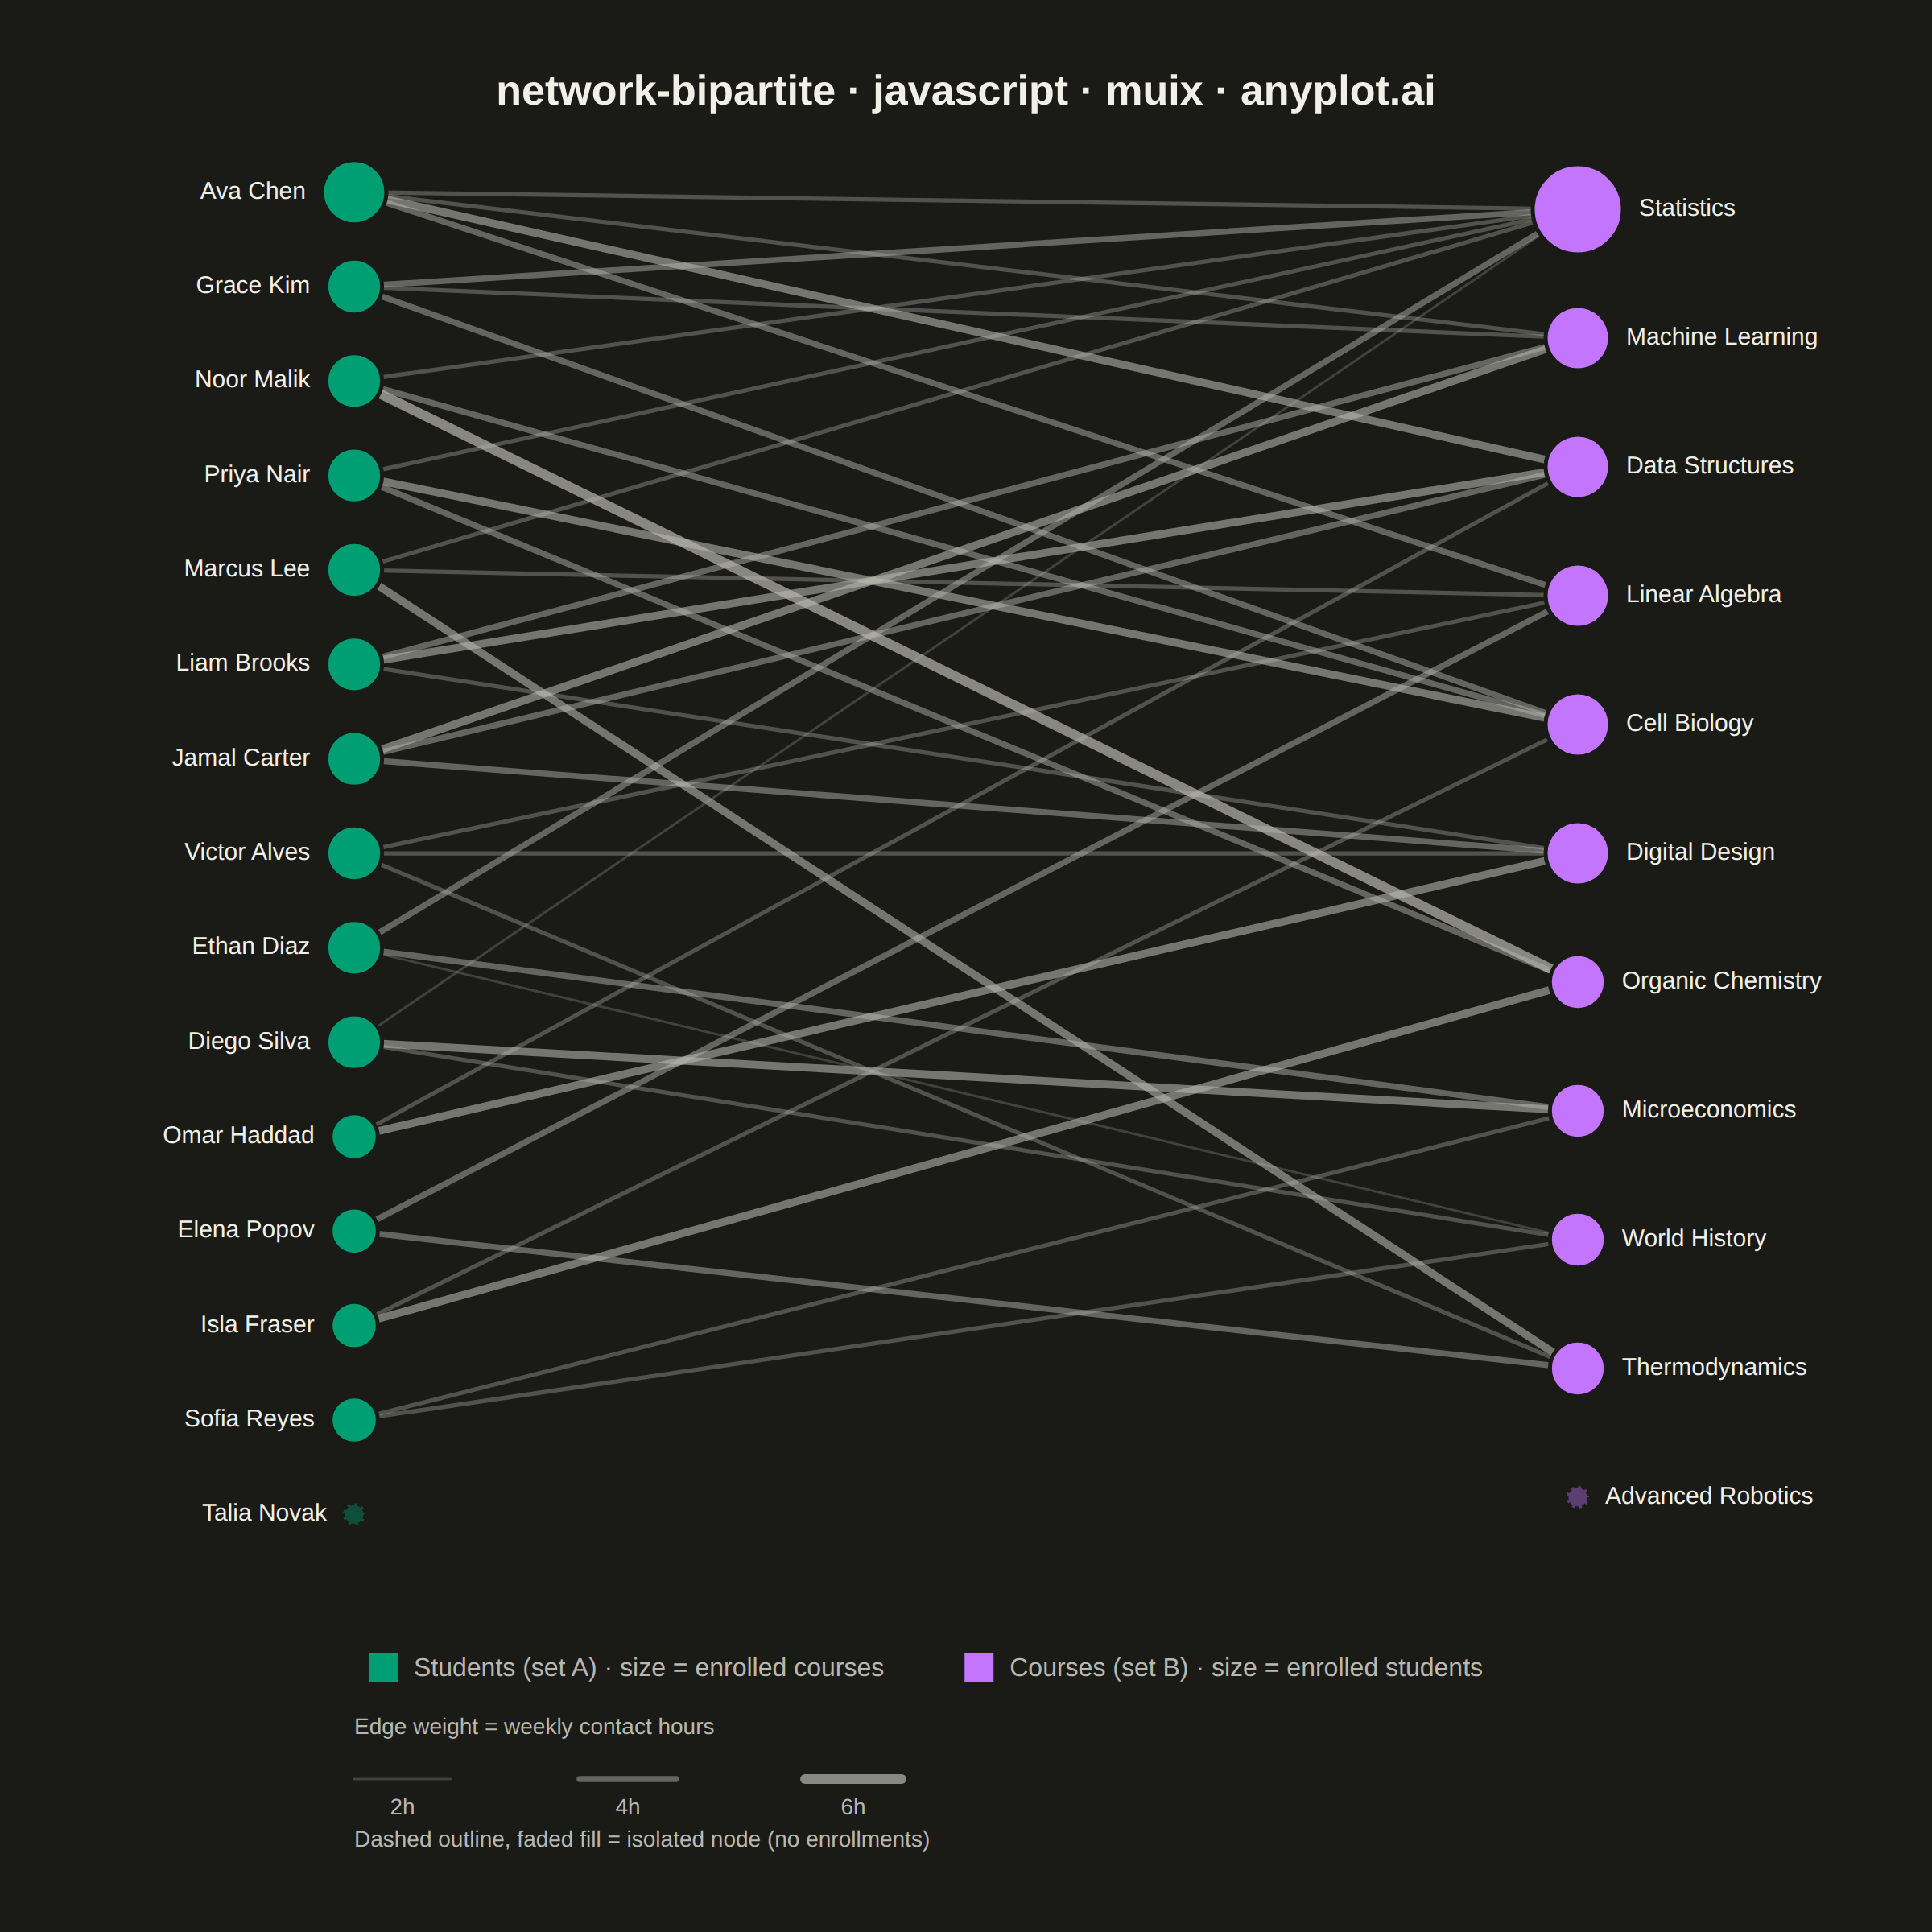
A bipartite network graph visualizes relationships between two distinct sets of entities, where edges only connect nodes from different sets — never within the same set. The two node groups are arranged in separate columns or rows, making the two-mode structure immediately apparent. This layout is fundamental for understanding cross-category relationships, revealing which entities from one set are linked to which entities in the other, and exposing patterns like hubs, clusters, and isolated nodes.
// anyplot.ai
// network-bipartite: Bipartite Network Graph
// Library: muix 7.29.1 | JavaScript 22.23.2
// Quality: 93/100 | Created: 2026-09-05
//# anyplot-orientation: square
// anyplot.ai
// network-bipartite: Bipartite Network Graph
// Library: MUI X Charts | React | Node 22
// License: @mui/x-charts — MIT (community). Pro/Premium are out of scope.
// Quality: pending | Created: 2026-09-05

import { useState } from "react";
import { ChartContainer } from "@mui/x-charts/ChartContainer";
import { ChartsLegend } from "@mui/x-charts/ChartsLegend";
import { useXScale, useYScale, useDrawingArea } from "@mui/x-charts/hooks";

const t = window.ANYPLOT_TOKENS;
const TITLE = "network-bipartite · javascript · muix · anyplot.ai";

// --- Data: student-course enrollment network (in-memory, deterministic) ----
// Bipartite: every edge connects a student (set A) to a course (set B) —
// never student-student or course-course. Weight = weekly contact hours.
// "Talia Novak" and "Advanced Robotics" carry no edges on purpose, to show
// the isolated-node pattern the spec calls out.
const STUDENTS = [
  "Ava Chen", "Liam Brooks", "Noor Malik", "Ethan Diaz", "Priya Nair",
  "Marcus Lee", "Sofia Reyes", "Jamal Carter", "Elena Popov", "Diego Silva",
  "Grace Kim", "Omar Haddad", "Isla Fraser", "Victor Alves", "Talia Novak",
];

const COURSES = [
  "Linear Algebra", "Data Structures", "Organic Chemistry", "Microeconomics",
  "Cell Biology", "Machine Learning", "Thermodynamics", "World History",
  "Statistics", "Digital Design", "Advanced Robotics",
];

const EDGES = [
  { student: 0, course: 0, hours: 4 },
  { student: 0, course: 1, hours: 5 },
  { student: 0, course: 5, hours: 3 },
  { student: 0, course: 8, hours: 3 },
  { student: 1, course: 1, hours: 5 },
  { student: 1, course: 5, hours: 4 },
  { student: 1, course: 9, hours: 3 },
  { student: 2, course: 2, hours: 6 },
  { student: 2, course: 4, hours: 4 },
  { student: 2, course: 8, hours: 3 },
  { student: 3, course: 3, hours: 4 },
  { student: 3, course: 7, hours: 2 },
  { student: 3, course: 8, hours: 4 },
  { student: 4, course: 2, hours: 4 },
  { student: 4, course: 4, hours: 5 },
  { student: 4, course: 8, hours: 3 },
  { student: 5, course: 0, hours: 3 },
  { student: 5, course: 6, hours: 5 },
  { student: 5, course: 8, hours: 3 },
  { student: 6, course: 3, hours: 3 },
  { student: 6, course: 7, hours: 3 },
  { student: 7, course: 1, hours: 4 },
  { student: 7, course: 5, hours: 5 },
  { student: 7, course: 9, hours: 4 },
  { student: 8, course: 0, hours: 4 },
  { student: 8, course: 6, hours: 4 },
  { student: 9, course: 3, hours: 5 },
  { student: 9, course: 7, hours: 3 },
  { student: 9, course: 8, hours: 2 },
  { student: 10, course: 4, hours: 4 },
  { student: 10, course: 5, hours: 3 },
  { student: 10, course: 8, hours: 4 },
  { student: 11, course: 1, hours: 3 },
  { student: 11, course: 9, hours: 5 },
  { student: 12, course: 2, hours: 5 },
  { student: 12, course: 4, hours: 3 },
  { student: 13, course: 0, hours: 3 },
  { student: 13, course: 6, hours: 3 },
  { student: 13, course: 9, hours: 3 },
];

const MIN_HOURS = Math.min(...EDGES.map((e) => e.hours));
const MAX_HOURS = Math.max(...EDGES.map((e) => e.hours));

const studentDegree = STUDENTS.map(() => 0);
const courseDegree = COURSES.map(() => 0);
EDGES.forEach((e) => {
  studentDegree[e.student] += 1;
  courseDegree[e.course] += 1;
});

const studentNeighbors = STUDENTS.map(() => []);
const courseNeighbors = COURSES.map(() => []);
EDGES.forEach((e) => {
  studentNeighbors[e.student].push(e.course);
  courseNeighbors[e.course].push(e.student);
});

function ranksFromOrder(order) {
  const ranks = order.map(() => 0);
  order.forEach((idx, rank) => {
    ranks[idx] = rank;
  });
  return ranks;
}

// Order each column primarily by descending degree, so hub students / hub
// courses cluster near the top and the fan-out pattern reads clearly top to
// bottom (isolated, zero-degree nodes naturally sink to the bottom). Ties
// within the same degree are broken by the barycenter of each node's
// neighbor ranks in the other column, a standard two-layer crossing-
// minimization heuristic — this keeps edges from crossing more than needed
// among otherwise-equivalent nodes.
function orderByDegreeThenBarycenter(degree, neighbors, otherRanks) {
  return degree
    .map((d, i) => {
      const neigh = neighbors[i];
      const bary = neigh.length === 0 ? Infinity : neigh.reduce((sum, j) => sum + otherRanks[j], 0) / neigh.length;
      return { i, d, bary };
    })
    .sort((a, b) => b.d - a.d || a.bary - b.bary || a.i - b.i)
    .map((x) => x.i);
}

const initialStudentOrder = STUDENTS.map((_, i) => i).sort((a, b) => studentDegree[b] - studentDegree[a] || a - b);
const initialCourseOrder = COURSES.map((_, i) => i).sort((a, b) => courseDegree[b] - courseDegree[a] || a - b);
const initialStudentRanks = ranksFromOrder(initialStudentOrder);
const initialCourseRanks = ranksFromOrder(initialCourseOrder);

const courseOrder = orderByDegreeThenBarycenter(courseDegree, courseNeighbors, initialStudentRanks);
const studentOrder = orderByDegreeThenBarycenter(studentDegree, studentNeighbors, initialCourseRanks);

const studentRow = studentOrder.map(() => 0);
studentOrder.forEach((idx, rank) => {
  studentRow[idx] = rank;
});
const courseRow = courseOrder.map(() => 0);
courseOrder.forEach((idx, rank) => {
  courseRow[idx] = rank;
});

// rank 0 (top of the sorted order) lands at y=1, the last rank at y=0 — each
// column spans the full height independently since the sets differ in size.
function rowY(rank, count) {
  return 1 - (rank + 0.5) / count;
}

const NODE_MIN_R = 12;
const NODE_MAX_R = 28;
const ISOLATED_R = 7;
const MIN_DEGREE = 1;
const MAX_DEGREE = Math.max(...studentDegree, ...courseDegree);

function nodeRadius(degree) {
  if (degree === 0) return ISOLATED_R;
  const ratio = (degree - MIN_DEGREE) / (MAX_DEGREE - MIN_DEGREE || 1);
  return NODE_MIN_R + ratio * (NODE_MAX_R - NODE_MIN_R);
}

const EDGE_MIN_W = 1.5;
const EDGE_MAX_W = 6;

function edgeWidth(hours) {
  const ratio = (hours - MIN_HOURS) / (MAX_HOURS - MIN_HOURS || 1);
  return EDGE_MIN_W + ratio * (EDGE_MAX_W - EDGE_MIN_W);
}

function edgeOpacity(hours) {
  const ratio = (hours - MIN_HOURS) / (MAX_HOURS - MIN_HOURS || 1);
  return 0.25 + ratio * 0.45;
}

const { width: CANVAS_W, height: CANVAS_H } = window.ANYPLOT_SIZE;
const MARGIN = { top: 90, right: 220, bottom: 230, left: 220 };

// Phantom series carrying no points: they exist purely so the native
// ChartsLegend component (a real MUI X primitive, not hand-drawn SVG) has
// series metadata to read the set-membership colors and labels from. The
// nodes themselves are still hand-drawn (their radius encodes degree, which
// the community ScatterChart series can't size per-point).
const LEGEND_SERIES = [
  { type: "scatter", id: "set-a", data: [], color: t.palette[0], label: "Students (set A) · size = enrolled courses" },
  { type: "scatter", id: "set-b", data: [], color: t.palette[1], label: "Courses (set B) · size = enrolled students" },
];

// --- Overlay: title, drawn inside the reserved top margin -------------------
function GraphTitle() {
  return (
    <text
      x={CANVAS_W / 2}
      y={46}
      textAnchor="middle"
      dominantBaseline="hanging"
      fontSize={26}
      fontWeight={600}
      fill={t.ink}
    >
      {TITLE}
    </text>
  );
}

// --- Overlay: edges + nodes, hoverable for the interactive HTML export ------
function BipartiteOverlay({ onHoverChange }) {
  const xScale = useXScale();
  const yScale = useYScale();

  const studentX = xScale(0);
  const courseX = xScale(1);

  return (
    <g>
      {EDGES.map((edge, i) => {
        const x1 = studentX;
        const y1 = yScale(rowY(studentRow[edge.student], STUDENTS.length));
        const x2 = courseX;
        const y2 = yScale(rowY(courseRow[edge.course], COURSES.length));
        const tooltip = {
          label: `${STUDENTS[edge.student]} → ${COURSES[edge.course]}`,
          detail: `${edge.hours} h/week`,
          x: (x1 + x2) / 2,
          y: (y1 + y2) / 2,
        };
        return (
          <g key={`edge-${i}`}>
            <line
              x1={x1}
              y1={y1}
              x2={x2}
              y2={y2}
              stroke={t.inkSoft}
              strokeOpacity={edgeOpacity(edge.hours)}
              strokeWidth={edgeWidth(edge.hours)}
              strokeLinecap="round"
            />
            {/* Wider transparent hit path: the visible stroke is often too thin to hover reliably. */}
            <line
              x1={x1}
              y1={y1}
              x2={x2}
              y2={y2}
              stroke="transparent"
              strokeWidth={16}
              style={{ cursor: "pointer" }}
              onMouseEnter={() => onHoverChange(tooltip)}
              onMouseLeave={() => onHoverChange(null)}
            />
          </g>
        );
      })}
      {STUDENTS.map((label, i) => {
        const cx = studentX;
        const cy = yScale(rowY(studentRow[i], STUDENTS.length));
        const r = nodeRadius(studentDegree[i]);
        const tooltip = {
          label,
          detail: `${studentDegree[i]} course${studentDegree[i] === 1 ? "" : "s"}`,
          x: cx,
          y: cy,
        };
        return (
          <g key={`student-${i}`}>
            <circle
              cx={cx}
              cy={cy}
              r={r}
              fill={t.palette[0]}
              fillOpacity={studentDegree[i] === 0 ? 0.4 : 1}
              stroke={t.pageBg}
              strokeWidth={2.5}
              strokeDasharray={studentDegree[i] === 0 ? "3 2" : undefined}
              style={{ cursor: "pointer" }}
              onMouseEnter={() => onHoverChange(tooltip)}
              onMouseLeave={() => onHoverChange(null)}
            />
            <text
              x={cx - r - 10}
              y={cy}
              textAnchor="end"
              dominantBaseline="middle"
              fontSize={15}
              fill={t.ink}
              style={{ pointerEvents: "none" }}
            >
              {label}
            </text>
          </g>
        );
      })}
      {COURSES.map((label, i) => {
        const cx = courseX;
        const cy = yScale(rowY(courseRow[i], COURSES.length));
        const r = nodeRadius(courseDegree[i]);
        const tooltip = {
          label,
          detail: `${courseDegree[i]} student${courseDegree[i] === 1 ? "" : "s"}`,
          x: cx,
          y: cy,
        };
        return (
          <g key={`course-${i}`}>
            <circle
              cx={cx}
              cy={cy}
              r={r}
              fill={t.palette[1]}
              fillOpacity={courseDegree[i] === 0 ? 0.4 : 1}
              stroke={t.pageBg}
              strokeWidth={2.5}
              strokeDasharray={courseDegree[i] === 0 ? "3 2" : undefined}
              style={{ cursor: "pointer" }}
              onMouseEnter={() => onHoverChange(tooltip)}
              onMouseLeave={() => onHoverChange(null)}
            />
            <text
              x={cx + r + 10}
              y={cy}
              textAnchor="start"
              dominantBaseline="middle"
              fontSize={15}
              fill={t.ink}
              style={{ pointerEvents: "none" }}
            >
              {label}
            </text>
          </g>
        );
      })}
    </g>
  );
}

// --- Overlay: hover tooltip for edges and nodes ------------------------------
function HoverTooltip({ hover }) {
  if (!hover) return null;
  const charWidth = 7.2;
  const width = Math.max(hover.label.length, hover.detail.length) * charWidth + 24;
  const height = 46;
  const x = Math.min(Math.max(hover.x - width / 2, 8), CANVAS_W - width - 8);
  const y = Math.max(hover.y - height - 16, 8);
  return (
    <g style={{ pointerEvents: "none" }}>
      <rect x={x} y={y} width={width} height={height} rx={6} fill={t.elevatedBg} stroke={t.inkSoft} strokeOpacity={0.4} />
      <text x={x + width / 2} y={y + 19} textAnchor="middle" fontSize={13} fontWeight={600} fill={t.ink}>
        {hover.label}
      </text>
      <text x={x + width / 2} y={y + 36} textAnchor="middle" fontSize={12} fill={t.inkSoft}>
        {hover.detail}
      </text>
    </g>
  );
}

// --- Overlay: edge-weight scale + isolated-node note, below the native
// ChartsLegend row (set-membership colors/labels are handled by that real
// MUI X component instead of hand-drawn swatches).
function WeightLegend() {
  const drawingArea = useDrawingArea();
  const rowY2 = drawingArea.top + drawingArea.height + 115;
  const rowY3 = rowY2 + 62;

  const hourSamples = [MIN_HOURS, Math.round((MIN_HOURS + MAX_HOURS) / 2), MAX_HOURS];

  return (
    <g>
      <text x={drawingArea.left} y={rowY2 - 8} fontSize={14} fill={t.inkSoft}>
        Edge weight = weekly contact hours
      </text>
      {hourSamples.map((h, i) => {
        const x = drawingArea.left + i * 140;
        const lineY = rowY2 + 20;
        return (
          <g key={h}>
            <line
              x1={x}
              y1={lineY}
              x2={x + 60}
              y2={lineY}
              stroke={t.inkSoft}
              strokeOpacity={edgeOpacity(h)}
              strokeWidth={edgeWidth(h)}
              strokeLinecap="round"
            />
            <text x={x + 30} y={lineY + 22} textAnchor="middle" fontSize={14} fill={t.inkSoft}>
              {h}h
            </text>
          </g>
        );
      })}
      <text x={drawingArea.left} y={rowY3} fontSize={14} fill={t.inkSoft}>
        Dashed outline, faded fill = isolated node (no enrollments)
      </text>
    </g>
  );
}

// --- Chart (default-exported component — the harness mounts it) -------------
export default function Chart() {
  const [hover, setHover] = useState(null);
  return (
    <ChartContainer
      width={CANVAS_W}
      height={CANVAS_H}
      margin={MARGIN}
      series={LEGEND_SERIES}
      skipAnimation
      disableAxisListener
      xAxis={[{ scaleType: "linear", min: 0, max: 1 }]}
      yAxis={[{ scaleType: "linear", min: 0, max: 1 }]}
    >
      <BipartiteOverlay onHoverChange={setHover} />
      <GraphTitle />
      <ChartsLegend
        position={{ horizontal: "middle", vertical: "bottom" }}
        direction="row"
        padding={{ top: 0, right: 0, bottom: 130, left: 0 }}
        itemMarkWidth={18}
        itemMarkHeight={18}
        markGap={10}
        itemGap={50}
        labelStyle={{ fontSize: 16, fill: t.inkSoft }}
      />
      <WeightLegend />
      <HoverTooltip hover={hover} />
    </ChartContainer>
  );
}
Runnable source as JSON, for any HTTP client: https://api.anyplot.ai/specs/network-bipartite/muix/code. Any spec id and library id listed in llms-full.txt fit the same URL shape; every URL below is complete and callable.
{
  "spec_id": "network-bipartite",
  "language": "javascript",
  "library": "muix",
  "page": "https://anyplot.ai/network-bipartite/javascript/muix",
  "hub": "https://anyplot.ai/network-bipartite",
  "code_json": "https://api.anyplot.ai/specs/network-bipartite/muix/code",
  "spec_json": "https://api.anyplot.ai/specs/network-bipartite",
  "render_light_png": "https://storage.googleapis.com/anyplot-images/plots/network-bipartite/javascript/muix/plot-light.png",
  "render_dark_png": "https://storage.googleapis.com/anyplot-images/plots/network-bipartite/javascript/muix/plot-dark.png",
  "interactive_light_html": "https://storage.googleapis.com/anyplot-images/plots/network-bipartite/javascript/muix/plot-light.html",
  "interactive_dark_html": "https://storage.googleapis.com/anyplot-images/plots/network-bipartite/javascript/muix/plot-dark.html",
  "quality_score": 93.0,
  "license": "MIT",
  "guide": "https://anyplot.ai/llms.txt"
}
Part of Bipartite Network Graph on anyplot.ai.