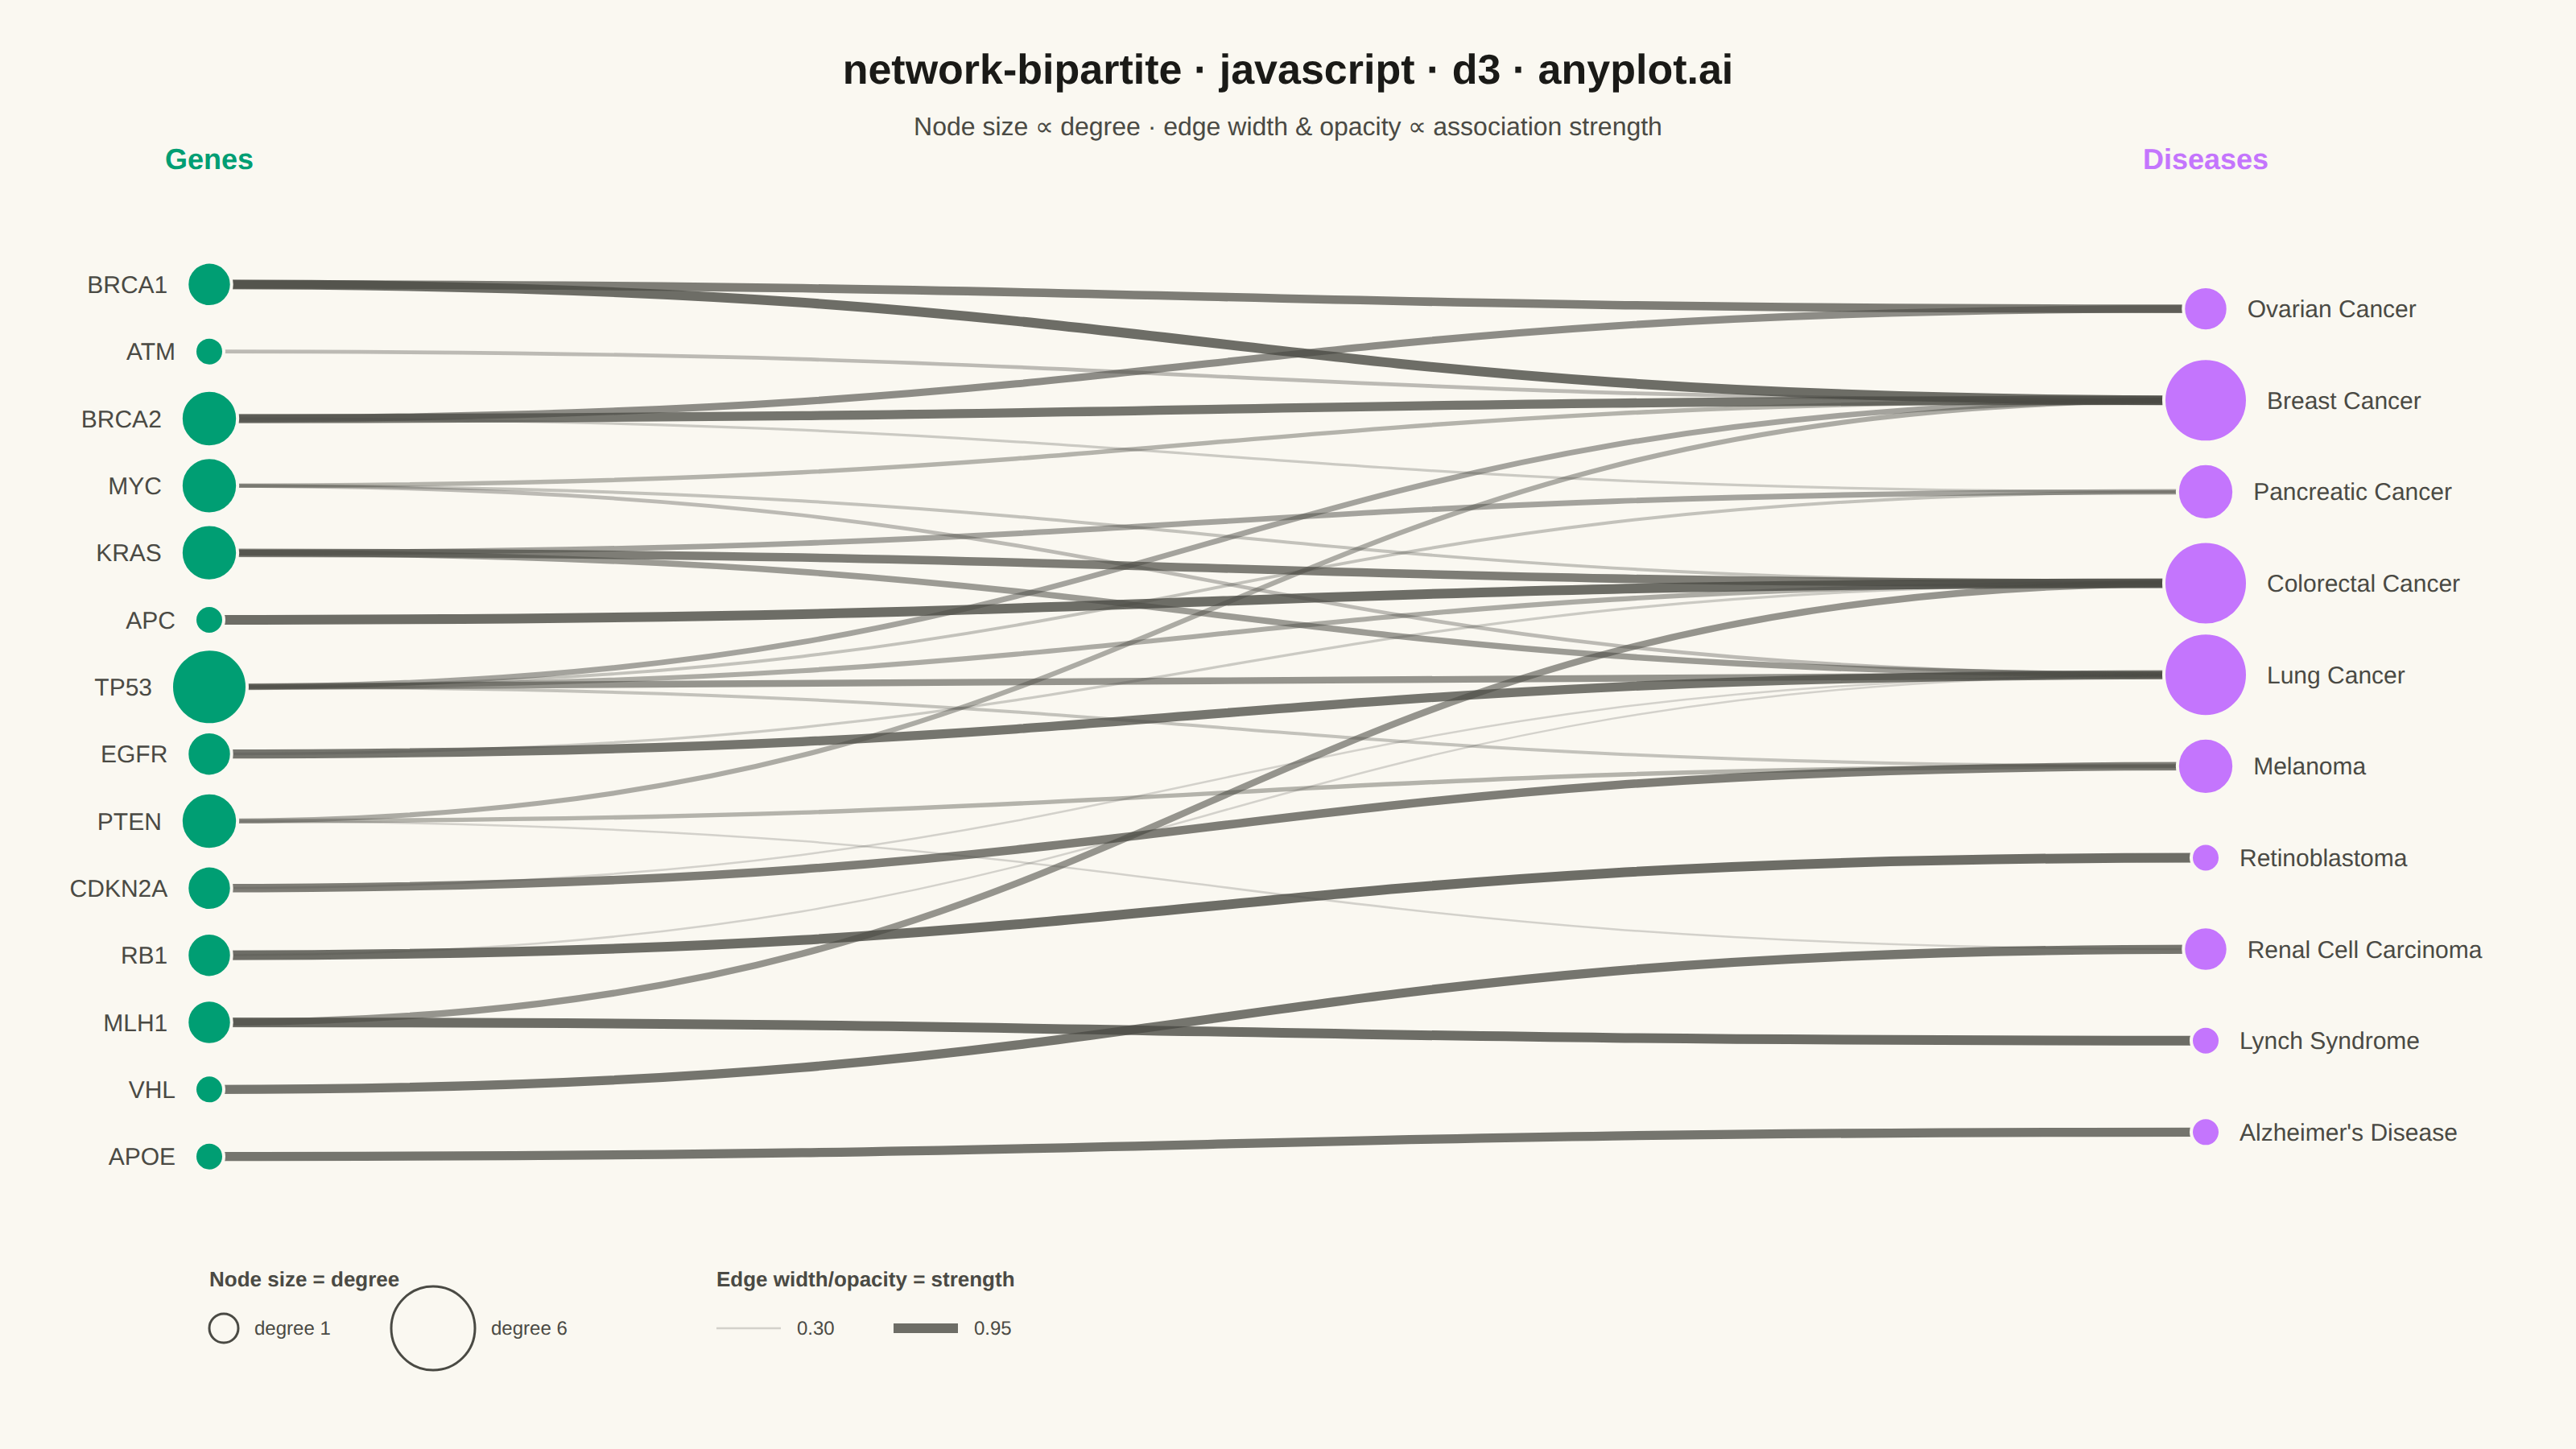
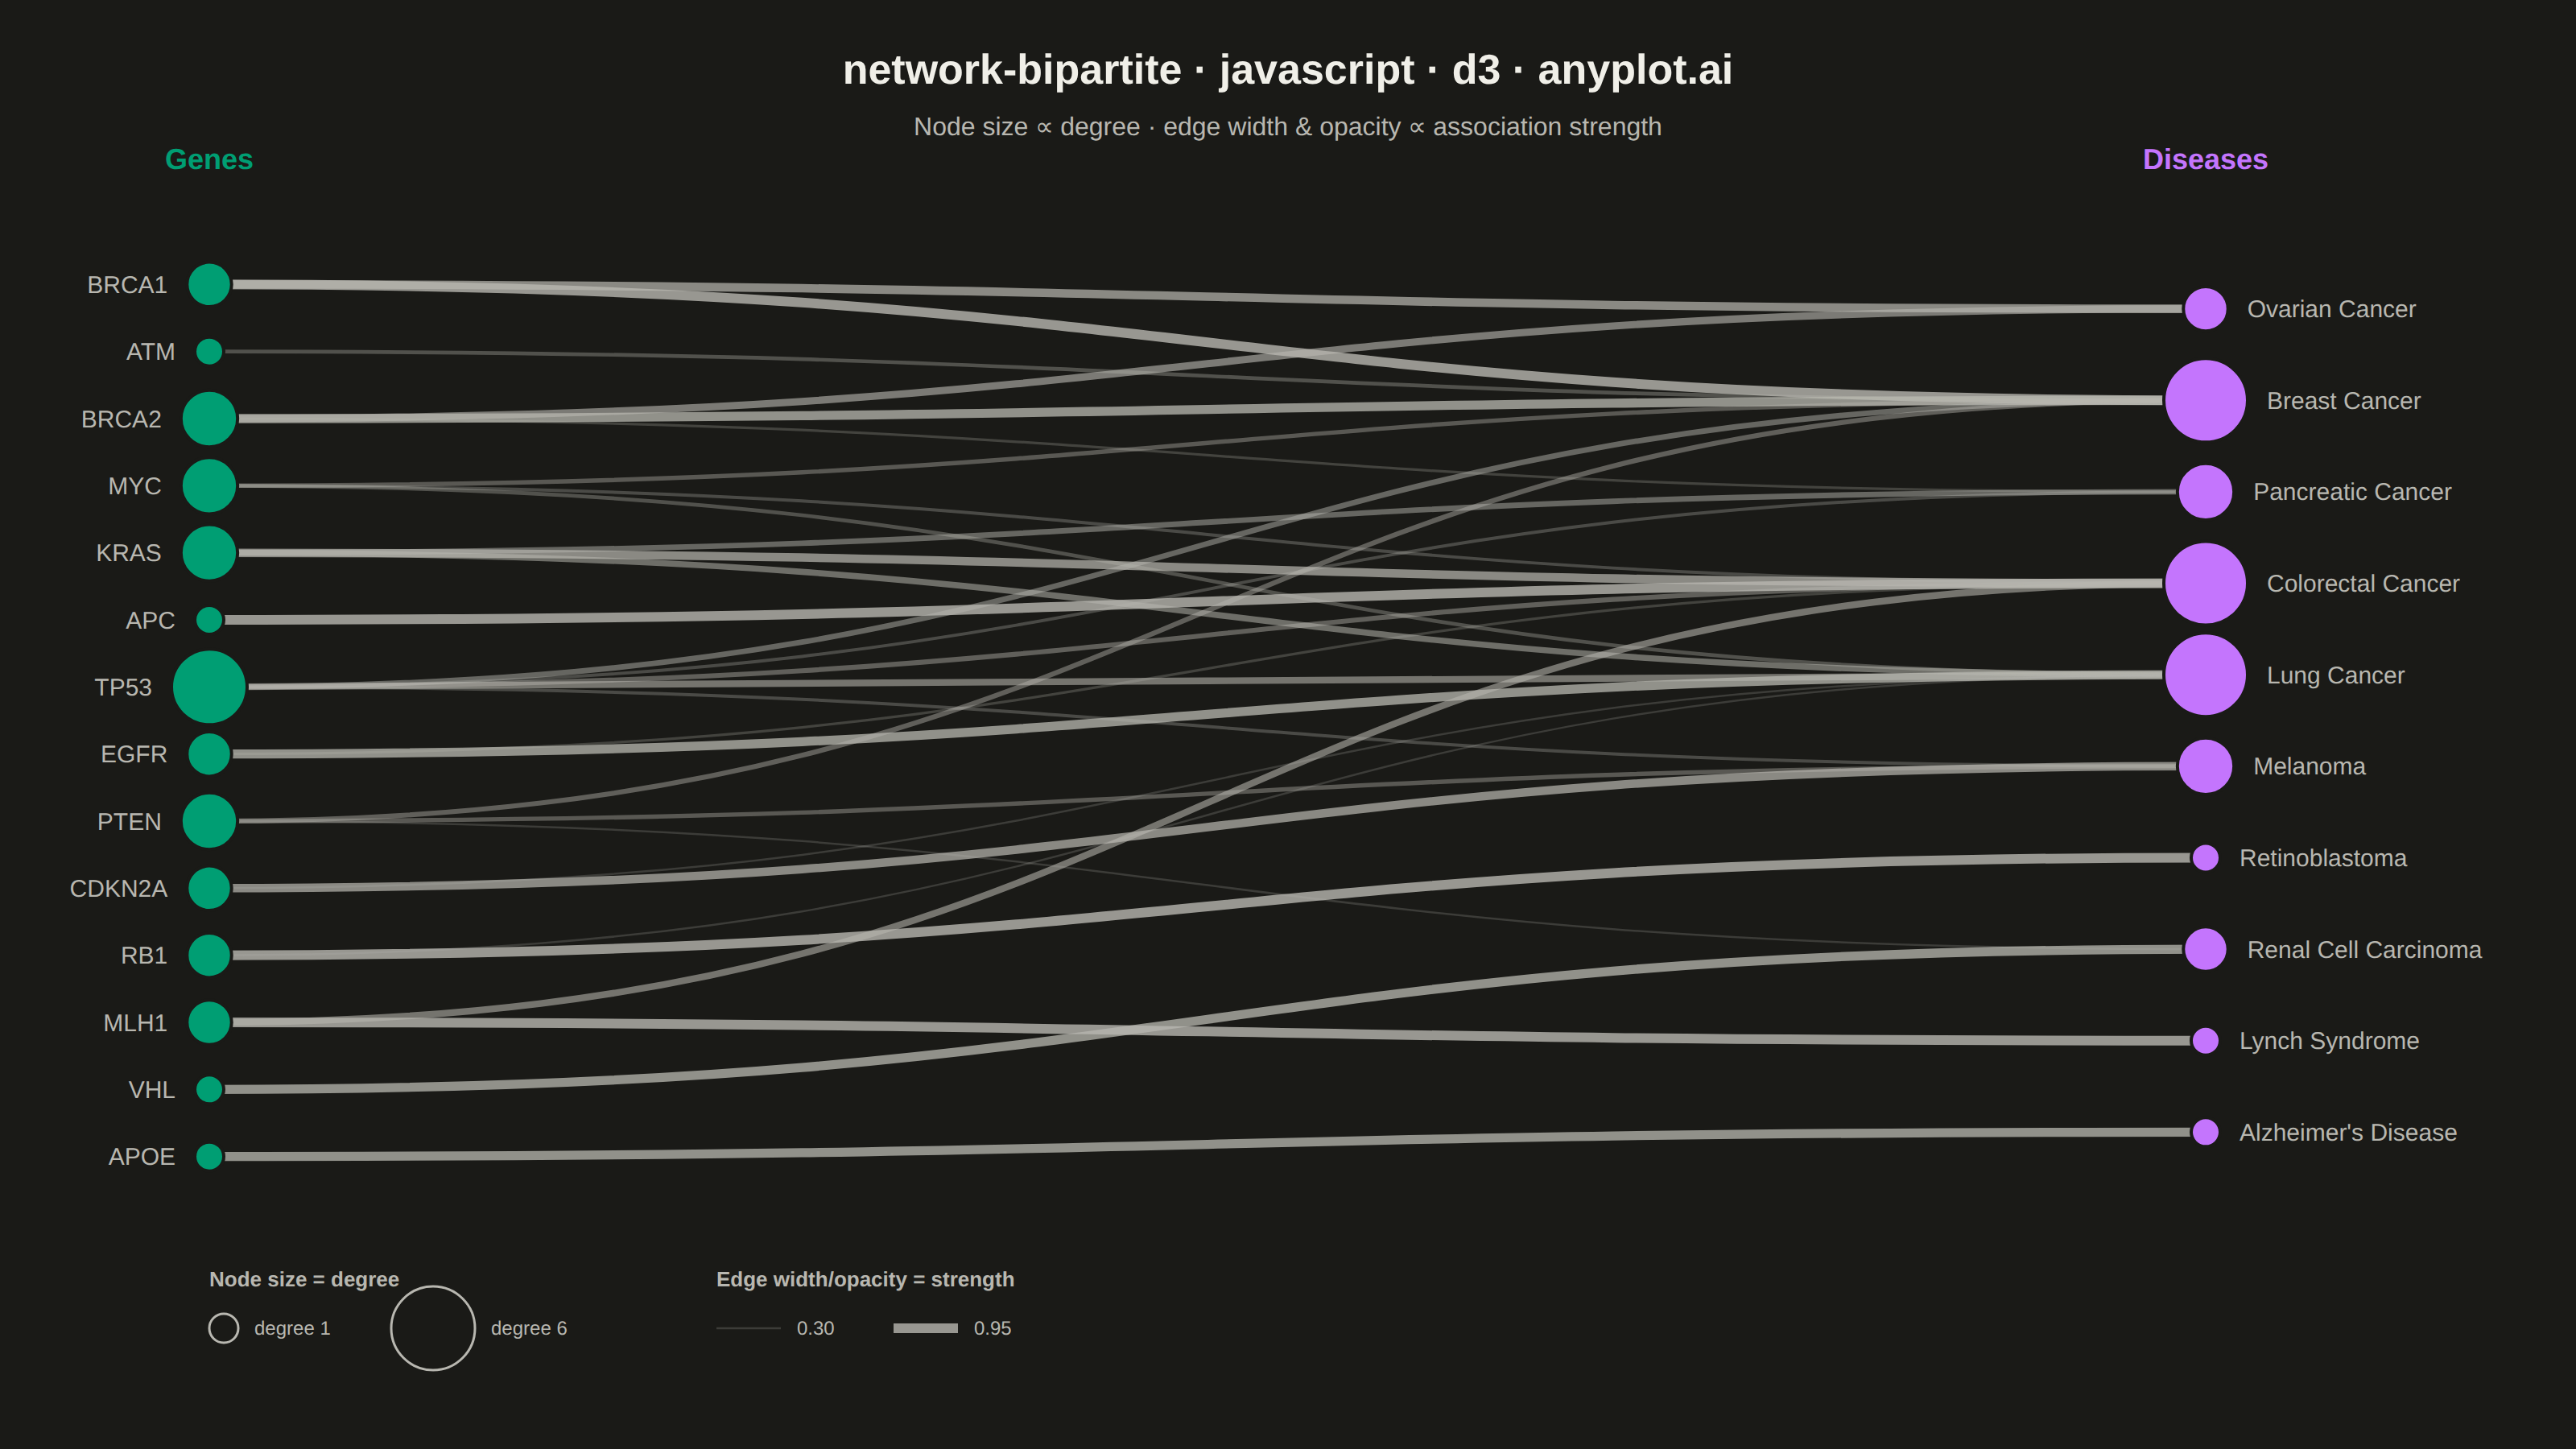
The same plot in 14 other libraries — JavaScript: Chart.js, Apache ECharts, Highcharts, MUI X Charts; Python: Altair, Bokeh, lets-plot, Matplotlib, Plotly, plotnine, Pygal, Seaborn; R: ggplot2; Julia: Makie.jl. Compare all 15 side by side: Bipartite Network Graph in Python, R, Julia and JavaScript.
A bipartite network graph visualizes relationships between two distinct sets of entities, where edges only connect nodes from different sets — never within the same set. The two node groups are arranged in separate columns or rows, making the two-mode structure immediately apparent. This layout is fundamental for understanding cross-category relationships, revealing which entities from one set are linked to which entities in the other, and exposing patterns like hubs, clusters, and isolated nodes.
// anyplot.ai
// network-bipartite: Bipartite Network Graph
// Library: d3 7.9.0 | JavaScript 22.23.2
// Quality: 92/100 | Created: 2026-09-05

const t = window.ANYPLOT_TOKENS;
const { width, height } = window.ANYPLOT_SIZE;

// --- Data (in-memory, deterministic) ----------------------------------------
// Gene-disease association network: which genetic markers are linked to which
// conditions, and how strong the evidence for each link is.
const genes = [
  "BRCA1", "BRCA2", "TP53", "EGFR", "KRAS", "MYC", "PTEN",
  "APC", "VHL", "RB1", "ATM", "CDKN2A", "MLH1", "APOE",
];
const diseases = [
  "Breast Cancer", "Ovarian Cancer", "Lung Cancer", "Colorectal Cancer",
  "Pancreatic Cancer", "Renal Cell Carcinoma", "Retinoblastoma",
  "Melanoma", "Lynch Syndrome", "Alzheimer's Disease",
];
const links = [
  { source: "BRCA1", target: "Breast Cancer", weight: 0.95 },
  { source: "BRCA1", target: "Ovarian Cancer", weight: 0.85 },
  { source: "BRCA2", target: "Breast Cancer", weight: 0.9 },
  { source: "BRCA2", target: "Ovarian Cancer", weight: 0.75 },
  { source: "BRCA2", target: "Pancreatic Cancer", weight: 0.35 },
  { source: "TP53", target: "Breast Cancer", weight: 0.6 },
  { source: "TP53", target: "Lung Cancer", weight: 0.7 },
  { source: "TP53", target: "Colorectal Cancer", weight: 0.55 },
  { source: "TP53", target: "Pancreatic Cancer", weight: 0.4 },
  { source: "TP53", target: "Melanoma", weight: 0.4 },
  { source: "EGFR", target: "Lung Cancer", weight: 0.9 },
  { source: "EGFR", target: "Colorectal Cancer", weight: 0.35 },
  { source: "KRAS", target: "Lung Cancer", weight: 0.65 },
  { source: "KRAS", target: "Colorectal Cancer", weight: 0.85 },
  { source: "KRAS", target: "Pancreatic Cancer", weight: 0.6 },
  { source: "MYC", target: "Breast Cancer", weight: 0.5 },
  { source: "MYC", target: "Lung Cancer", weight: 0.45 },
  { source: "MYC", target: "Colorectal Cancer", weight: 0.4 },
  { source: "PTEN", target: "Breast Cancer", weight: 0.55 },
  { source: "PTEN", target: "Melanoma", weight: 0.5 },
  { source: "PTEN", target: "Renal Cell Carcinoma", weight: 0.3 },
  { source: "APC", target: "Colorectal Cancer", weight: 0.95 },
  { source: "VHL", target: "Renal Cell Carcinoma", weight: 0.9 },
  { source: "RB1", target: "Retinoblastoma", weight: 0.95 },
  { source: "RB1", target: "Lung Cancer", weight: 0.3 },
  { source: "ATM", target: "Breast Cancer", weight: 0.45 },
  { source: "CDKN2A", target: "Melanoma", weight: 0.85 },
  { source: "CDKN2A", target: "Lung Cancer", weight: 0.3 },
  { source: "MLH1", target: "Lynch Syndrome", weight: 0.95 },
  { source: "MLH1", target: "Colorectal Cancer", weight: 0.7 },
  { source: "APOE", target: "Alzheimer's Disease", weight: 0.9 },
];

// Degree = number of edges touching a node, drives node radius.
const degree = new Map([...genes, ...diseases].map((name) => [name, 0]));
for (const l of links) {
  degree.set(l.source, degree.get(l.source) + 1);
  degree.set(l.target, degree.get(l.target) + 1);
}

// --- Reduce edge crossings: barycenter reordering within each column --------
// Alternately sort each column by the mean position of its neighbors in the
// opposite column, converging toward fewer crossing edges.
function barycenterOrder(names, neighbors, oppositeIndex) {
  return [...names].sort((a, b) => {
    const na = neighbors.get(a);
    const nb = neighbors.get(b);
    const ba = na.length ? d3.mean(na, (n) => oppositeIndex.get(n)) : Infinity;
    const bb = nb.length ? d3.mean(nb, (n) => oppositeIndex.get(n)) : Infinity;
    return ba - bb;
  });
}
const geneNeighbors = new Map(genes.map((g) => [g, links.filter((l) => l.source === g).map((l) => l.target)]));
const diseaseNeighbors = new Map(diseases.map((d) => [d, links.filter((l) => l.target === d).map((l) => l.source)]));

let orderedGenes = genes;
let orderedDiseases = diseases;
for (let i = 0; i < 4; i++) {
  const diseaseIndex = new Map(orderedDiseases.map((name, idx) => [name, idx]));
  orderedGenes = barycenterOrder(orderedGenes, geneNeighbors, diseaseIndex);
  const geneIndex = new Map(orderedGenes.map((name, idx) => [name, idx]));
  orderedDiseases = barycenterOrder(orderedDiseases, diseaseNeighbors, geneIndex);
}

// --- Layout ------------------------------------------------------------------
const margin = { top: 135, right: 230, bottom: 140, left: 130 };
const iw = width - margin.left - margin.right;
const ih = height - margin.top - margin.bottom;
const leftX = 0;
const rightX = iw;

function columnPositions(names) {
  const step = ih / (names.length + 1);
  return new Map(names.map((name, i) => [name, (i + 1) * step]));
}
const genesY = columnPositions(orderedGenes);
const diseasesY = columnPositions(orderedDiseases);

const maxDegree = d3.max([...degree.values()]);
const radius = d3.scaleSqrt().domain([1, maxDegree]).range([9, 26]);
const weightExtent = d3.extent(links, (d) => d.weight);
const edgeWidth = d3.scaleLinear().domain(weightExtent).range([1.25, 6]);
const edgeOpacity = d3.scaleLinear().domain(weightExtent).range([0.22, 0.8]);

// --- SVG mount -----------------------------------------------------------
const svg = d3.select("#container").append("svg").attr("width", width).attr("height", height);
const g = svg.append("g").attr("transform", `translate(${margin.left},${margin.top})`);

// --- Edges: d3-shape horizontal links between the two columns ---------------
const linkGenerator = d3.linkHorizontal()
  .source((d) => [leftX, genesY.get(d.source)])
  .target((d) => [rightX, diseasesY.get(d.target)]);

g.append("g")
  .selectAll("path")
  .data(links)
  .join("path")
  .attr("d", linkGenerator)
  .attr("fill", "none")
  .attr("stroke", t.inkSoft)
  .attr("stroke-width", (d) => edgeWidth(d.weight))
  .attr("stroke-opacity", (d) => edgeOpacity(d.weight));

// --- Nodes: genes (left column) --------------------------------------------
g.append("g")
  .selectAll("circle")
  .data(orderedGenes)
  .join("circle")
  .attr("cx", leftX)
  .attr("cy", (d) => genesY.get(d))
  .attr("r", (d) => radius(degree.get(d)))
  .attr("fill", t.palette[0])
  .attr("stroke", t.pageBg)
  .attr("stroke-width", 2);

g.append("g")
  .selectAll("text")
  .data(orderedGenes)
  .join("text")
  .attr("x", (d) => leftX - radius(degree.get(d)) - 12)
  .attr("y", (d) => genesY.get(d))
  .attr("dy", "0.35em")
  .attr("text-anchor", "end")
  .attr("fill", t.inkSoft)
  .style("font-size", "15px")
  .text((d) => d);

// --- Nodes: diseases (right column) -----------------------------------------
g.append("g")
  .selectAll("circle")
  .data(orderedDiseases)
  .join("circle")
  .attr("cx", rightX)
  .attr("cy", (d) => diseasesY.get(d))
  .attr("r", (d) => radius(degree.get(d)))
  .attr("fill", t.palette[1])
  .attr("stroke", t.pageBg)
  .attr("stroke-width", 2);

g.append("g")
  .selectAll("text")
  .data(orderedDiseases)
  .join("text")
  .attr("x", (d) => rightX + radius(degree.get(d)) + 12)
  .attr("y", (d) => diseasesY.get(d))
  .attr("dy", "0.35em")
  .attr("text-anchor", "start")
  .attr("fill", t.inkSoft)
  .style("font-size", "15px")
  .text((d) => d);

// --- Column headers double as the set-membership legend ---------------------
g.append("text")
  .attr("x", leftX)
  .attr("y", -30)
  .attr("text-anchor", "middle")
  .attr("fill", t.palette[0])
  .style("font-size", "18px")
  .style("font-weight", "600")
  .text("Genes");

g.append("text")
  .attr("x", rightX)
  .attr("y", -30)
  .attr("text-anchor", "middle")
  .attr("fill", t.palette[1])
  .style("font-size", "18px")
  .style("font-weight", "600")
  .text("Diseases");

// --- Legend: degree -> radius and weight -> width/opacity keys --------------
const legend = g.append("g").attr("transform", `translate(0,${ih + 55})`);

legend.append("text")
  .attr("x", 0)
  .attr("y", -16)
  .attr("fill", t.inkSoft)
  .style("font-size", "13px")
  .style("font-weight", "600")
  .text("Node size = degree");

let sx = 0;
for (const d of [1, maxDegree]) {
  const r = radius(d);
  legend.append("circle")
    .attr("cx", sx + r)
    .attr("cy", 10)
    .attr("r", r)
    .attr("fill", "none")
    .attr("stroke", t.inkSoft)
    .attr("stroke-width", 1.5);
  legend.append("text")
    .attr("x", sx + 2 * r + 10)
    .attr("y", 10)
    .attr("dy", "0.35em")
    .attr("fill", t.inkSoft)
    .style("font-size", "12px")
    .text(`degree ${d}`);
  sx += 2 * r + 10 + 85;
}

const weightX = sx + 55;
legend.append("text")
  .attr("x", weightX)
  .attr("y", -16)
  .attr("fill", t.inkSoft)
  .style("font-size", "13px")
  .style("font-weight", "600")
  .text("Edge width/opacity = strength");

let wx = weightX;
for (const w of weightExtent) {
  legend.append("line")
    .attr("x1", wx)
    .attr("x2", wx + 40)
    .attr("y1", 10)
    .attr("y2", 10)
    .attr("stroke", t.inkSoft)
    .attr("stroke-width", edgeWidth(w))
    .attr("stroke-opacity", edgeOpacity(w));
  legend.append("text")
    .attr("x", wx + 50)
    .attr("y", 10)
    .attr("dy", "0.35em")
    .attr("fill", t.inkSoft)
    .style("font-size", "12px")
    .text(w.toFixed(2));
  wx += 110;
}

// --- Title + subtitle --------------------------------------------------------
svg.append("text")
  .attr("x", width / 2)
  .attr("y", 52)
  .attr("text-anchor", "middle")
  .attr("fill", t.ink)
  .style("font-size", "26px")
  .style("font-weight", "600")
  .text("network-bipartite · javascript · d3 · anyplot.ai");

svg.append("text")
  .attr("x", width / 2)
  .attr("y", 84)
  .attr("text-anchor", "middle")
  .attr("fill", t.inkSoft)
  .style("font-size", "16px")
  .text("Node size ∝ degree · edge width & opacity ∝ association strength");
Runnable source as JSON, for any HTTP client: https://api.anyplot.ai/specs/network-bipartite/d3/code. Any spec id and library id listed in llms-full.txt fit the same URL shape; every URL below is complete and callable.
{
  "spec_id": "network-bipartite",
  "language": "javascript",
  "library": "d3",
  "page": "https://anyplot.ai/network-bipartite/javascript/d3",
  "hub": "https://anyplot.ai/network-bipartite",
  "code_json": "https://api.anyplot.ai/specs/network-bipartite/d3/code",
  "spec_json": "https://api.anyplot.ai/specs/network-bipartite",
  "render_light_png": "https://storage.googleapis.com/anyplot-images/plots/network-bipartite/javascript/d3/plot-light.png",
  "render_dark_png": "https://storage.googleapis.com/anyplot-images/plots/network-bipartite/javascript/d3/plot-dark.png",
  "interactive_light_html": "https://storage.googleapis.com/anyplot-images/plots/network-bipartite/javascript/d3/plot-light.html",
  "interactive_dark_html": "https://storage.googleapis.com/anyplot-images/plots/network-bipartite/javascript/d3/plot-dark.html",
  "quality_score": 92.0,
  "license": "MIT",
  "guide": "https://anyplot.ai/llms.txt"
}
Part of Bipartite Network Graph on anyplot.ai.