The same plot in 14 other libraries — Python: Altair, Bokeh, lets-plot, Matplotlib, Plotly, Pygal, Seaborn; R: ggplot2; Julia: Makie.jl; JavaScript: Chart.js, D3.js, Apache ECharts, Highcharts, MUI X Charts. Compare all 15 side by side: Bipartite Network Graph in Python, R, Julia and JavaScript.
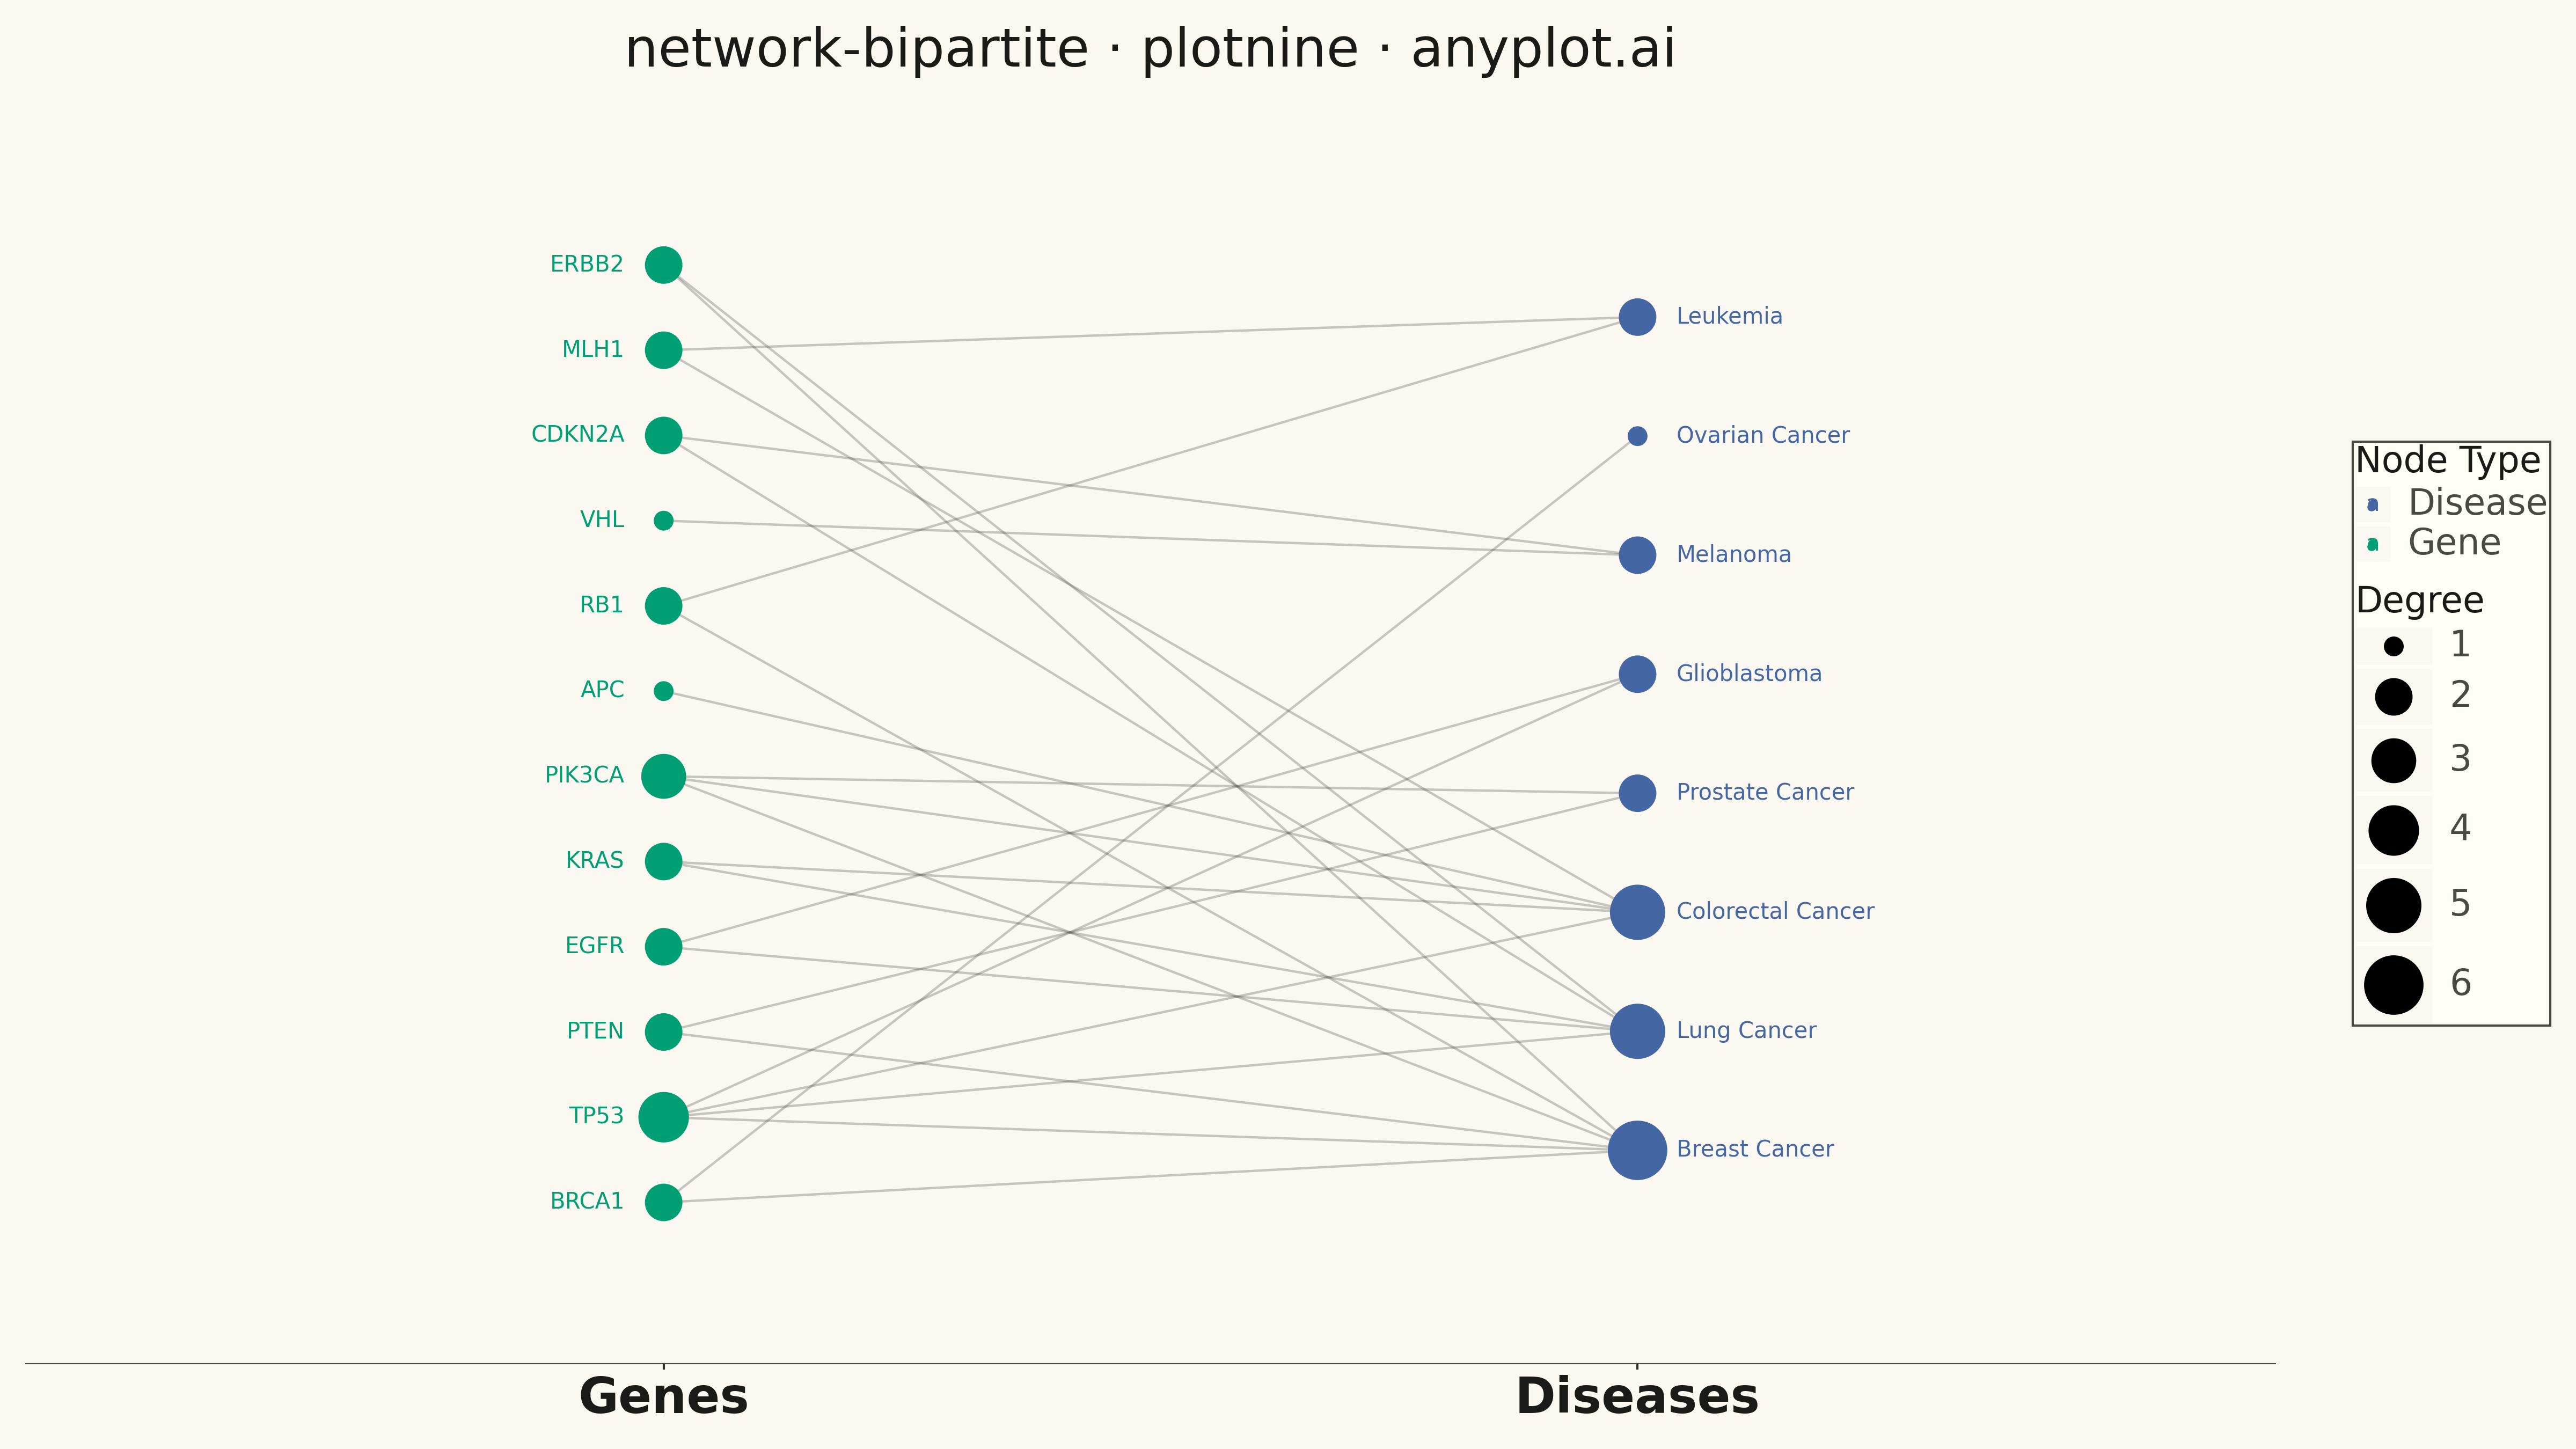
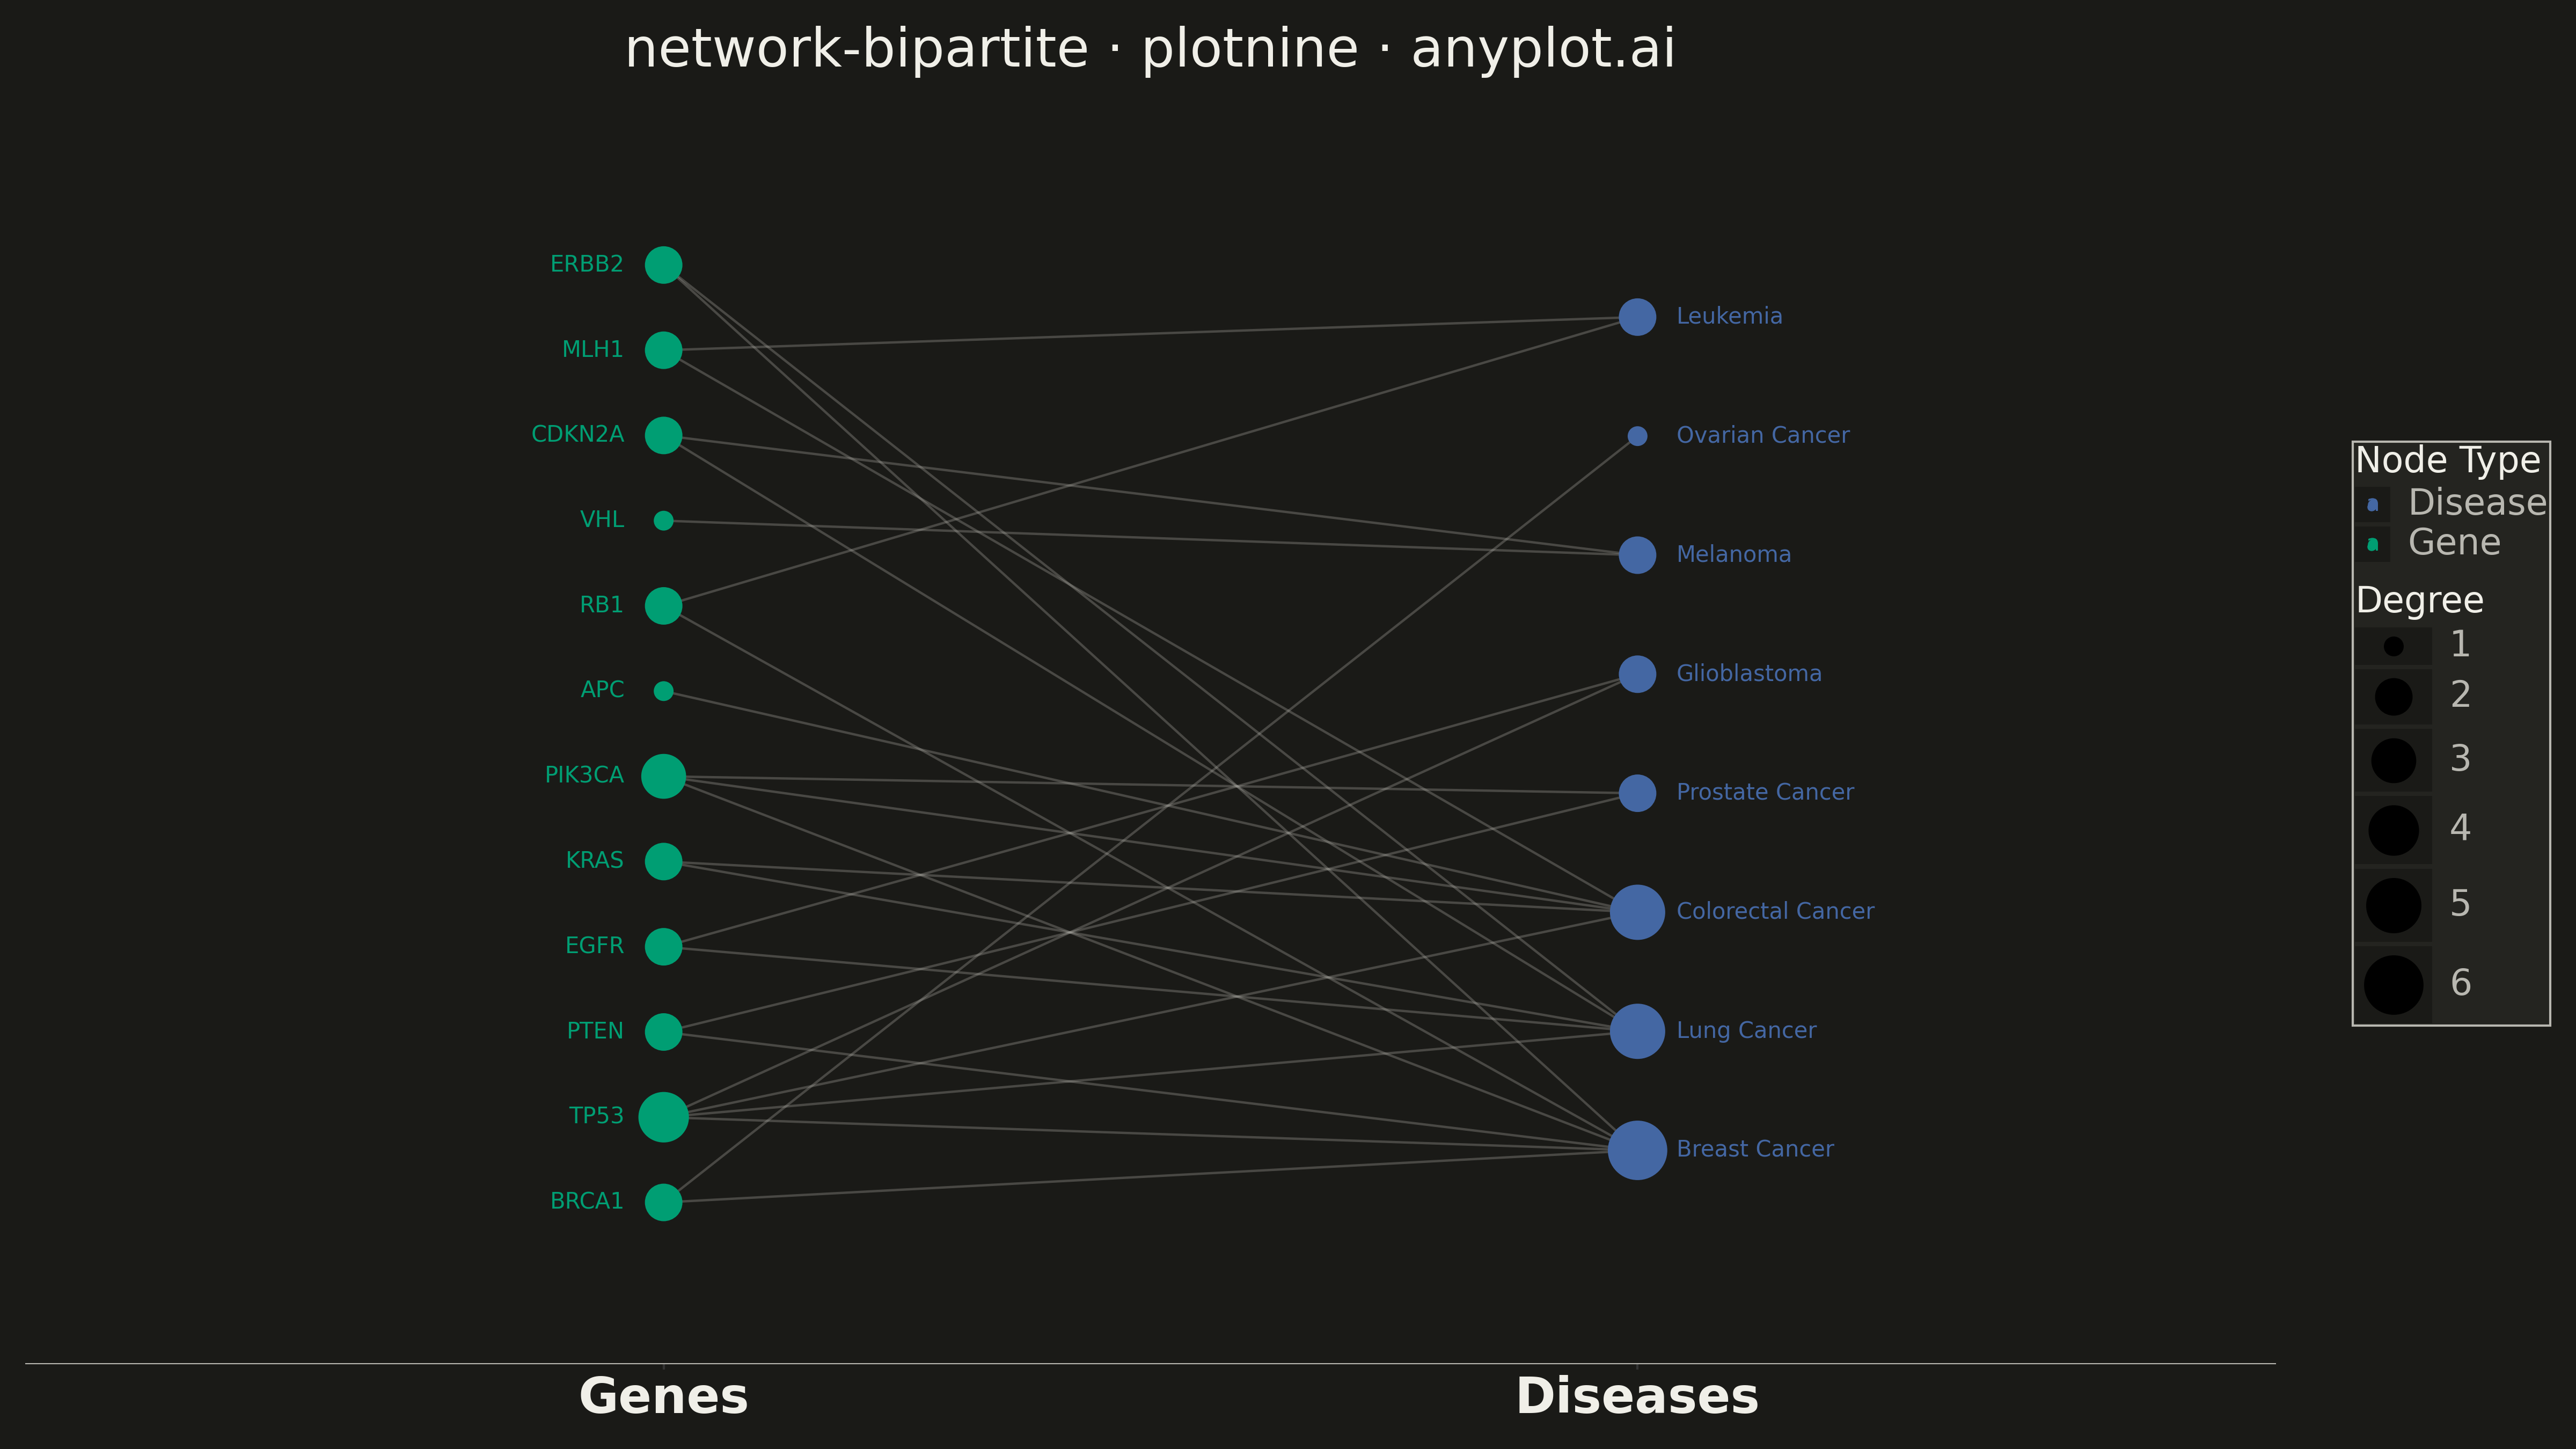
A bipartite network graph visualizes relationships between two distinct sets of entities, where edges only connect nodes from different sets — never within the same set. The two node groups are arranged in separate columns or rows, making the two-mode structure immediately apparent. This layout is fundamental for understanding cross-category relationships, revealing which entities from one set are linked to which entities in the other, and exposing patterns like hubs, clusters, and isolated nodes.
""" anyplot.ai
network-bipartite: Bipartite Network Graph
Library: plotnine 0.15.4 | Python 3.13.13
Quality: 84/100 | Created: 2026-05-14
"""

import os
import sys


# Workaround for module/filename conflict: remove current dir from path persistently
sys.path = [p for p in sys.path if not p.startswith(os.path.dirname(os.path.abspath(__file__)))]

import numpy as np
import pandas as pd
from plotnine import (
    aes,
    element_blank,
    element_line,
    element_rect,
    element_text,
    geom_point,
    geom_segment,
    geom_text,
    ggplot,
    labs,
    scale_color_manual,
    scale_size_continuous,
    scale_x_continuous,
    scale_y_continuous,
    theme,
)


np.random.seed(42)

THEME = os.getenv("ANYPLOT_THEME", "light")
PAGE_BG = "#FAF8F1" if THEME == "light" else "#1A1A17"
ELEVATED_BG = "#FFFDF6" if THEME == "light" else "#242420"
INK = "#1A1A17" if THEME == "light" else "#F0EFE8"
INK_SOFT = "#4A4A44" if THEME == "light" else "#B8B7B0"

COLOR_GENE = "#009E73"  # Okabe-Ito position 1
COLOR_DISEASE = "#4467A3"  # Okabe-Ito position 3

# Data: gene–disease association network in bioinformatics
genes = ["BRCA1", "TP53", "PTEN", "EGFR", "KRAS", "PIK3CA", "APC", "RB1", "VHL", "CDKN2A", "MLH1", "ERBB2"]
diseases = [
    "Breast Cancer",
    "Lung Cancer",
    "Colorectal Cancer",
    "Prostate Cancer",
    "Glioblastoma",
    "Melanoma",
    "Ovarian Cancer",
    "Leukemia",
]

# (gene_index, disease_index) edges
connections = [
    (0, 0),
    (0, 6),
    (1, 0),
    (1, 1),
    (1, 2),
    (1, 4),
    (2, 0),
    (2, 3),
    (3, 1),
    (3, 4),
    (4, 1),
    (4, 2),
    (5, 0),
    (5, 2),
    (5, 3),
    (6, 2),
    (7, 0),
    (7, 7),
    (8, 5),
    (9, 1),
    (9, 5),
    (10, 2),
    (10, 7),
    (11, 0),
    (11, 1),
]

gene_y = np.linspace(0.05, 0.95, len(genes))
disease_y = np.linspace(0.10, 0.90, len(diseases))

gene_df = pd.DataFrame(
    {
        "label": genes,
        "x": 0.0,
        "y": gene_y,
        "node_set": "Gene",
        "degree": [sum(1 for g, _ in connections if g == i) for i in range(len(genes))],
    }
)
disease_df = pd.DataFrame(
    {
        "label": diseases,
        "x": 1.0,
        "y": disease_y,
        "node_set": "Disease",
        "degree": [sum(1 for _, d in connections if d == i) for i in range(len(diseases))],
    }
)
nodes = pd.concat([gene_df, disease_df], ignore_index=True)

edges = pd.DataFrame(
    {
        "x": [gene_df.iloc[g]["x"] for g, _ in connections],
        "y": [gene_df.iloc[g]["y"] for g, _ in connections],
        "xend": [disease_df.iloc[d]["x"] for _, d in connections],
        "yend": [disease_df.iloc[d]["y"] for _, d in connections],
    }
)

# Plot
plot = (
    ggplot()
    + geom_segment(aes(x="x", y="y", xend="xend", yend="yend"), data=edges, color=INK_SOFT, alpha=0.30, size=0.6)
    + geom_point(aes(x="x", y="y", color="node_set", size="degree"), data=nodes)
    + geom_text(aes(x="x", y="y", label="label", color="node_set"), data=gene_df, ha="right", nudge_x=-0.04, size=10)
    + geom_text(aes(x="x", y="y", label="label", color="node_set"), data=disease_df, ha="left", nudge_x=0.04, size=10)
    + scale_color_manual(values={"Gene": COLOR_GENE, "Disease": COLOR_DISEASE}, name="Node Type")
    + scale_size_continuous(range=(4, 14), name="Degree")
    + scale_x_continuous(limits=(-0.55, 1.55), breaks=[0, 1], labels=["Genes", "Diseases"])
    + scale_y_continuous(limits=(-0.05, 1.05))
    + labs(title="network-bipartite · plotnine · anyplot.ai", x="", y="")
    + theme(
        figure_size=(16, 9),
        plot_background=element_rect(fill=PAGE_BG, color=PAGE_BG),
        panel_background=element_rect(fill=PAGE_BG),
        panel_grid_major=element_blank(),
        panel_grid_minor=element_blank(),
        panel_border=element_blank(),
        axis_title=element_blank(),
        axis_text_x=element_text(color=INK, size=22, face="bold"),
        axis_text_y=element_blank(),
        axis_ticks_major_y=element_blank(),
        axis_ticks_minor_y=element_blank(),
        axis_line_x=element_line(color=INK_SOFT, size=0.5),
        plot_title=element_text(color=INK, size=24),
        legend_background=element_rect(fill=ELEVATED_BG, color=INK_SOFT),
        legend_text=element_text(color=INK_SOFT, size=16),
        legend_title=element_text(color=INK, size=16),
    )
)

plot.save(f"plot-{THEME}.png", dpi=300, width=16, height=9)
Runnable source as JSON, for any HTTP client: https://api.anyplot.ai/specs/network-bipartite/plotnine/code. Any spec id and library id listed in llms-full.txt fit the same URL shape; every URL below is complete and callable.
{
  "spec_id": "network-bipartite",
  "language": "python",
  "library": "plotnine",
  "page": "https://anyplot.ai/network-bipartite/python/plotnine",
  "hub": "https://anyplot.ai/network-bipartite",
  "code_json": "https://api.anyplot.ai/specs/network-bipartite/plotnine/code",
  "spec_json": "https://api.anyplot.ai/specs/network-bipartite",
  "render_light_png": "https://storage.googleapis.com/anyplot-images/plots/network-bipartite/python/plotnine/plot-light.png",
  "render_dark_png": "https://storage.googleapis.com/anyplot-images/plots/network-bipartite/python/plotnine/plot-dark.png",
  "quality_score": 84.0,
  "license": "MIT",
  "guide": "https://anyplot.ai/llms.txt"
}
Part of Bipartite Network Graph on anyplot.ai.