The same plot in 14 other libraries — Python: Bokeh, lets-plot, Matplotlib, Plotly, plotnine, Pygal, Seaborn; R: ggplot2; Julia: Makie.jl; JavaScript: Chart.js, D3.js, Apache ECharts, Highcharts, MUI X Charts. Compare all 15 side by side: Bipartite Network Graph in Python, R, Julia and JavaScript.
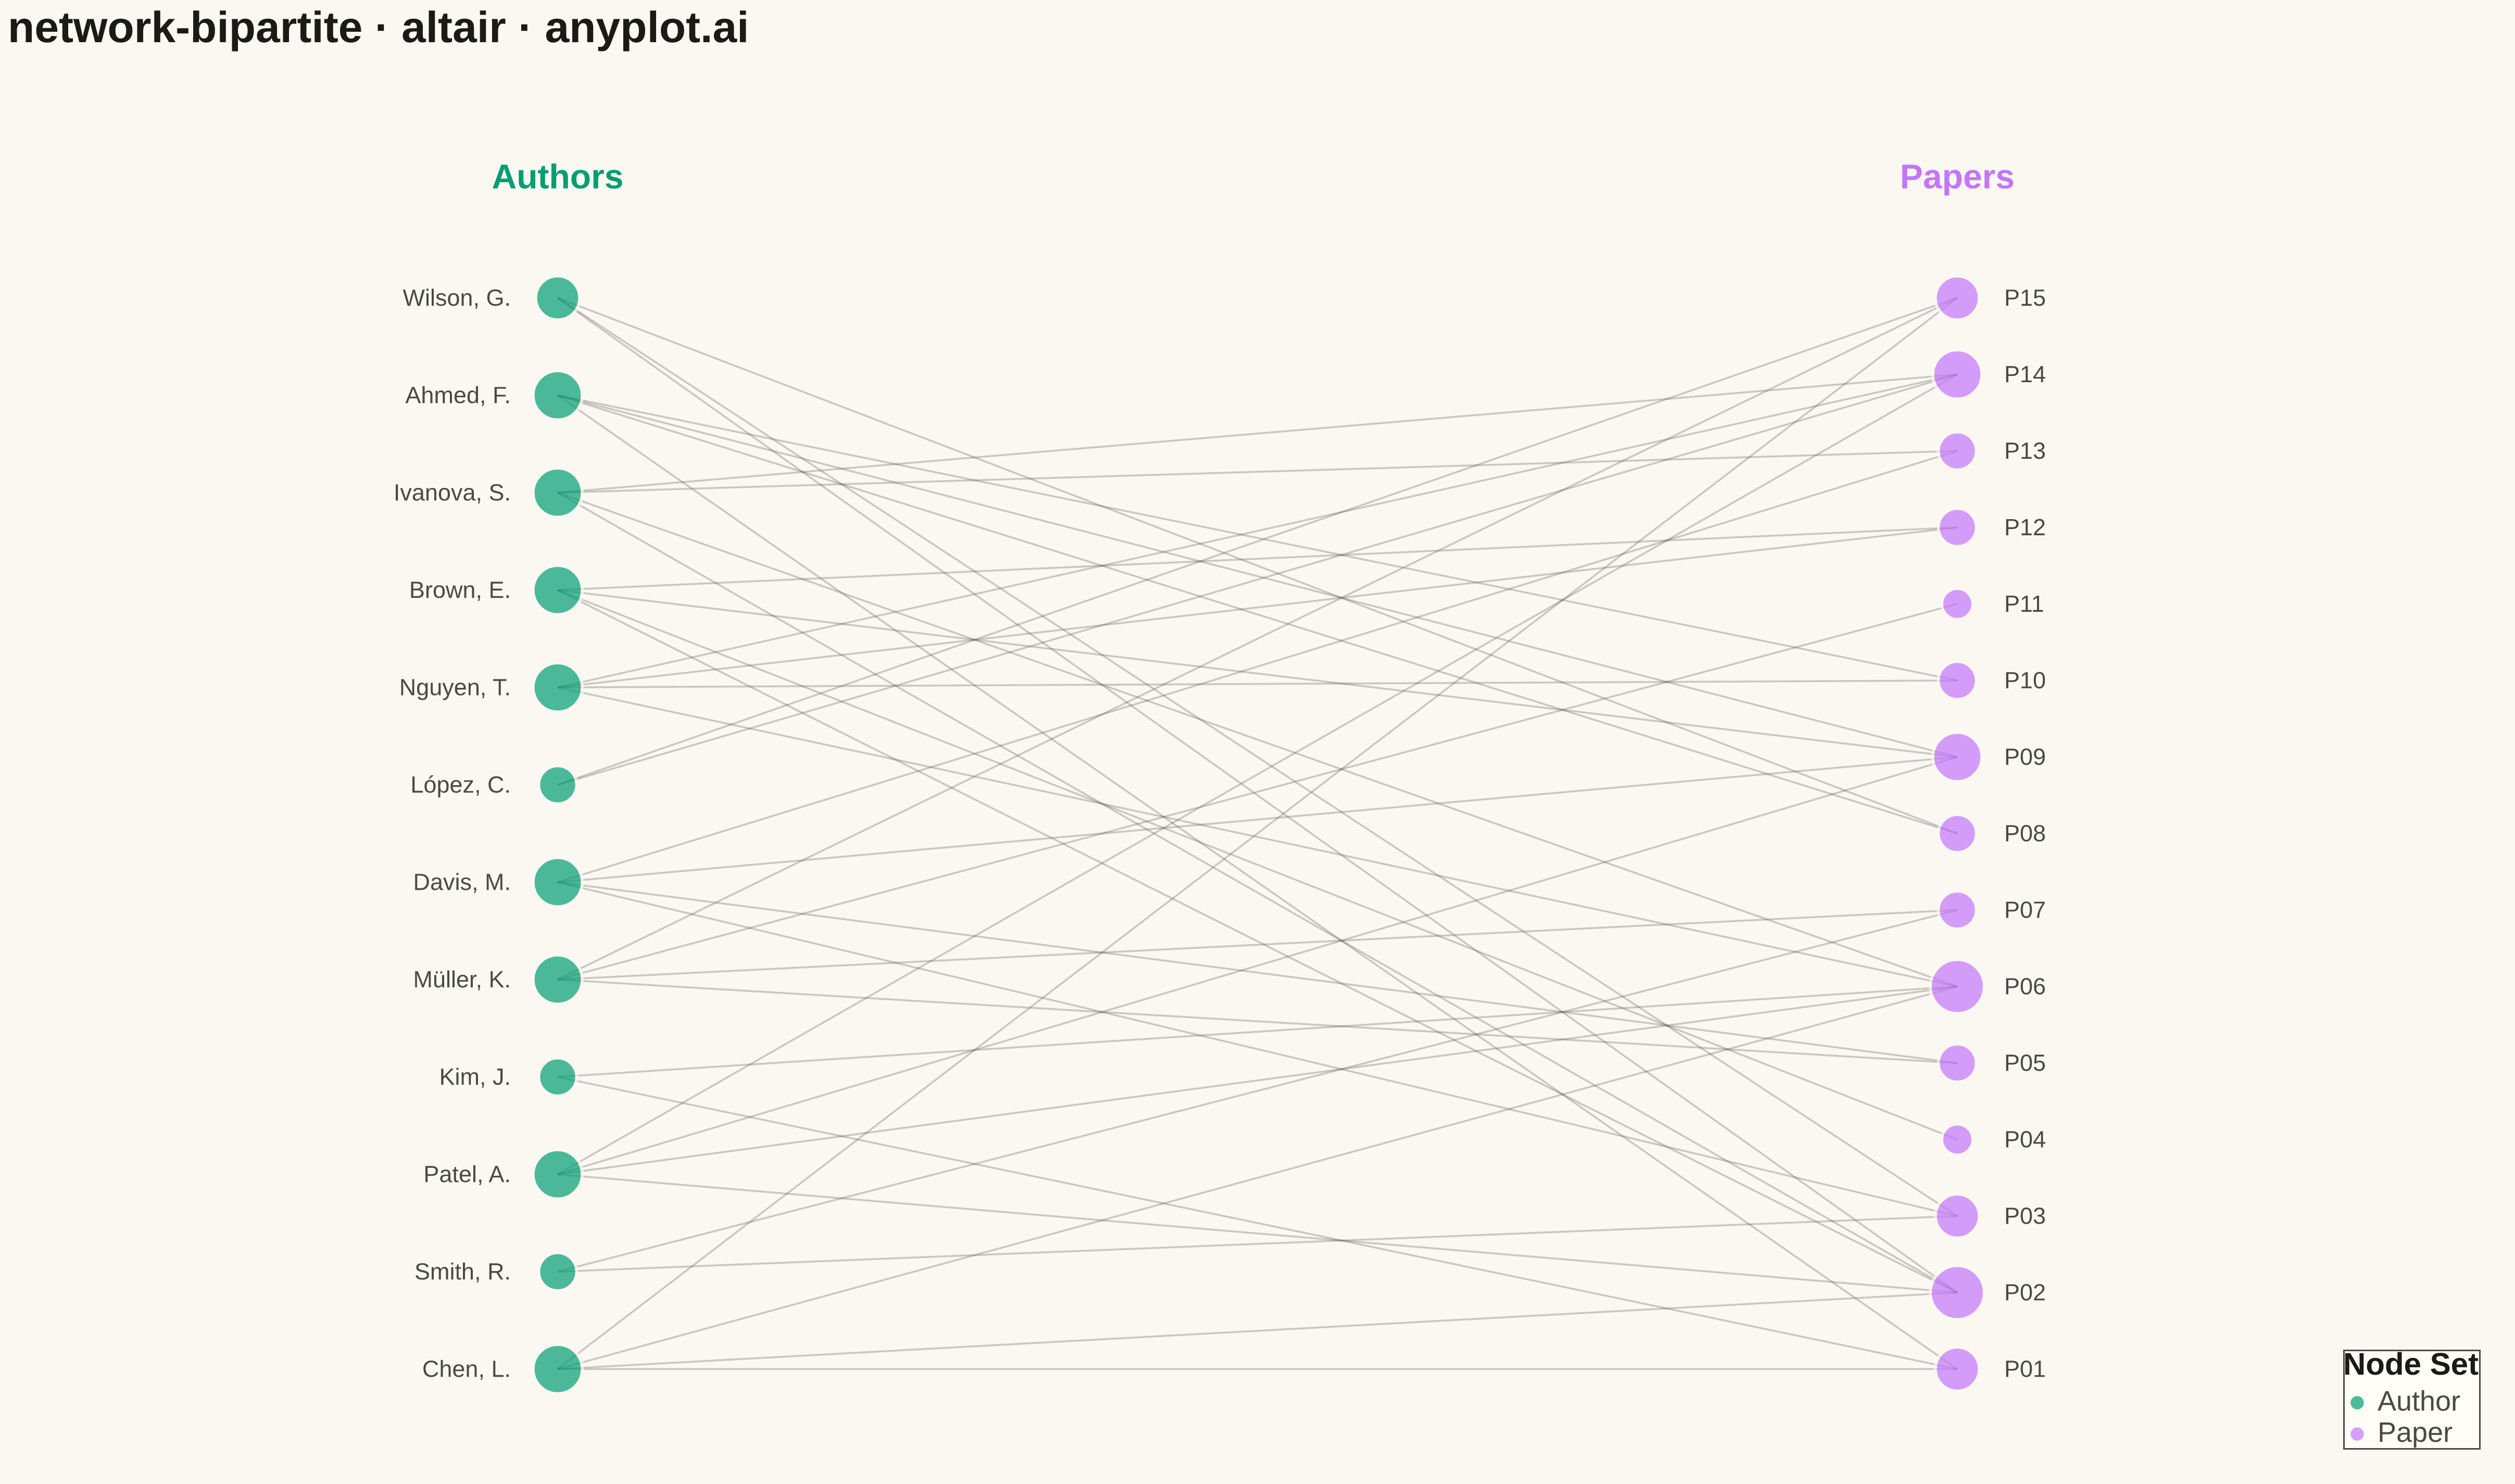
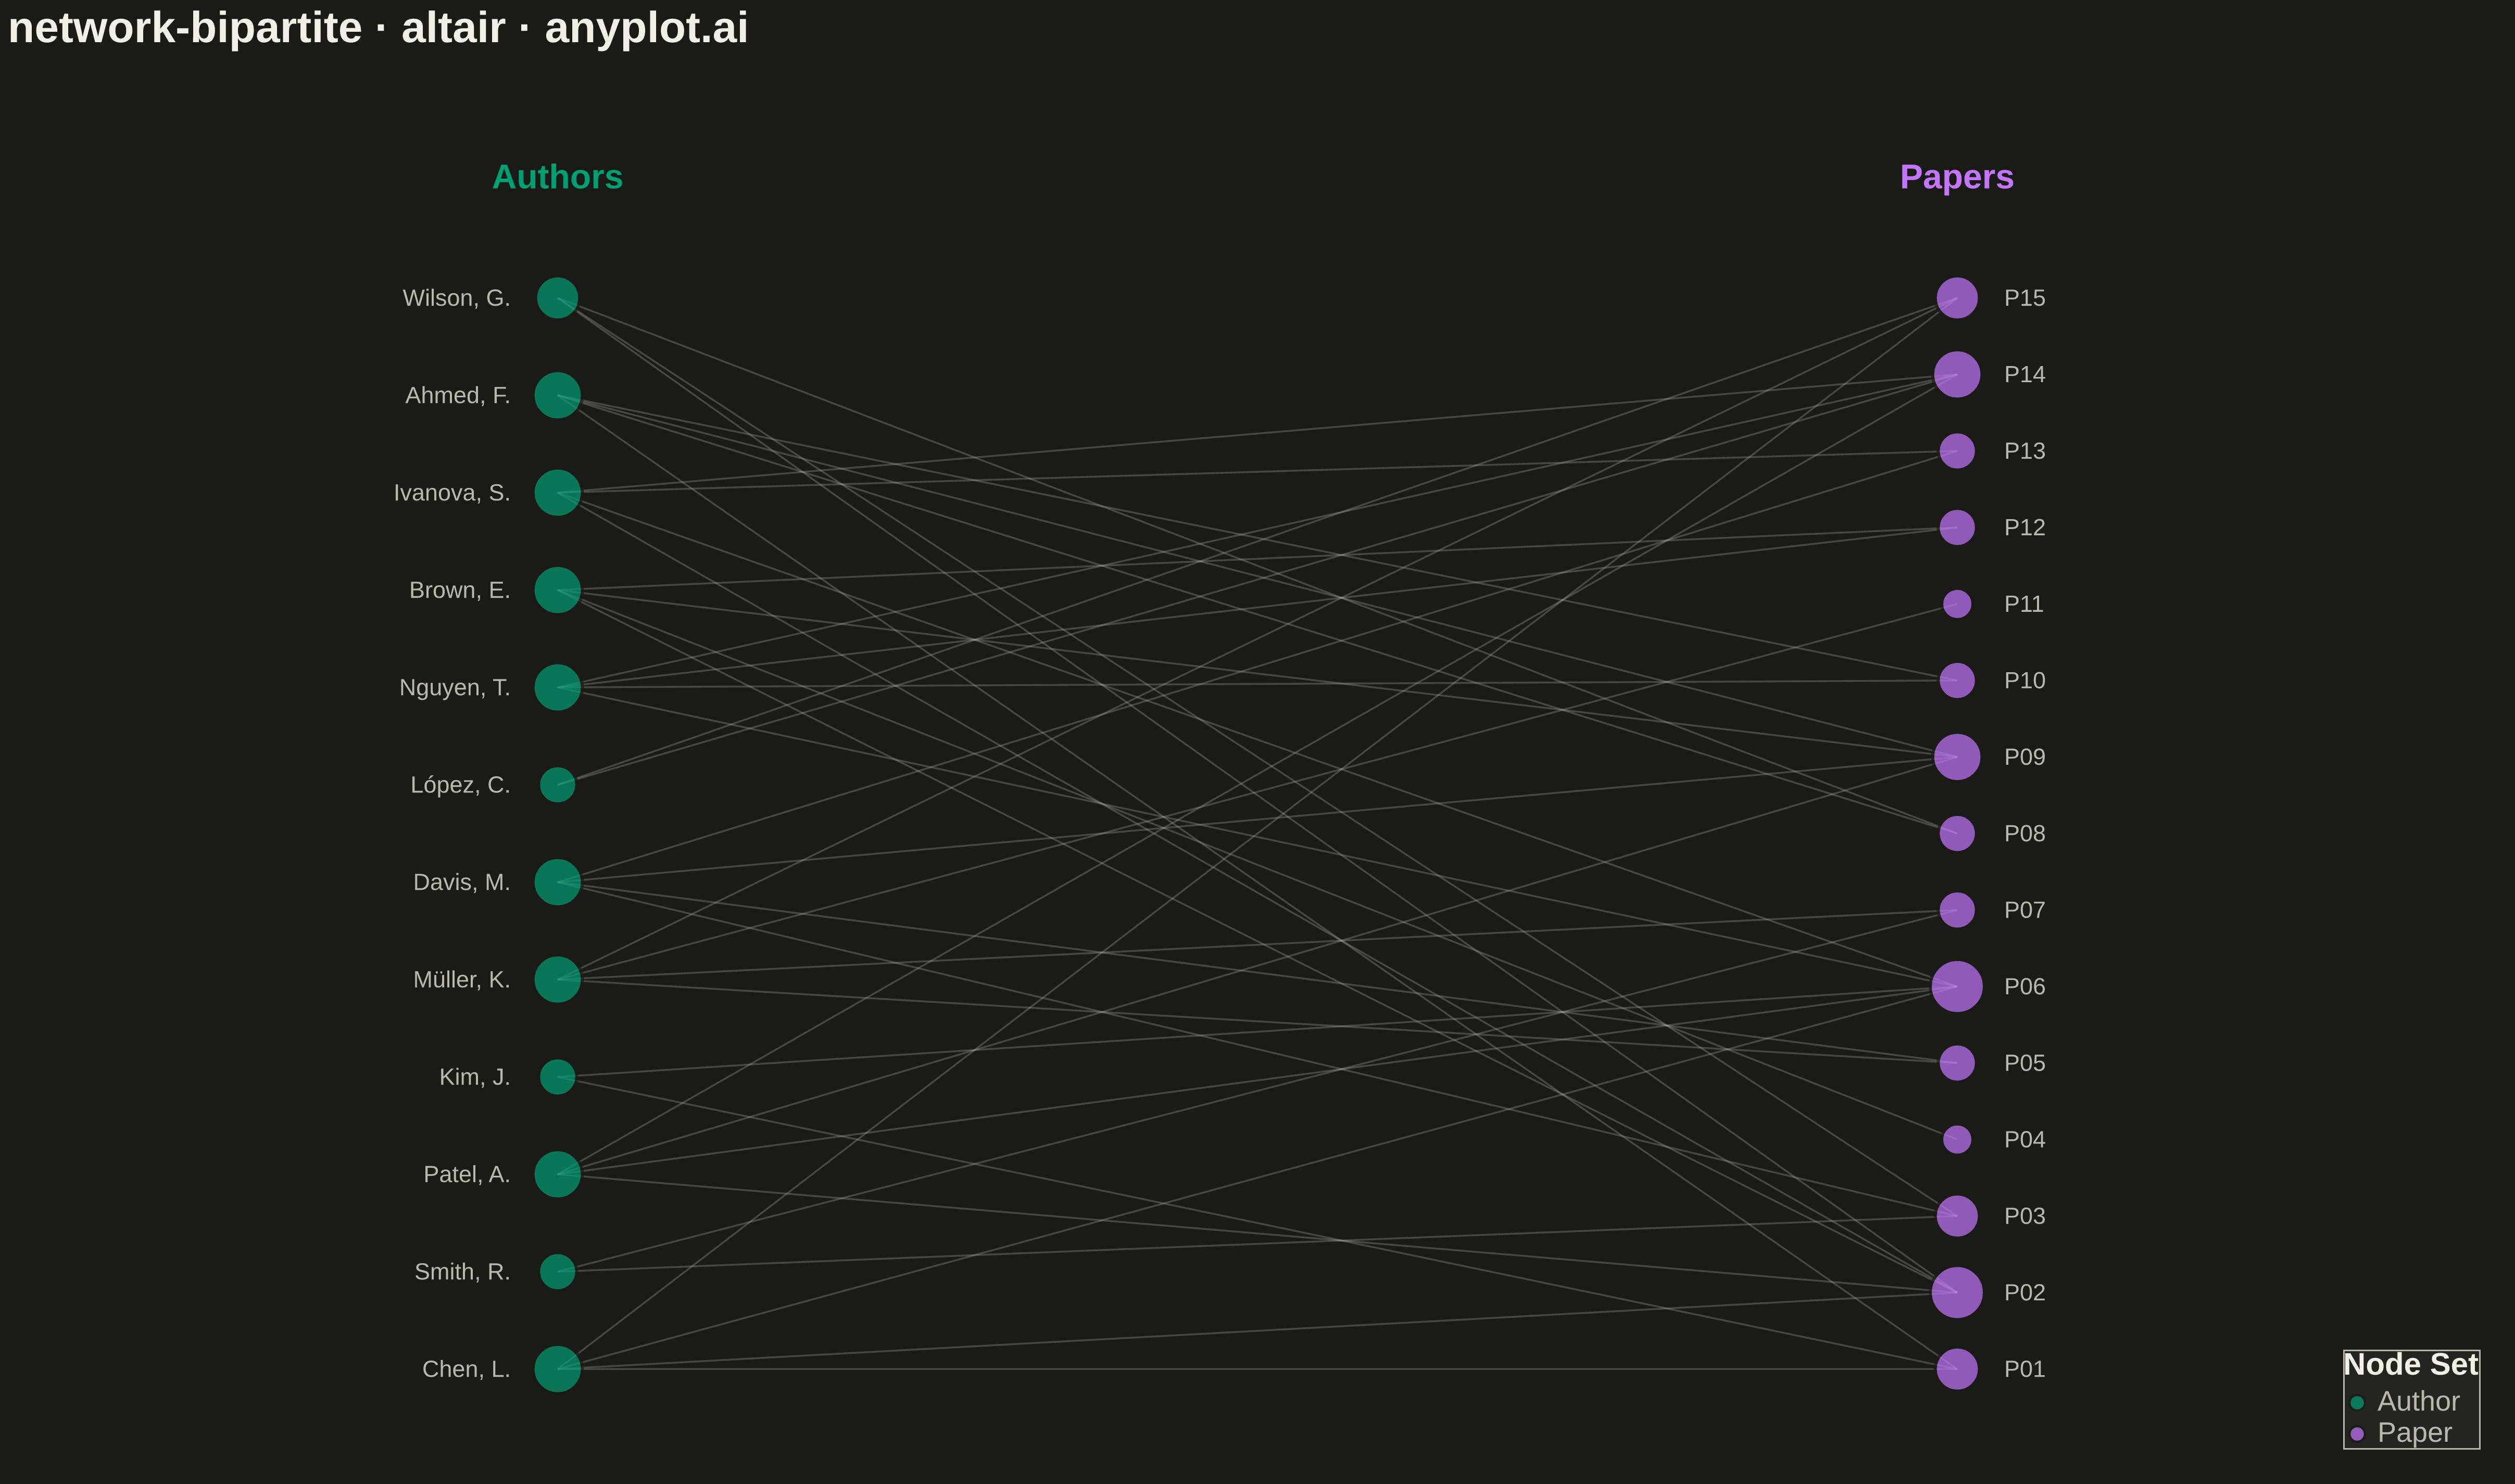
A bipartite network graph visualizes relationships between two distinct sets of entities, where edges only connect nodes from different sets — never within the same set. The two node groups are arranged in separate columns or rows, making the two-mode structure immediately apparent. This layout is fundamental for understanding cross-category relationships, revealing which entities from one set are linked to which entities in the other, and exposing patterns like hubs, clusters, and isolated nodes.
""" anyplot.ai
network-bipartite: Bipartite Network Graph
Library: altair 6.1.0 | Python 3.13.13
Quality: 89/100 | Created: 2026-05-14
"""

import os
import sys


# Remove script directory from sys.path to avoid importing local altair.py
script_dir = os.path.dirname(os.path.abspath(__file__))
if script_dir in sys.path:
    sys.path.remove(script_dir)

import altair as alt
import numpy as np
import pandas as pd


np.random.seed(42)

# Theme tokens
THEME = os.getenv("ANYPLOT_THEME", "light")
PAGE_BG = "#FAF8F1" if THEME == "light" else "#1A1A17"
ELEVATED_BG = "#FFFDF6" if THEME == "light" else "#242420"
INK = "#1A1A17" if THEME == "light" else "#F0EFE8"
INK_SOFT = "#4A4A44" if THEME == "light" else "#B8B7B0"

COLOR_A = "#009E73"  # Authors — Okabe-Ito position 1
COLOR_B = "#C475FD"  # Papers — Okabe-Ito position 2

# Data — researcher-paper affiliation network (bibliometrics)
author_names = [
    "Chen, L.",
    "Smith, R.",
    "Patel, A.",
    "Kim, J.",
    "Müller, K.",
    "Davis, M.",
    "López, C.",
    "Nguyen, T.",
    "Brown, E.",
    "Ivanova, S.",
    "Ahmed, F.",
    "Wilson, G.",
]
paper_ids = [f"P{i + 1:02d}" for i in range(15)]

# Edges: each author co-authors 2–4 papers
edge_list = []
for author in author_names:
    n = np.random.randint(2, 5)
    selected = np.random.choice(paper_ids, size=n, replace=False)
    for p in selected:
        edge_list.append({"source": author, "target": p})
edges_df = pd.DataFrame(edge_list).drop_duplicates(subset=["source", "target"])

# Node degrees
src_deg = edges_df.groupby("source").size().reset_index(name="degree")
tgt_deg = edges_df.groupby("target").size().reset_index(name="degree")

# Node positions — two columns, evenly spaced vertically
nodes_a = pd.DataFrame(
    {"node": author_names, "x": 0.22, "y": np.linspace(0.08, 0.88, len(author_names)), "set": "Author"}
).merge(src_deg.rename(columns={"source": "node"}), on="node", how="left")
nodes_a["degree"] = nodes_a["degree"].fillna(0).astype(int)

nodes_b = pd.DataFrame(
    {"node": paper_ids, "x": 0.78, "y": np.linspace(0.08, 0.88, len(paper_ids)), "set": "Paper"}
).merge(tgt_deg.rename(columns={"target": "node"}), on="node", how="left")
nodes_b["degree"] = nodes_b["degree"].fillna(0).astype(int)

nodes_df = pd.concat([nodes_a, nodes_b], ignore_index=True)

# Edge coordinates for mark_rule (x,y → x2,y2)
node_pos = nodes_df.set_index("node")[["x", "y"]].to_dict("index")
edge_records = []
for _, row in edges_df.iterrows():
    s, t = node_pos[row["source"]], node_pos[row["target"]]
    edge_records.append({"x": s["x"], "y": s["y"], "x2": t["x"], "y2": t["y"]})
edge_data = pd.DataFrame(edge_records)

# Shared scale objects
xscale = alt.Scale(domain=[0.0, 1.0])
yscale = alt.Scale(domain=[0.0, 1.05])

TITLE = "network-bipartite · altair · anyplot.ai"

# Edge lines
edges_chart = (
    alt.Chart(edge_data)
    .mark_rule(color=INK_SOFT, opacity=0.28, strokeWidth=1.2)
    .encode(x=alt.X("x:Q", scale=xscale, axis=None), y=alt.Y("y:Q", scale=yscale, axis=None), x2="x2:Q", y2="y2:Q")
)

# Nodes — size encodes degree, color encodes set membership
nodes_chart = (
    alt.Chart(nodes_df)
    .mark_circle(stroke=PAGE_BG, strokeWidth=2)
    .encode(
        x=alt.X("x:Q", scale=xscale, axis=None),
        y=alt.Y("y:Q", scale=yscale, axis=None),
        color=alt.Color(
            "set:N",
            scale=alt.Scale(domain=["Author", "Paper"], range=[COLOR_A, COLOR_B]),
            legend=alt.Legend(title="Node Set", titleFontSize=20, labelFontSize=18, orient="bottom-right"),
        ),
        size=alt.Size("degree:Q", scale=alt.Scale(range=[200, 1200]), legend=None),
        tooltip=["node:N", "set:N", "degree:N"],
    )
)

# Node labels — authors right-aligned, papers left-aligned
labels_a = (
    alt.Chart(nodes_a[["node", "x", "y"]])
    .mark_text(align="right", dx=-30, fontSize=15)
    .encode(
        x=alt.X("x:Q", scale=xscale, axis=None),
        y=alt.Y("y:Q", scale=yscale, axis=None),
        text="node:N",
        color=alt.value(INK_SOFT),
    )
)

labels_b = (
    alt.Chart(nodes_b[["node", "x", "y"]])
    .mark_text(align="left", dx=30, fontSize=15)
    .encode(
        x=alt.X("x:Q", scale=xscale, axis=None),
        y=alt.Y("y:Q", scale=yscale, axis=None),
        text="node:N",
        color=alt.value(INK_SOFT),
    )
)

# Column header labels
header_a = (
    alt.Chart(pd.DataFrame({"x": [0.22], "y": [0.97], "text": ["Authors"]}))
    .mark_text(fontSize=22, fontWeight="bold", color=COLOR_A)
    .encode(x=alt.X("x:Q", scale=xscale, axis=None), y=alt.Y("y:Q", scale=yscale, axis=None), text="text:N")
)

header_b = (
    alt.Chart(pd.DataFrame({"x": [0.78], "y": [0.97], "text": ["Papers"]}))
    .mark_text(fontSize=22, fontWeight="bold", color=COLOR_B)
    .encode(x=alt.X("x:Q", scale=xscale, axis=None), y=alt.Y("y:Q", scale=yscale, axis=None), text="text:N")
)

# Compose all layers
chart = (
    alt.layer(edges_chart, nodes_chart, labels_a, labels_b, header_a, header_b)
    .properties(width=1600, height=900, title=alt.Title(TITLE), background=PAGE_BG)
    .configure_view(fill=PAGE_BG, strokeOpacity=0)
    .configure_axis(
        domainColor=INK_SOFT,
        tickColor=INK_SOFT,
        gridColor=INK,
        gridOpacity=0.10,
        labelColor=INK_SOFT,
        titleColor=INK,
        labelFontSize=18,
        titleFontSize=22,
    )
    .configure_title(color=INK, fontSize=28, anchor="start", offset=12)
    .configure_legend(fillColor=ELEVATED_BG, strokeColor=INK_SOFT, labelColor=INK_SOFT, titleColor=INK)
)

# Save
chart.save(f"plot-{THEME}.png", scale_factor=3.0)
chart.save(f"plot-{THEME}.html")
Runnable source as JSON, for any HTTP client: https://api.anyplot.ai/specs/network-bipartite/altair/code. Any spec id and library id listed in llms-full.txt fit the same URL shape; every URL below is complete and callable.
{
  "spec_id": "network-bipartite",
  "language": "python",
  "library": "altair",
  "page": "https://anyplot.ai/network-bipartite/python/altair",
  "hub": "https://anyplot.ai/network-bipartite",
  "code_json": "https://api.anyplot.ai/specs/network-bipartite/altair/code",
  "spec_json": "https://api.anyplot.ai/specs/network-bipartite",
  "render_light_png": "https://storage.googleapis.com/anyplot-images/plots/network-bipartite/python/altair/plot-light.png",
  "render_dark_png": "https://storage.googleapis.com/anyplot-images/plots/network-bipartite/python/altair/plot-dark.png",
  "interactive_light_html": "https://storage.googleapis.com/anyplot-images/plots/network-bipartite/python/altair/plot-light.html",
  "interactive_dark_html": "https://storage.googleapis.com/anyplot-images/plots/network-bipartite/python/altair/plot-dark.html",
  "quality_score": 89.0,
  "license": "MIT",
  "guide": "https://anyplot.ai/llms.txt"
}
Part of Bipartite Network Graph on anyplot.ai.