The same plot in 14 other libraries — Python: Altair, Bokeh, lets-plot, Matplotlib, Plotly, plotnine, Pygal; R: ggplot2; Julia: Makie.jl; JavaScript: Chart.js, D3.js, Apache ECharts, Highcharts, MUI X Charts. Compare all 15 side by side: Bipartite Network Graph in Python, R, Julia and JavaScript.
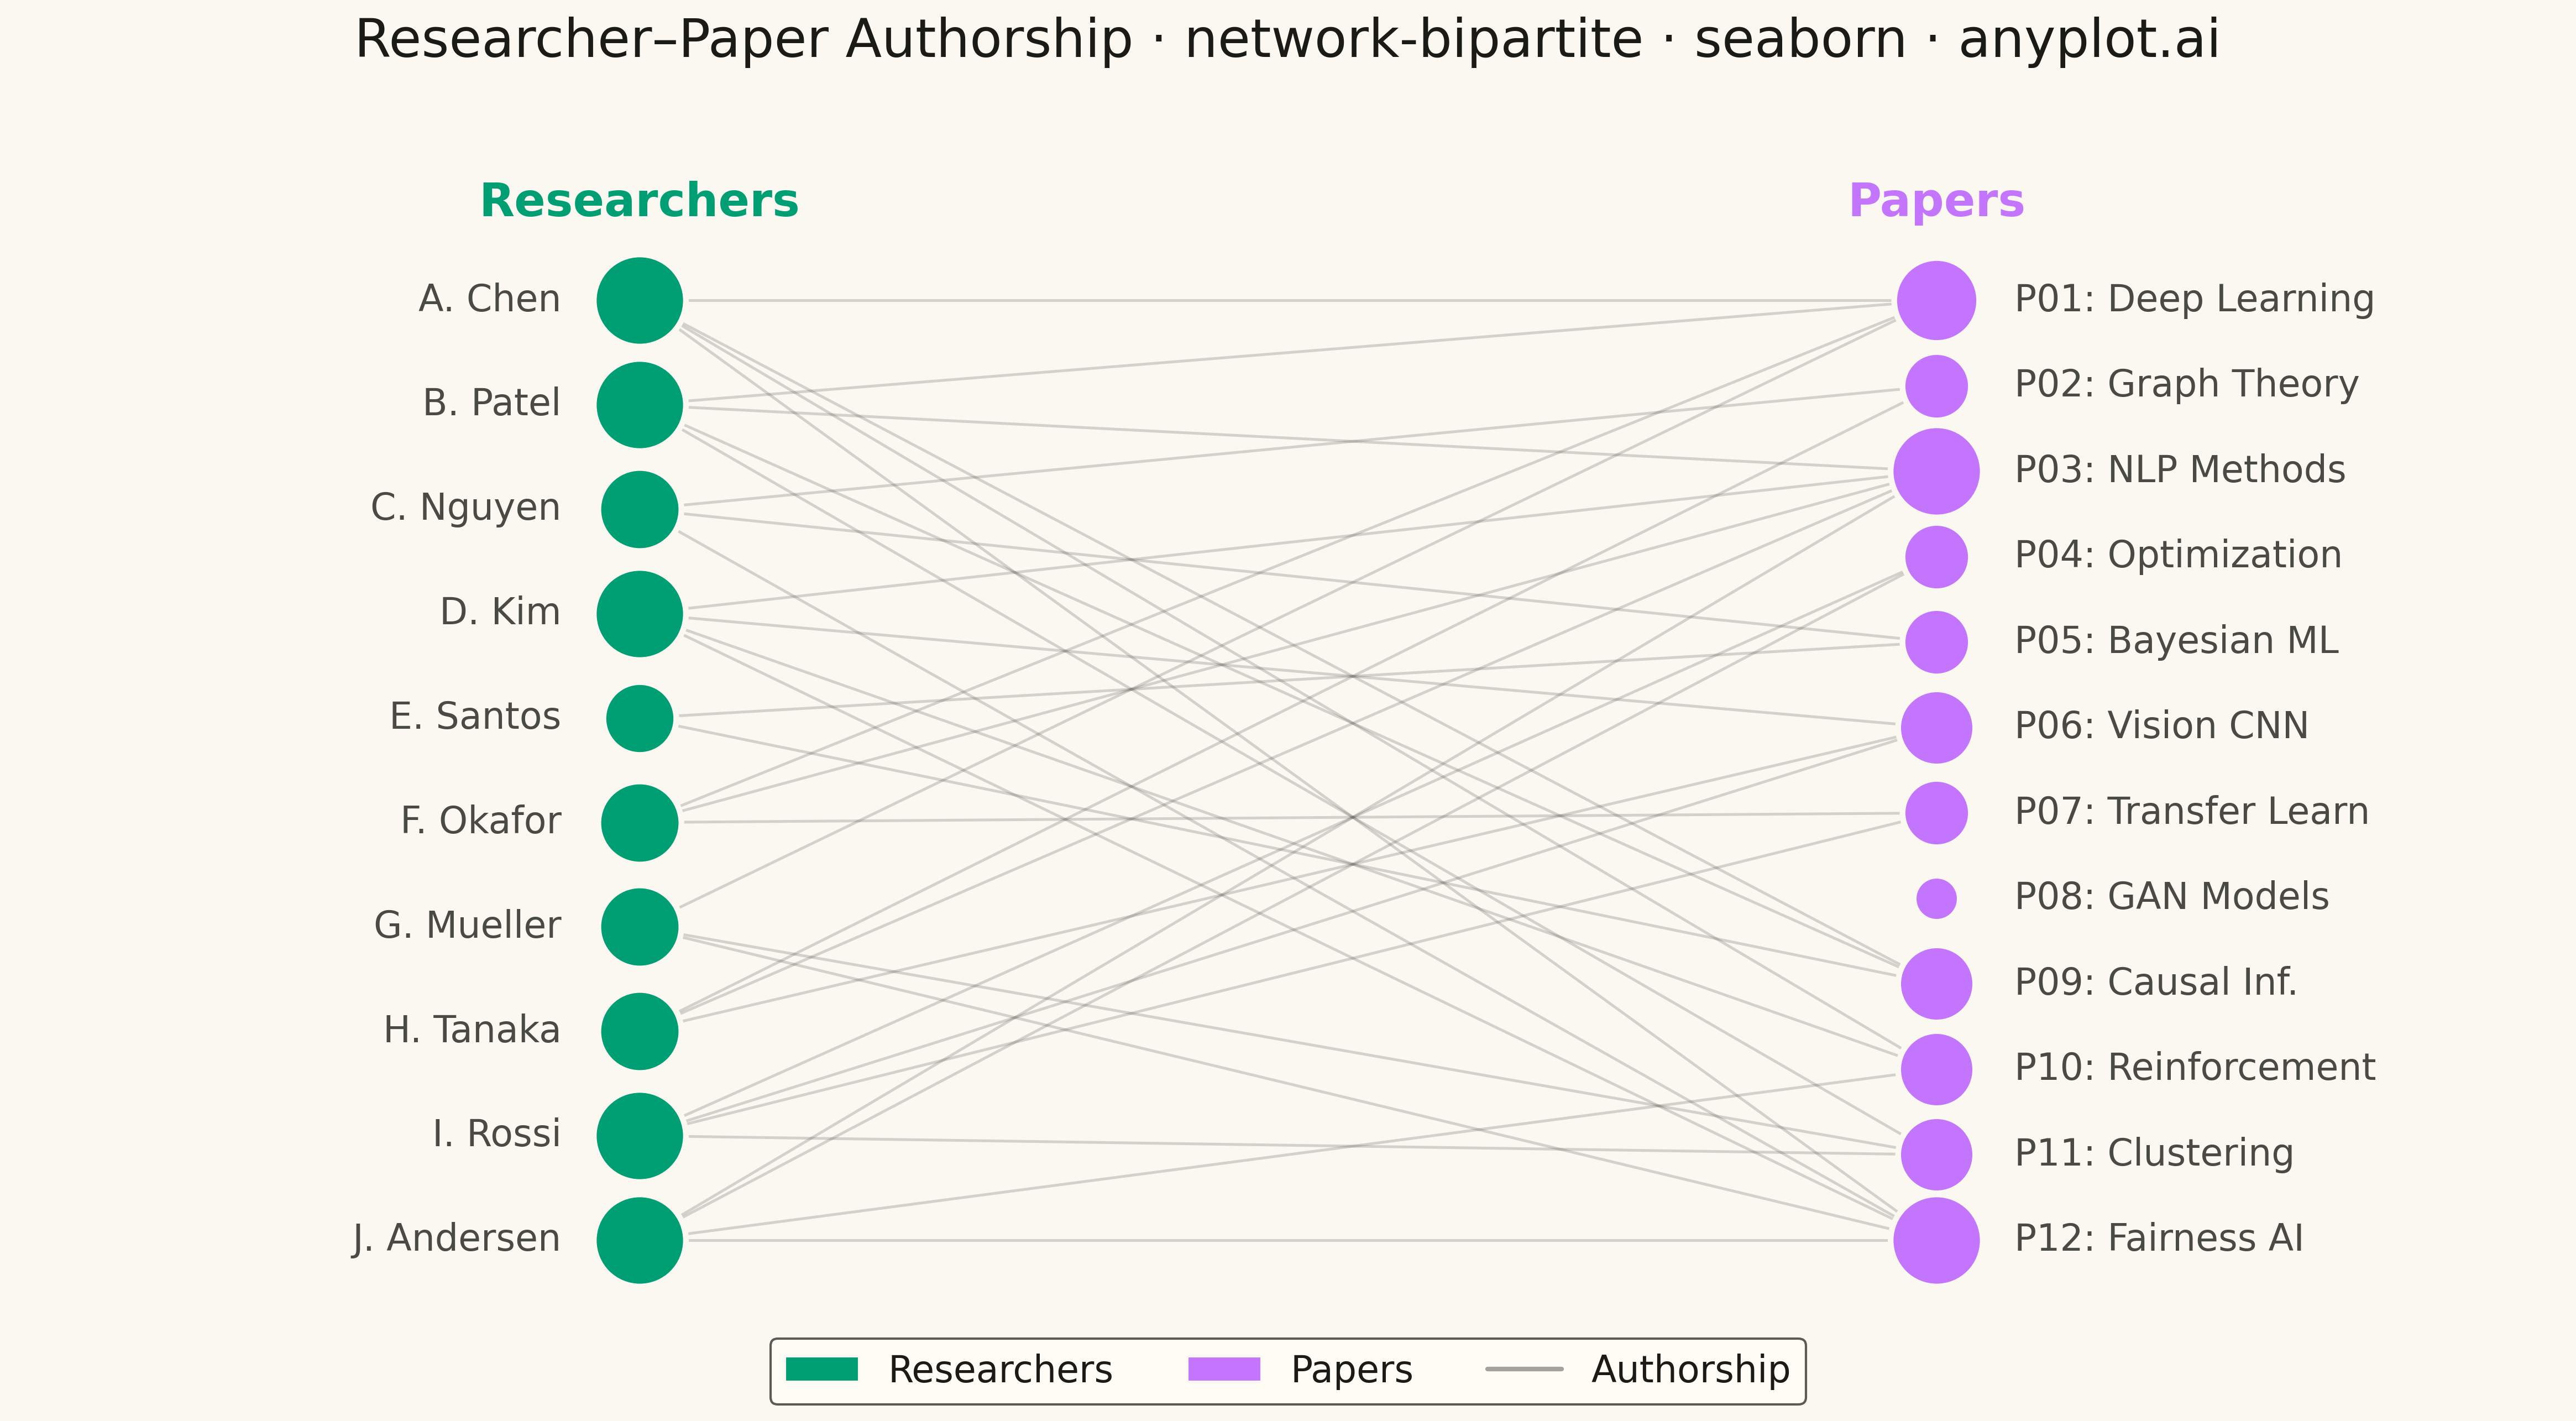
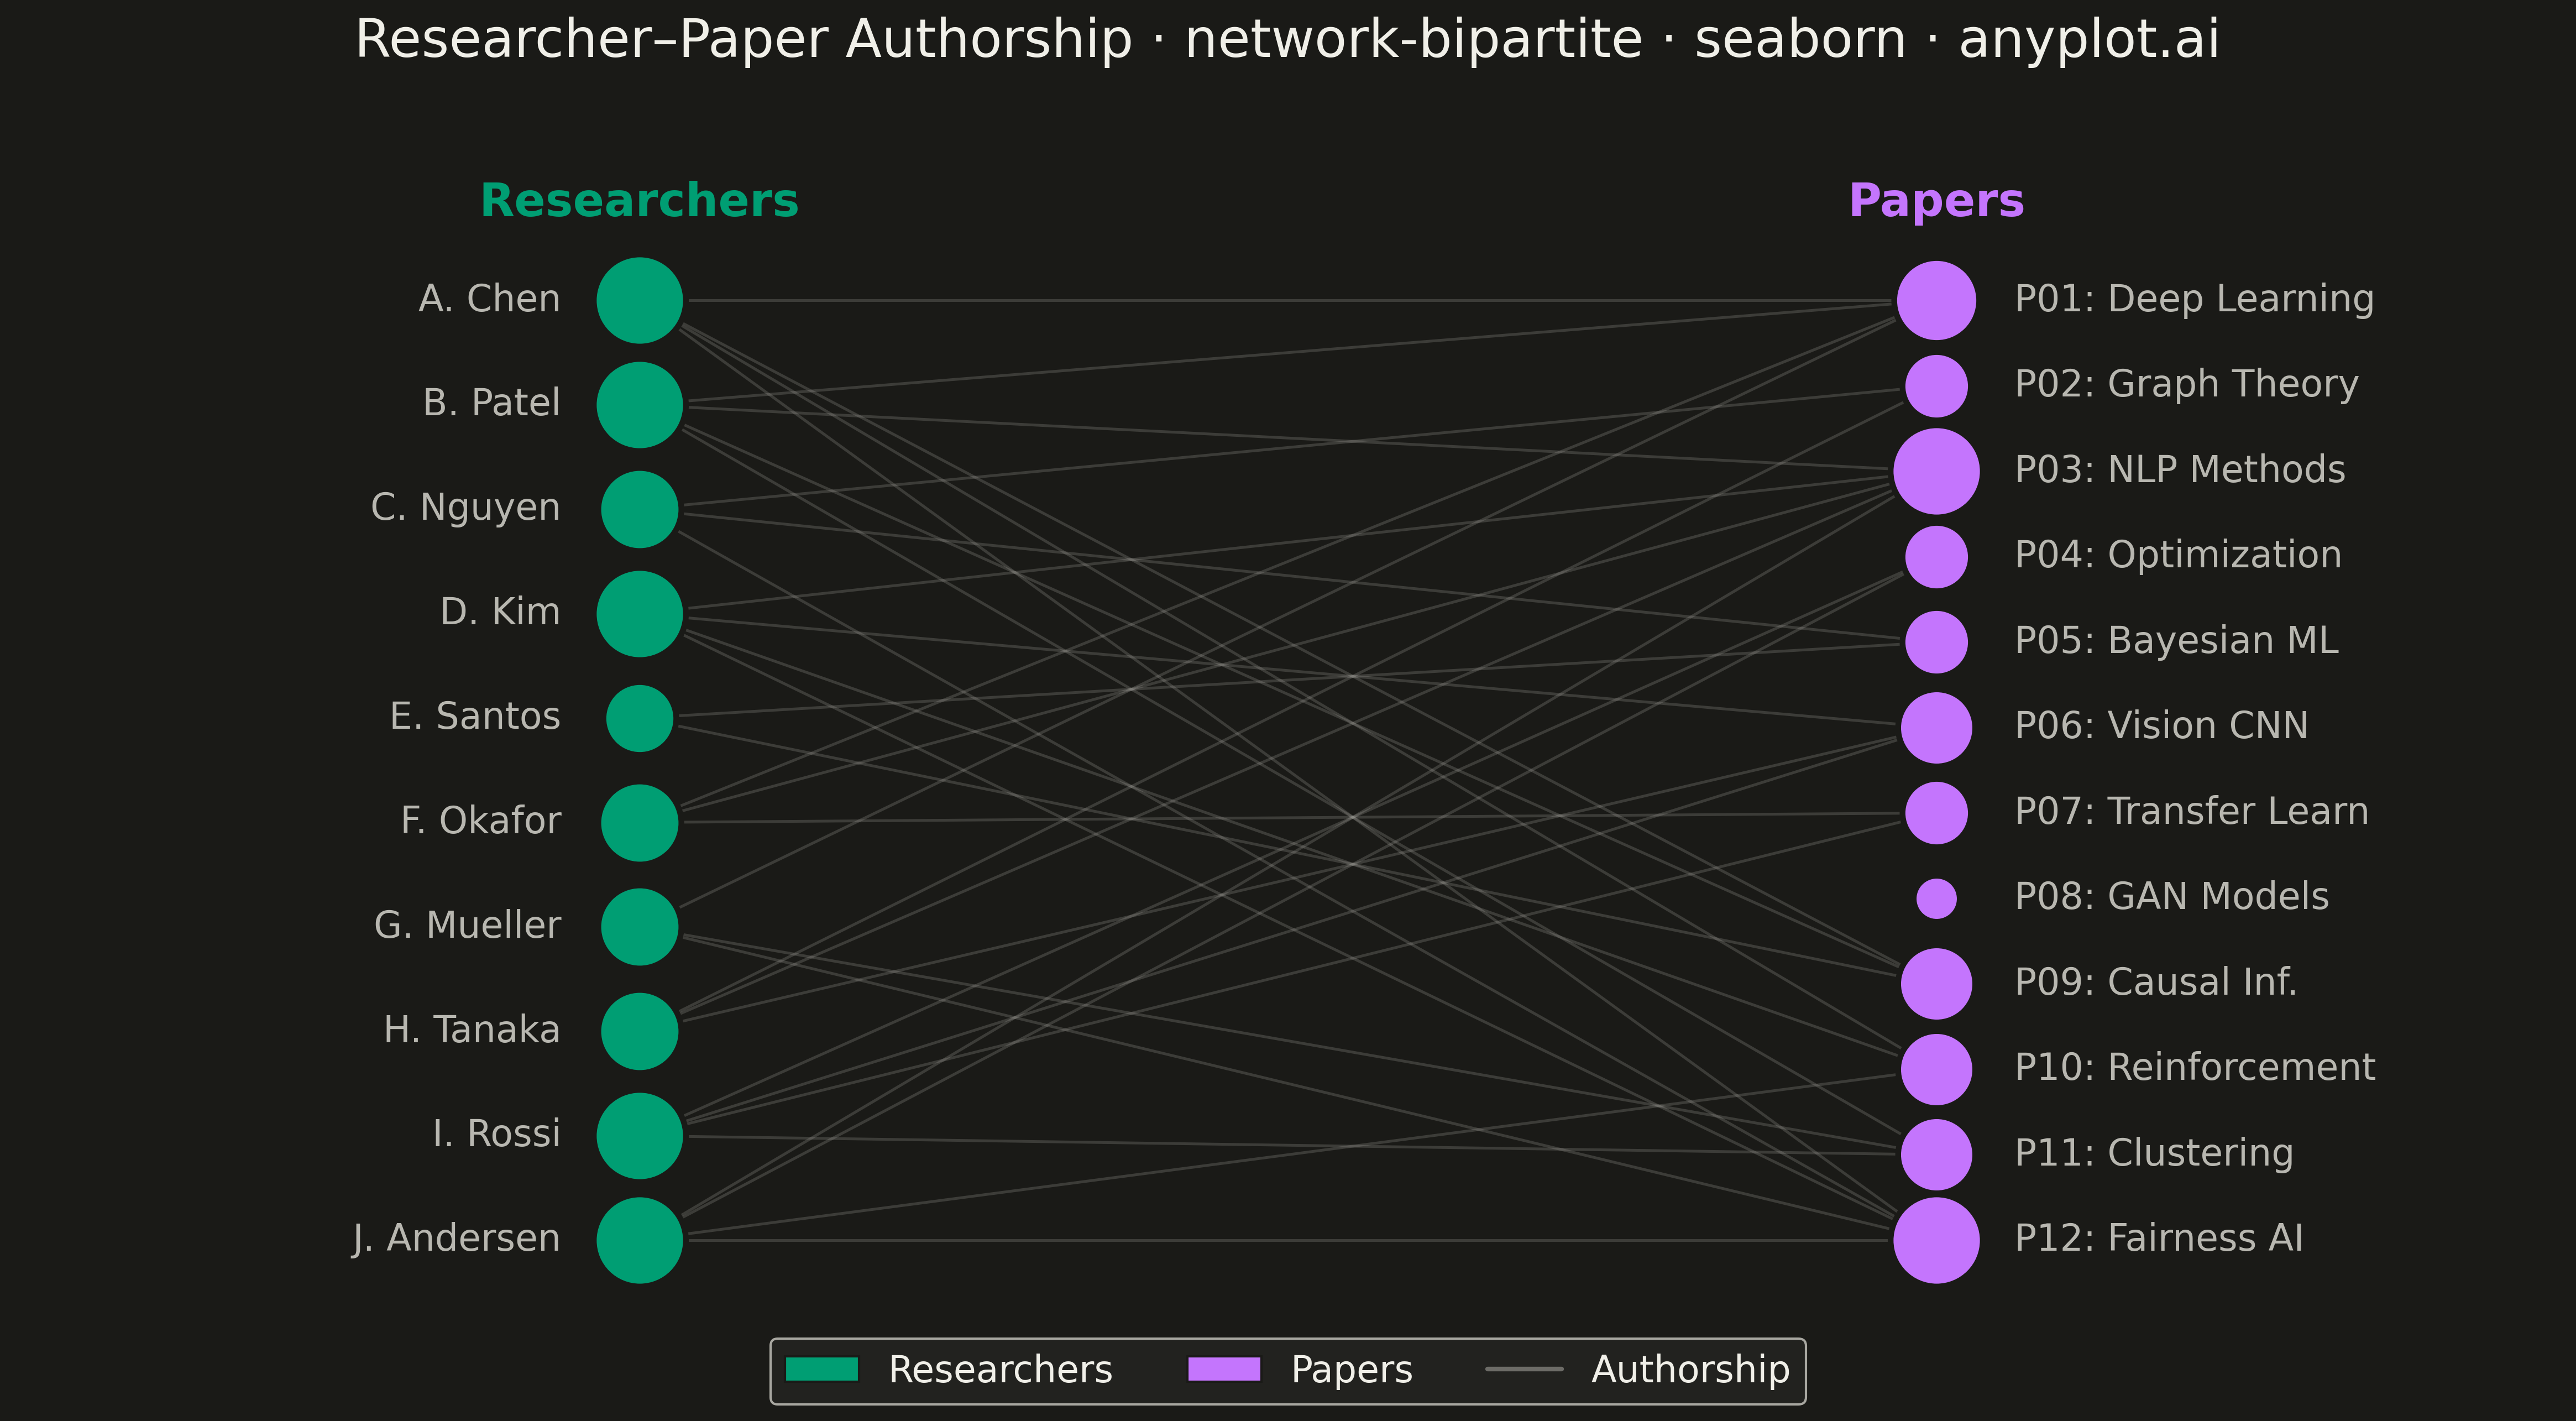
A bipartite network graph visualizes relationships between two distinct sets of entities, where edges only connect nodes from different sets — never within the same set. The two node groups are arranged in separate columns or rows, making the two-mode structure immediately apparent. This layout is fundamental for understanding cross-category relationships, revealing which entities from one set are linked to which entities in the other, and exposing patterns like hubs, clusters, and isolated nodes.
""" anyplot.ai
network-bipartite: Bipartite Network Graph
Library: seaborn 0.13.2 | Python 3.13.13
Quality: 85/100 | Created: 2026-05-14
"""

import os

import matplotlib.patches as mpatches
import matplotlib.pyplot as plt
import numpy as np
import seaborn as sns
from matplotlib.lines import Line2D


# Theme tokens
THEME = os.getenv("ANYPLOT_THEME", "light")
PAGE_BG = "#FAF8F1" if THEME == "light" else "#1A1A17"
ELEVATED_BG = "#FFFDF6" if THEME == "light" else "#242420"
INK = "#1A1A17" if THEME == "light" else "#F0EFE8"
INK_SOFT = "#4A4A44" if THEME == "light" else "#B8B7B0"

COLOR_A = "#009E73"  # Okabe-Ito position 1 — researchers
COLOR_B = "#C475FD"  # Okabe-Ito position 2 — papers

sns.set_theme(
    style="ticks",
    rc={
        "figure.facecolor": PAGE_BG,
        "axes.facecolor": PAGE_BG,
        "axes.edgecolor": INK_SOFT,
        "axes.labelcolor": INK,
        "text.color": INK,
        "xtick.color": INK_SOFT,
        "ytick.color": INK_SOFT,
        "grid.color": INK,
        "grid.alpha": 0.10,
        "legend.facecolor": ELEVATED_BG,
        "legend.edgecolor": INK_SOFT,
    },
)

# Data — researcher–paper authorship network
np.random.seed(42)

researchers = [
    "A. Chen",
    "B. Patel",
    "C. Nguyen",
    "D. Kim",
    "E. Santos",
    "F. Okafor",
    "G. Mueller",
    "H. Tanaka",
    "I. Rossi",
    "J. Andersen",
]

papers = [
    "P01: Deep Learning",
    "P02: Graph Theory",
    "P03: NLP Methods",
    "P04: Optimization",
    "P05: Bayesian ML",
    "P06: Vision CNN",
    "P07: Transfer Learn",
    "P08: GAN Models",
    "P09: Causal Inf.",
    "P10: Reinforcement",
    "P11: Clustering",
    "P12: Fairness AI",
]

# Generate authorship edges (each researcher authors 2–4 papers)
raw_edges = []
for researcher in researchers:
    n_papers = np.random.randint(2, 5)
    chosen = np.random.choice(range(len(papers)), size=n_papers, replace=False)
    for idx in chosen:
        raw_edges.append((researcher, papers[idx]))

edges = list(set(raw_edges))

# Compute degrees
researcher_degree = dict.fromkeys(researchers, 0)
paper_degree = dict.fromkeys(papers, 0)
for r, p in edges:
    researcher_degree[r] += 1
    paper_degree[p] += 1

# Node positions: left column = researchers, right column = papers
n_r = len(researchers)
n_p = len(papers)

researcher_pos = {r: (0.0, 1.0 - i / (n_r - 1)) for i, r in enumerate(researchers)}
paper_pos = {p: (1.0, 1.0 - i / (n_p - 1)) for i, p in enumerate(papers)}

# Plot
fig, ax = plt.subplots(figsize=(16, 9), facecolor=PAGE_BG)
ax.set_facecolor(PAGE_BG)

# Draw edges
for researcher, paper in edges:
    rx, ry = researcher_pos[researcher]
    px, py = paper_pos[paper]
    ax.plot([rx, px], [ry, py], color=INK_SOFT, alpha=0.22, linewidth=1.2, zorder=1)

# Draw nodes — size encodes degree
min_s, max_s = 400, 1600
max_deg_r = max(researcher_degree.values())
max_deg_p = max(paper_degree.values())

for researcher in researchers:
    x, y = researcher_pos[researcher]
    deg = researcher_degree[researcher]
    size = min_s + (max_s - min_s) * (deg / max_deg_r)
    ax.scatter(x, y, s=size, color=COLOR_A, edgecolors=PAGE_BG, linewidth=2.5, zorder=3)

for paper in papers:
    x, y = paper_pos[paper]
    deg = paper_degree[paper]
    size = min_s + (max_s - min_s) * (deg / max_deg_p)
    ax.scatter(x, y, s=size, color=COLOR_B, edgecolors=PAGE_BG, linewidth=2.5, zorder=3)

# Node labels
for researcher in researchers:
    x, y = researcher_pos[researcher]
    ax.text(x - 0.06, y, researcher, ha="right", va="center", fontsize=16, color=INK_SOFT)

for paper in papers:
    x, y = paper_pos[paper]
    ax.text(x + 0.06, y, paper, ha="left", va="center", fontsize=16, color=INK_SOFT)

# Column headers
ax.text(0.0, 1.08, "Researchers", ha="center", va="bottom", fontsize=20, fontweight="bold", color=COLOR_A)
ax.text(1.0, 1.08, "Papers", ha="center", va="bottom", fontsize=20, fontweight="bold", color=COLOR_B)

# Legend
legend_elements = [
    mpatches.Patch(facecolor=COLOR_A, edgecolor=PAGE_BG, label="Researchers"),
    mpatches.Patch(facecolor=COLOR_B, edgecolor=PAGE_BG, label="Papers"),
    Line2D([0], [0], color=INK_SOFT, alpha=0.5, linewidth=2, label="Authorship"),
]
legend = ax.legend(
    handles=legend_elements,
    loc="lower center",
    bbox_to_anchor=(0.5, -0.04),
    ncol=3,
    fontsize=16,
    framealpha=0.9,
    facecolor=ELEVATED_BG,
    edgecolor=INK_SOFT,
)
for text in legend.get_texts():
    text.set_color(INK)

ax.set_xlim(-0.48, 1.48)
ax.set_ylim(-0.14, 1.22)
ax.axis("off")

ax.set_title(
    "Researcher–Paper Authorship · network-bipartite · seaborn · anyplot.ai",
    fontsize=23,
    fontweight="medium",
    color=INK,
    pad=16,
)

plt.tight_layout(pad=2.0)
plt.savefig(f"plot-{THEME}.png", dpi=300, bbox_inches="tight", facecolor=PAGE_BG)
Runnable source as JSON, for any HTTP client: https://api.anyplot.ai/specs/network-bipartite/seaborn/code. Any spec id and library id listed in llms-full.txt fit the same URL shape; every URL below is complete and callable.
{
  "spec_id": "network-bipartite",
  "language": "python",
  "library": "seaborn",
  "page": "https://anyplot.ai/network-bipartite/python/seaborn",
  "hub": "https://anyplot.ai/network-bipartite",
  "code_json": "https://api.anyplot.ai/specs/network-bipartite/seaborn/code",
  "spec_json": "https://api.anyplot.ai/specs/network-bipartite",
  "render_light_png": "https://storage.googleapis.com/anyplot-images/plots/network-bipartite/python/seaborn/plot-light.png",
  "render_dark_png": "https://storage.googleapis.com/anyplot-images/plots/network-bipartite/python/seaborn/plot-dark.png",
  "quality_score": 85.0,
  "license": "MIT",
  "guide": "https://anyplot.ai/llms.txt"
}
Part of Bipartite Network Graph on anyplot.ai.