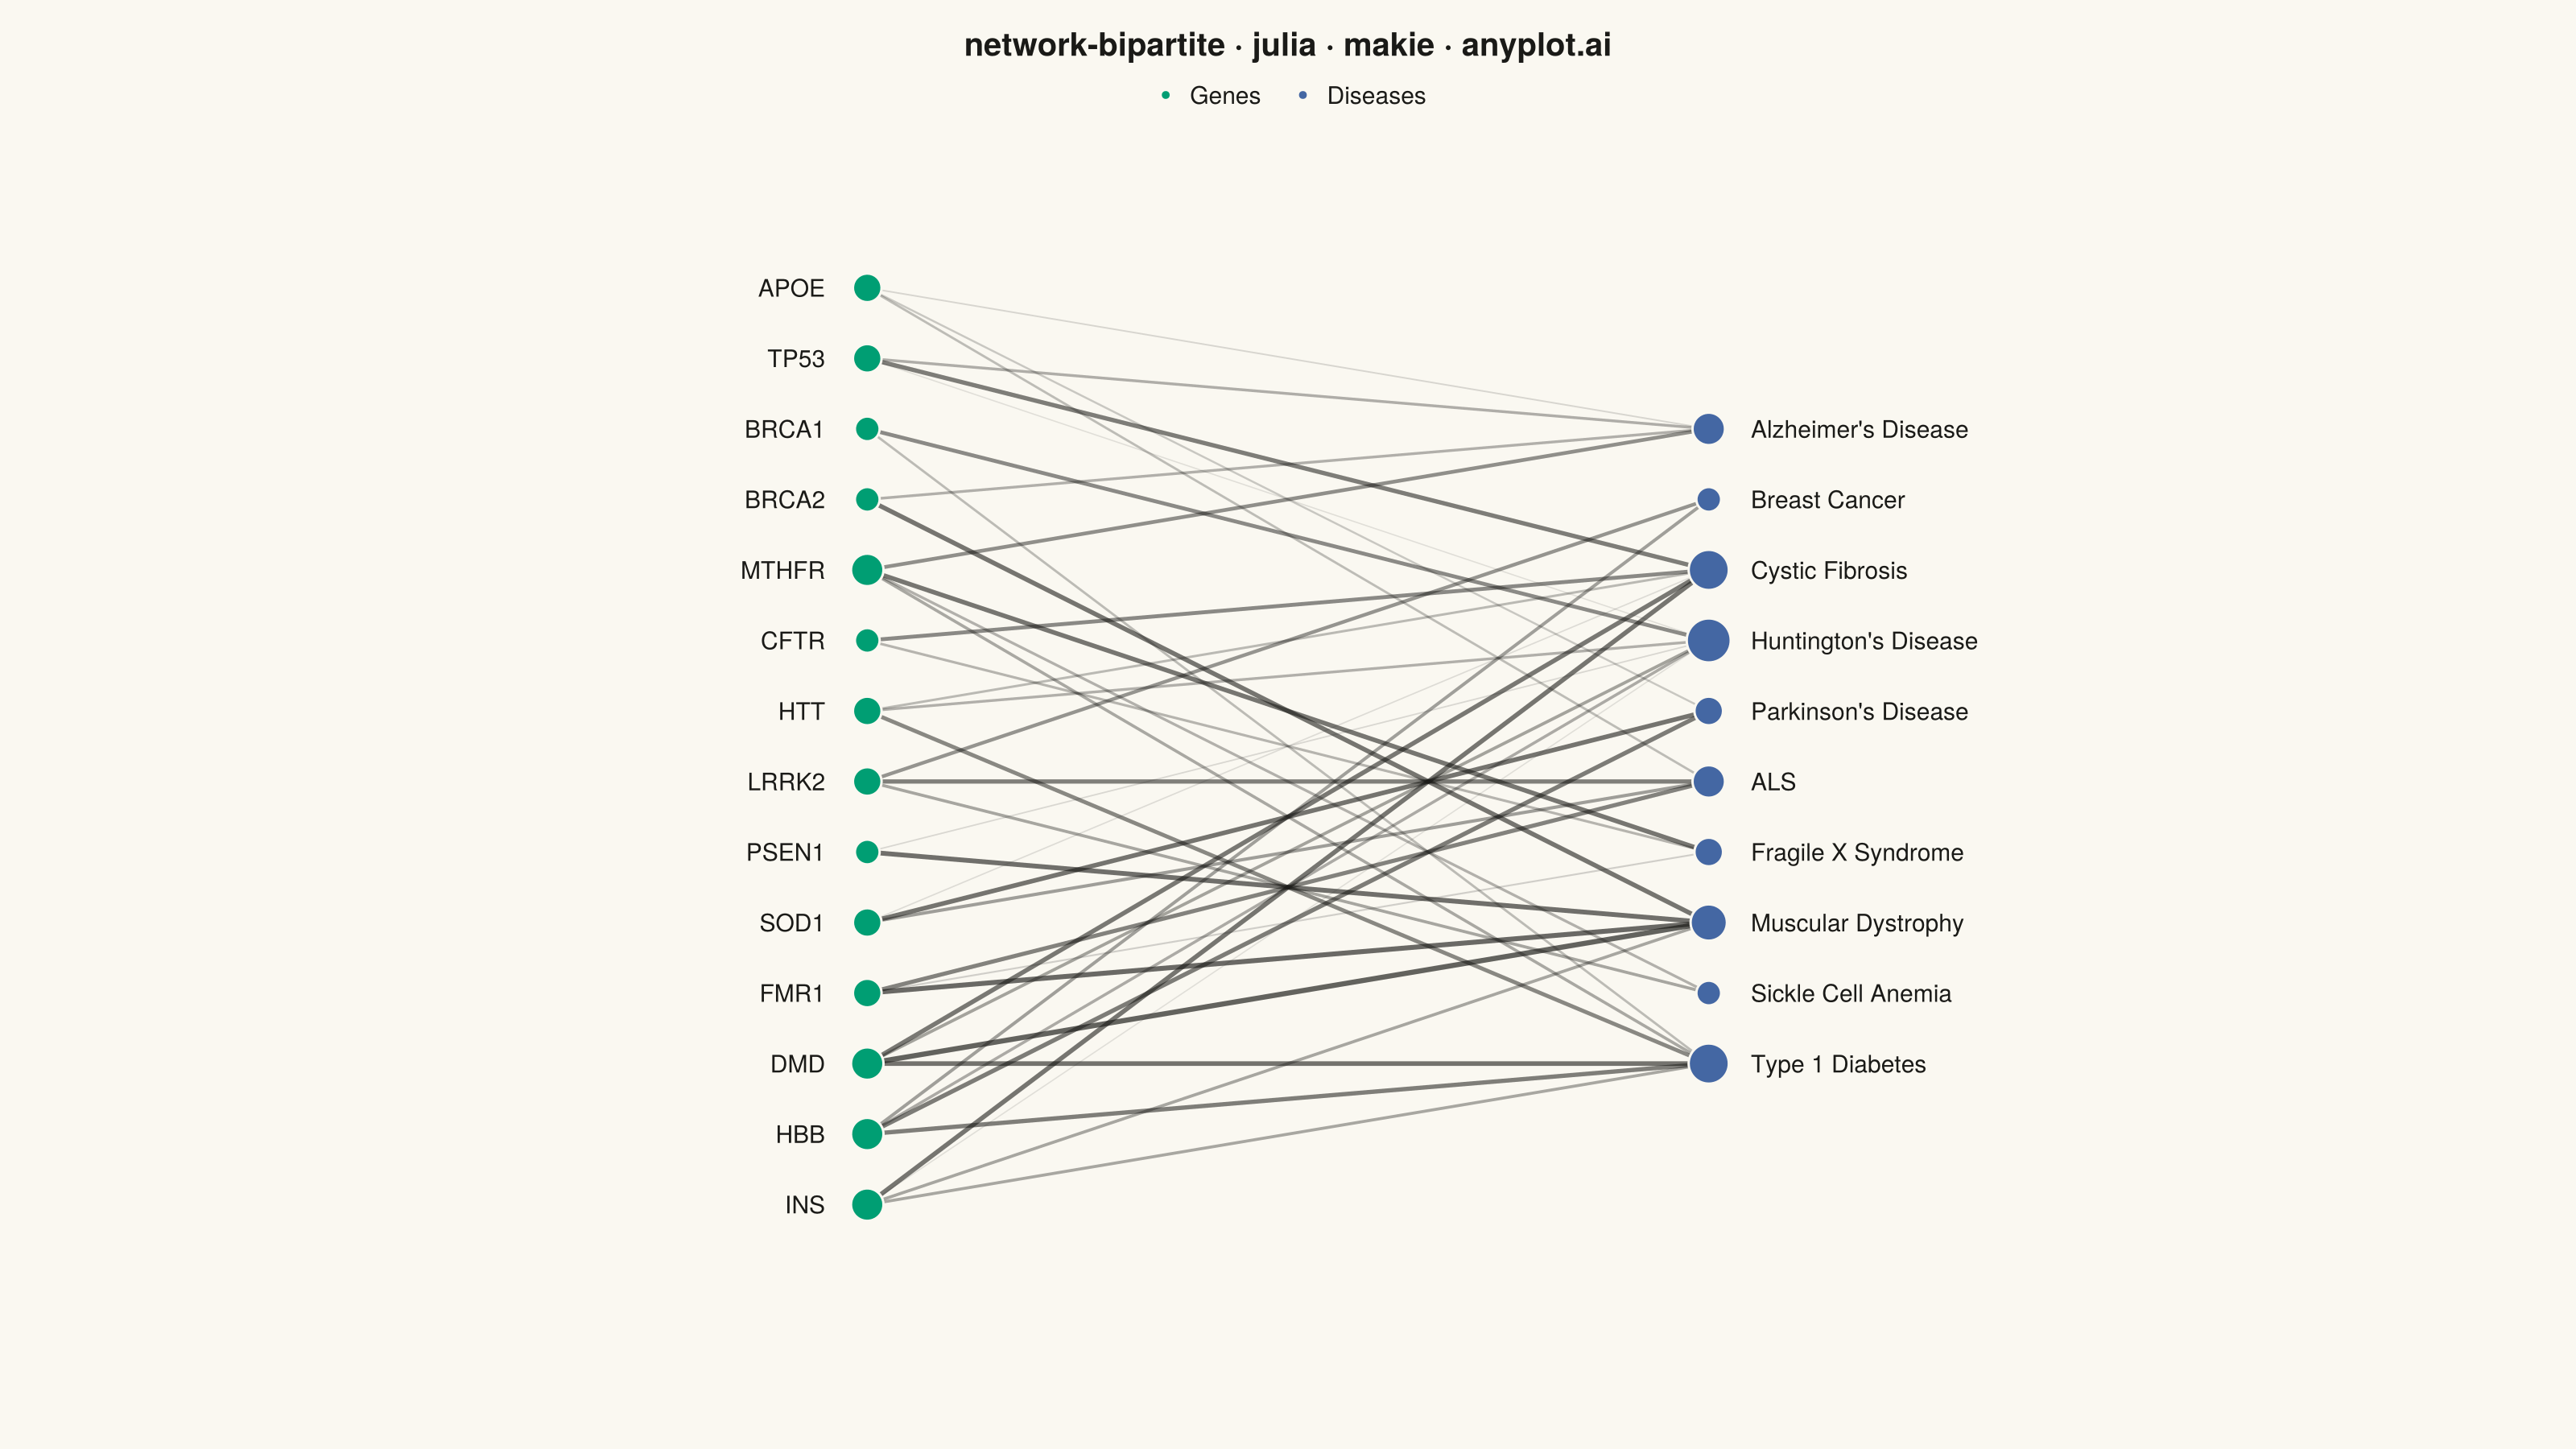
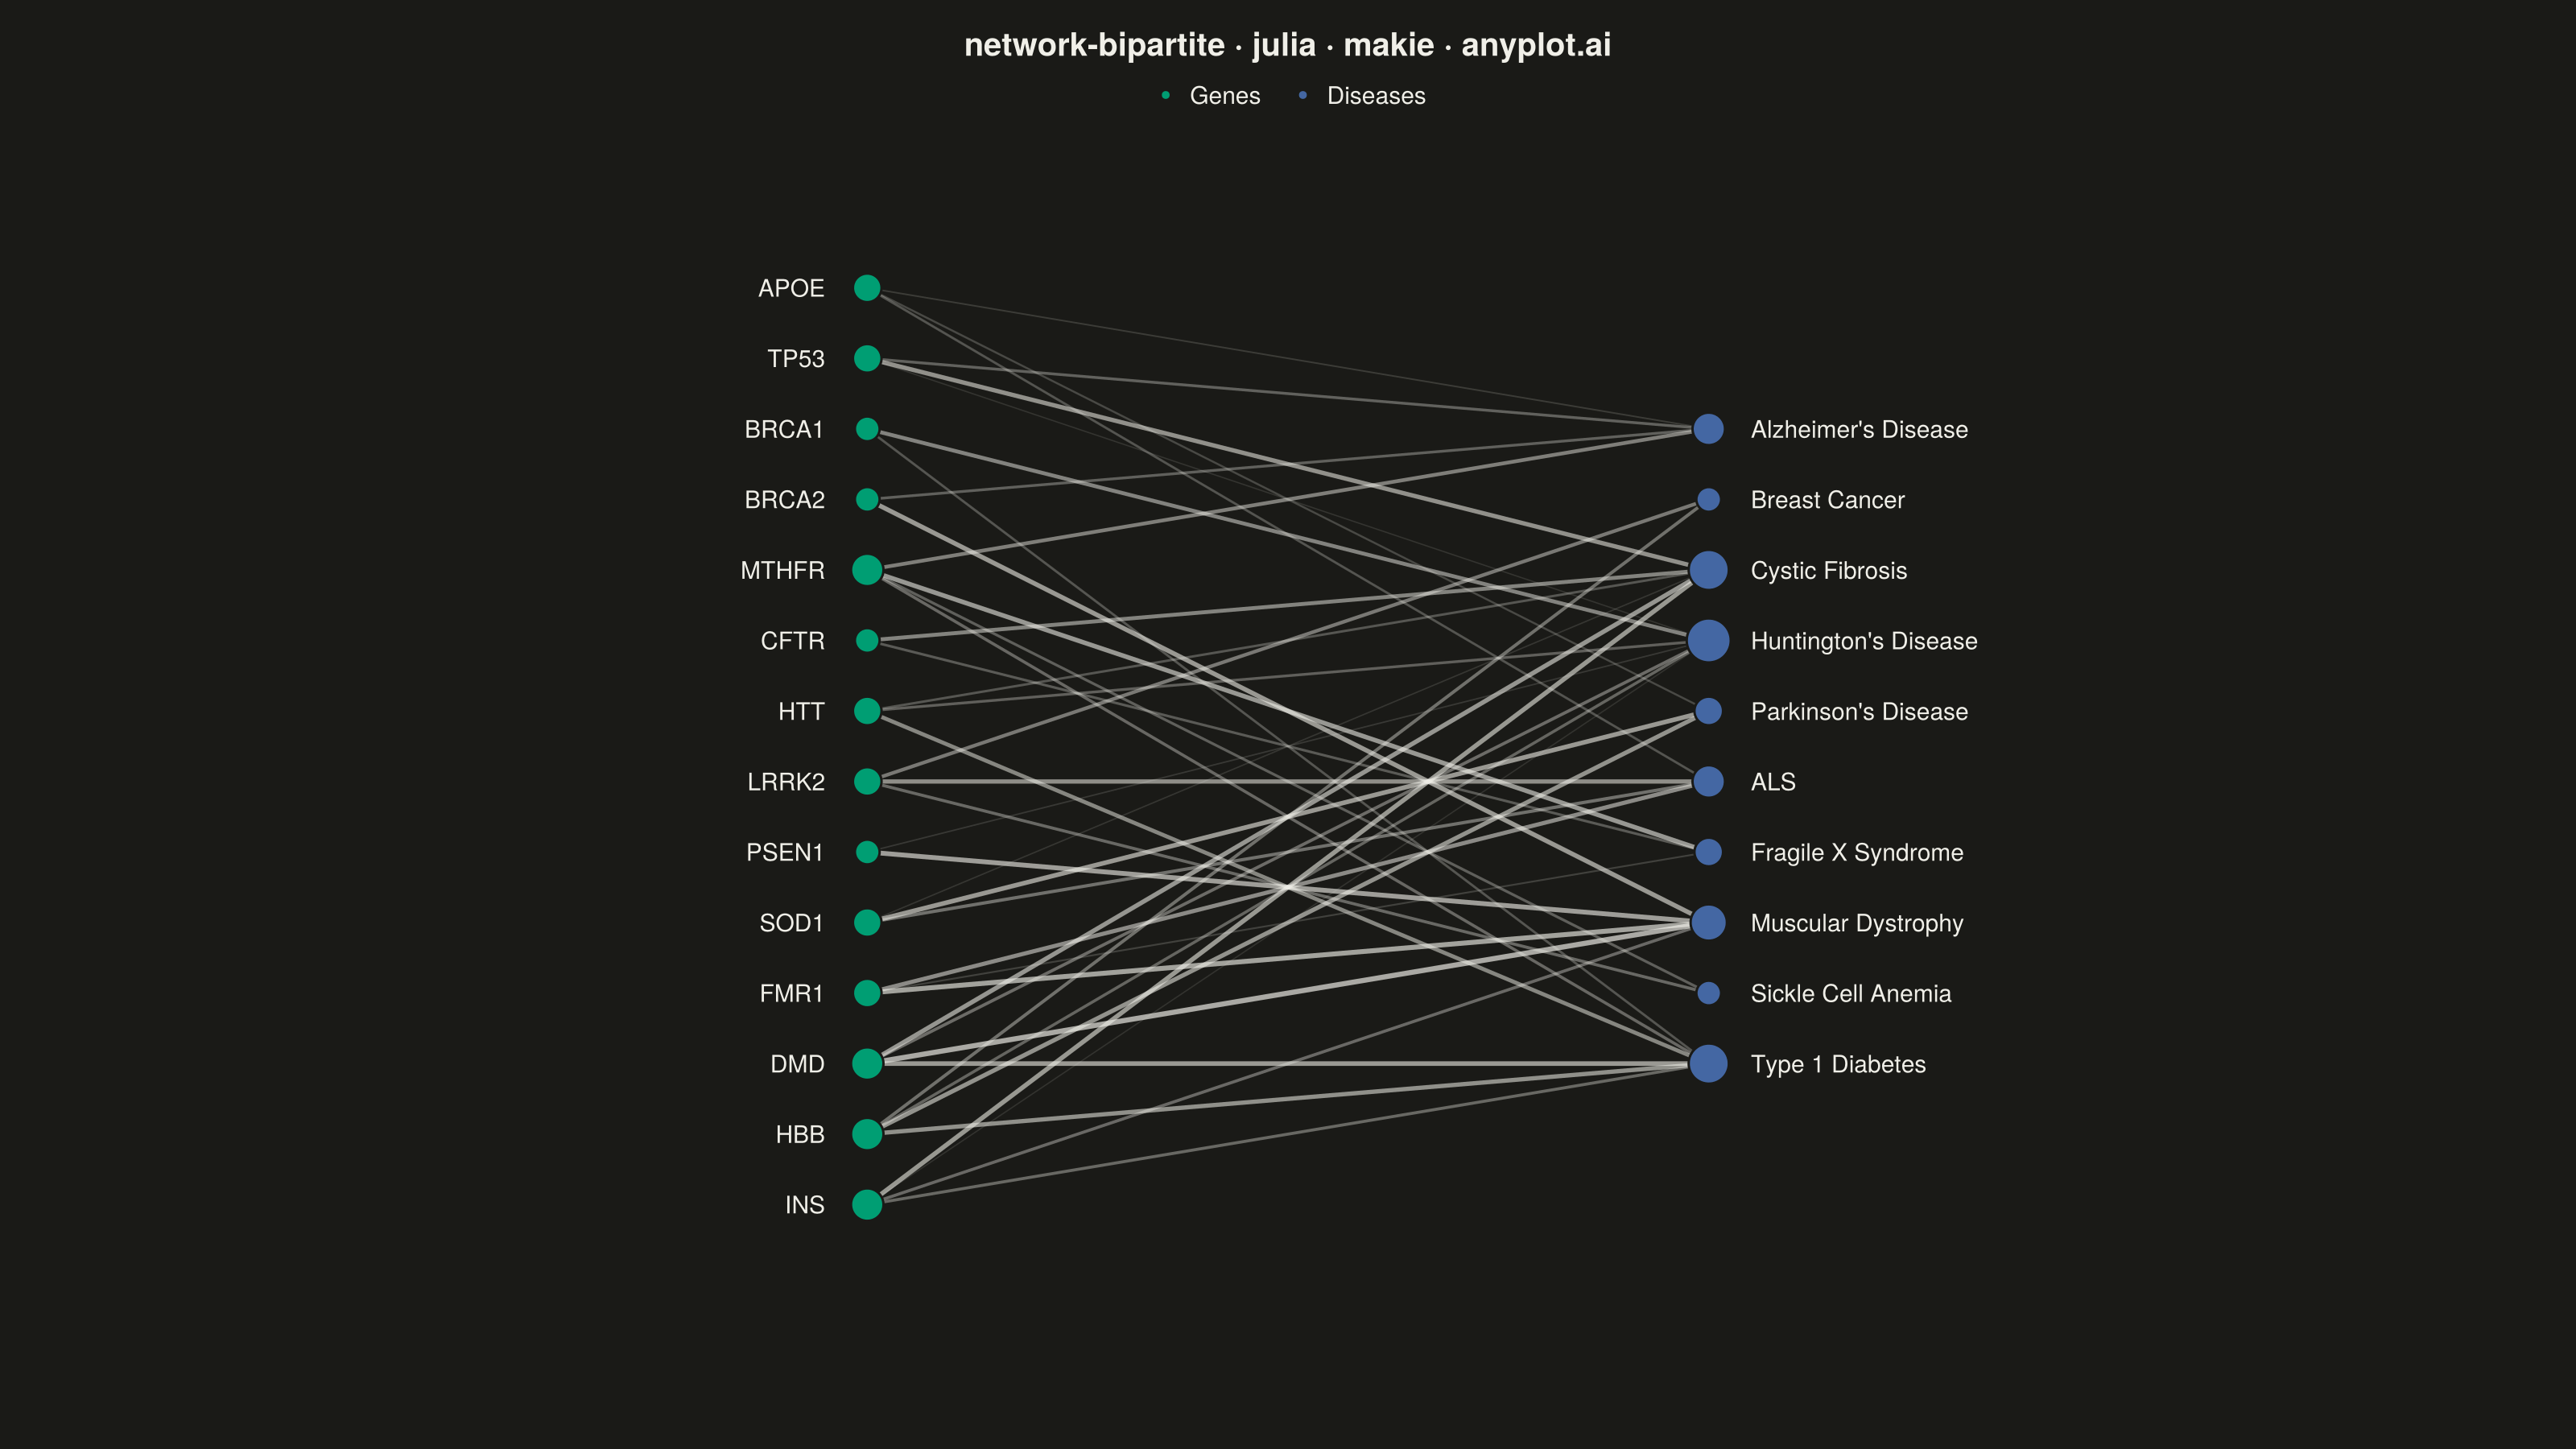
The same plot in 14 other libraries — Python: Altair, Bokeh, lets-plot, Matplotlib, Plotly, plotnine, Pygal, Seaborn; R: ggplot2; JavaScript: Chart.js, D3.js, Apache ECharts, Highcharts, MUI X Charts. Compare all 15 side by side: Bipartite Network Graph in Python, R, Julia and JavaScript.
A bipartite network graph visualizes relationships between two distinct sets of entities, where edges only connect nodes from different sets — never within the same set. The two node groups are arranged in separate columns or rows, making the two-mode structure immediately apparent. This layout is fundamental for understanding cross-category relationships, revealing which entities from one set are linked to which entities in the other, and exposing patterns like hubs, clusters, and isolated nodes.
# anyplot.ai
# network-bipartite: Bipartite Network Graph
# Library: makie 0.21.9 | Julia 1.11.9
# Quality: 91/100 | Created: 2026-09-05

using CairoMakie
using Colors
using Random

Random.seed!(42)

# --- Theme tokens ------------------------------------------------------------
const THEME    = get(ENV, "ANYPLOT_THEME", "light")
const PAGE_BG  = THEME == "light" ? colorant"#FAF8F1" : colorant"#1A1A17"
const INK      = THEME == "light" ? colorant"#1A1A17" : colorant"#F0EFE8"
const INK_SOFT = THEME == "light" ? colorant"#4A4A44" : colorant"#B8B7B0"
const IMPRINT_PALETTE = [
    colorant"#009E73", colorant"#C475FD", colorant"#4467A3", colorant"#BD8233",
    colorant"#AE3030", colorant"#2ABCCD", colorant"#954477", colorant"#99B314",
]
const GENE_COLOR    = IMPRINT_PALETTE[1]  # brand green — set A (always first series)
const DISEASE_COLOR = IMPRINT_PALETTE[3]  # blue — set B

# --- Data ---------------------------------------------------------------------
genes = ["APOE", "TP53", "BRCA1", "BRCA2", "MTHFR", "CFTR", "HTT", "LRRK2",
         "PSEN1", "SOD1", "FMR1", "DMD", "HBB", "INS"]
diseases = ["Alzheimer's Disease", "Breast Cancer", "Cystic Fibrosis",
            "Huntington's Disease", "Parkinson's Disease", "ALS",
            "Fragile X Syndrome", "Muscular Dystrophy", "Sickle Cell Anemia",
            "Type 1 Diabetes"]

n_genes    = length(genes)
n_diseases = length(diseases)

edges = Tuple{Int,Int,Float64}[]
for gi in 1:n_genes
    n_links = rand(2:4)
    targets = randperm(n_diseases)[1:n_links]
    for di in targets
        association_strength = 0.3 + 0.7 * rand()
        push!(edges, (gi, di, association_strength))
    end
end

gene_degree    = zeros(Int, n_genes)
disease_degree = zeros(Int, n_diseases)
for (gi, di, _) in edges
    gene_degree[gi]    += 1
    disease_degree[di] += 1
end

gene_x    = fill(0.0, n_genes)
disease_x = fill(1.0, n_diseases)
gene_y    = [(n_genes - 1) / 2 - (i - 1) for i in 1:n_genes]
disease_y = [(n_diseases - 1) / 2 - (i - 1) for i in 1:n_diseases]

weights = [w for (_, _, w) in edges]
min_w, max_w = minimum(weights), maximum(weights)

# --- Plot -----------------------------------------------------------------
fig = Figure(
    resolution      = (1600, 900),
    backgroundcolor = PAGE_BG,
)

title_str = "network-bipartite · julia · makie · anyplot.ai"
max_y = (max(n_genes, n_diseases) - 1) / 2 + 1.6

ax = Axis(
    fig[1, 1];
    title               = title_str,
    titlesize           = 20,
    titlecolor          = INK,
    backgroundcolor     = PAGE_BG,
    xgridvisible        = false,
    ygridvisible        = false,
    xticksvisible       = false,
    yticksvisible       = false,
    xticklabelsvisible  = false,
    yticklabelsvisible  = false,
    topspinevisible     = false,
    rightspinevisible   = false,
    leftspinevisible    = false,
    bottomspinevisible  = false,
    xautolimitmargin    = (0.0, 0.0),
    yautolimitmargin    = (0.0, 0.0),
)
xlims!(ax, -0.95, 1.85)
ylims!(ax, -max_y, max_y)

# Edges: one vectorized linesegments! call instead of a per-edge lines! loop —
# per-segment color/linewidth vectors drive the association-strength encoding.
edge_points  = Point2f[]
edge_colors  = RGBAf[]
edge_widths  = Float64[]
for (gi, di, w) in edges
    norm_w     = (w - min_w) / (max_w - min_w)
    edge_alpha = 0.12 + 0.55 * norm_w
    edge_width = 0.8 + 2.6 * norm_w
    edge_color = RGBAf(INK.r, INK.g, INK.b, edge_alpha)
    push!(edge_points, Point2f(gene_x[gi], gene_y[gi]), Point2f(disease_x[di], disease_y[di]))
    push!(edge_colors, edge_color, edge_color)
    push!(edge_widths, edge_width, edge_width)
end
linesegments!(ax, edge_points; color = edge_colors, linewidth = edge_widths)

# Node size encodes degree (number of connections) — highlights hub genes/diseases.
gene_sizes    = 17 .+ 3.8 .* gene_degree
disease_sizes = 17 .+ 3.8 .* disease_degree

scatter!(ax, gene_x, gene_y;
         color = GENE_COLOR, markersize = gene_sizes,
         strokewidth = 1.5, strokecolor = PAGE_BG, label = "Genes")
scatter!(ax, disease_x, disease_y;
         color = DISEASE_COLOR, markersize = disease_sizes,
         strokewidth = 1.5, strokecolor = PAGE_BG, label = "Diseases")

for i in 1:n_genes
    text!(ax, gene_x[i] - 0.05, gene_y[i];
          text = genes[i], align = (:right, :center), color = INK, fontsize = 17)
end
for i in 1:n_diseases
    text!(ax, disease_x[i] + 0.05, disease_y[i];
          text = diseases[i], align = (:left, :center), color = INK, fontsize = 17)
end

axislegend(ax; position = :ct, orientation = :horizontal,
           framevisible = false, labelcolor = INK, labelsize = 16,
           padding = (0, 0, 0, 0))

# --- Save -----------------------------------------------------------------
save("plot-$(THEME).png", fig; px_per_unit = 2)
Runnable source as JSON, for any HTTP client: https://api.anyplot.ai/specs/network-bipartite/makie/code. Any spec id and library id listed in llms-full.txt fit the same URL shape; every URL below is complete and callable.
{
  "spec_id": "network-bipartite",
  "language": "julia",
  "library": "makie",
  "page": "https://anyplot.ai/network-bipartite/julia/makie",
  "hub": "https://anyplot.ai/network-bipartite",
  "code_json": "https://api.anyplot.ai/specs/network-bipartite/makie/code",
  "spec_json": "https://api.anyplot.ai/specs/network-bipartite",
  "render_light_png": "https://storage.googleapis.com/anyplot-images/plots/network-bipartite/julia/makie/plot-light.png",
  "render_dark_png": "https://storage.googleapis.com/anyplot-images/plots/network-bipartite/julia/makie/plot-dark.png",
  "quality_score": 91.0,
  "license": "MIT",
  "guide": "https://anyplot.ai/llms.txt"
}
Part of Bipartite Network Graph on anyplot.ai.