The same plot in 14 other libraries — Python: Altair, Bokeh, lets-plot, Matplotlib, Plotly, plotnine, Pygal, Seaborn; Julia: Makie.jl; JavaScript: Chart.js, D3.js, Apache ECharts, Highcharts, MUI X Charts. Compare all 15 side by side: Hierarchical Network Graph with Tree Layout in Python, R, Julia and JavaScript.
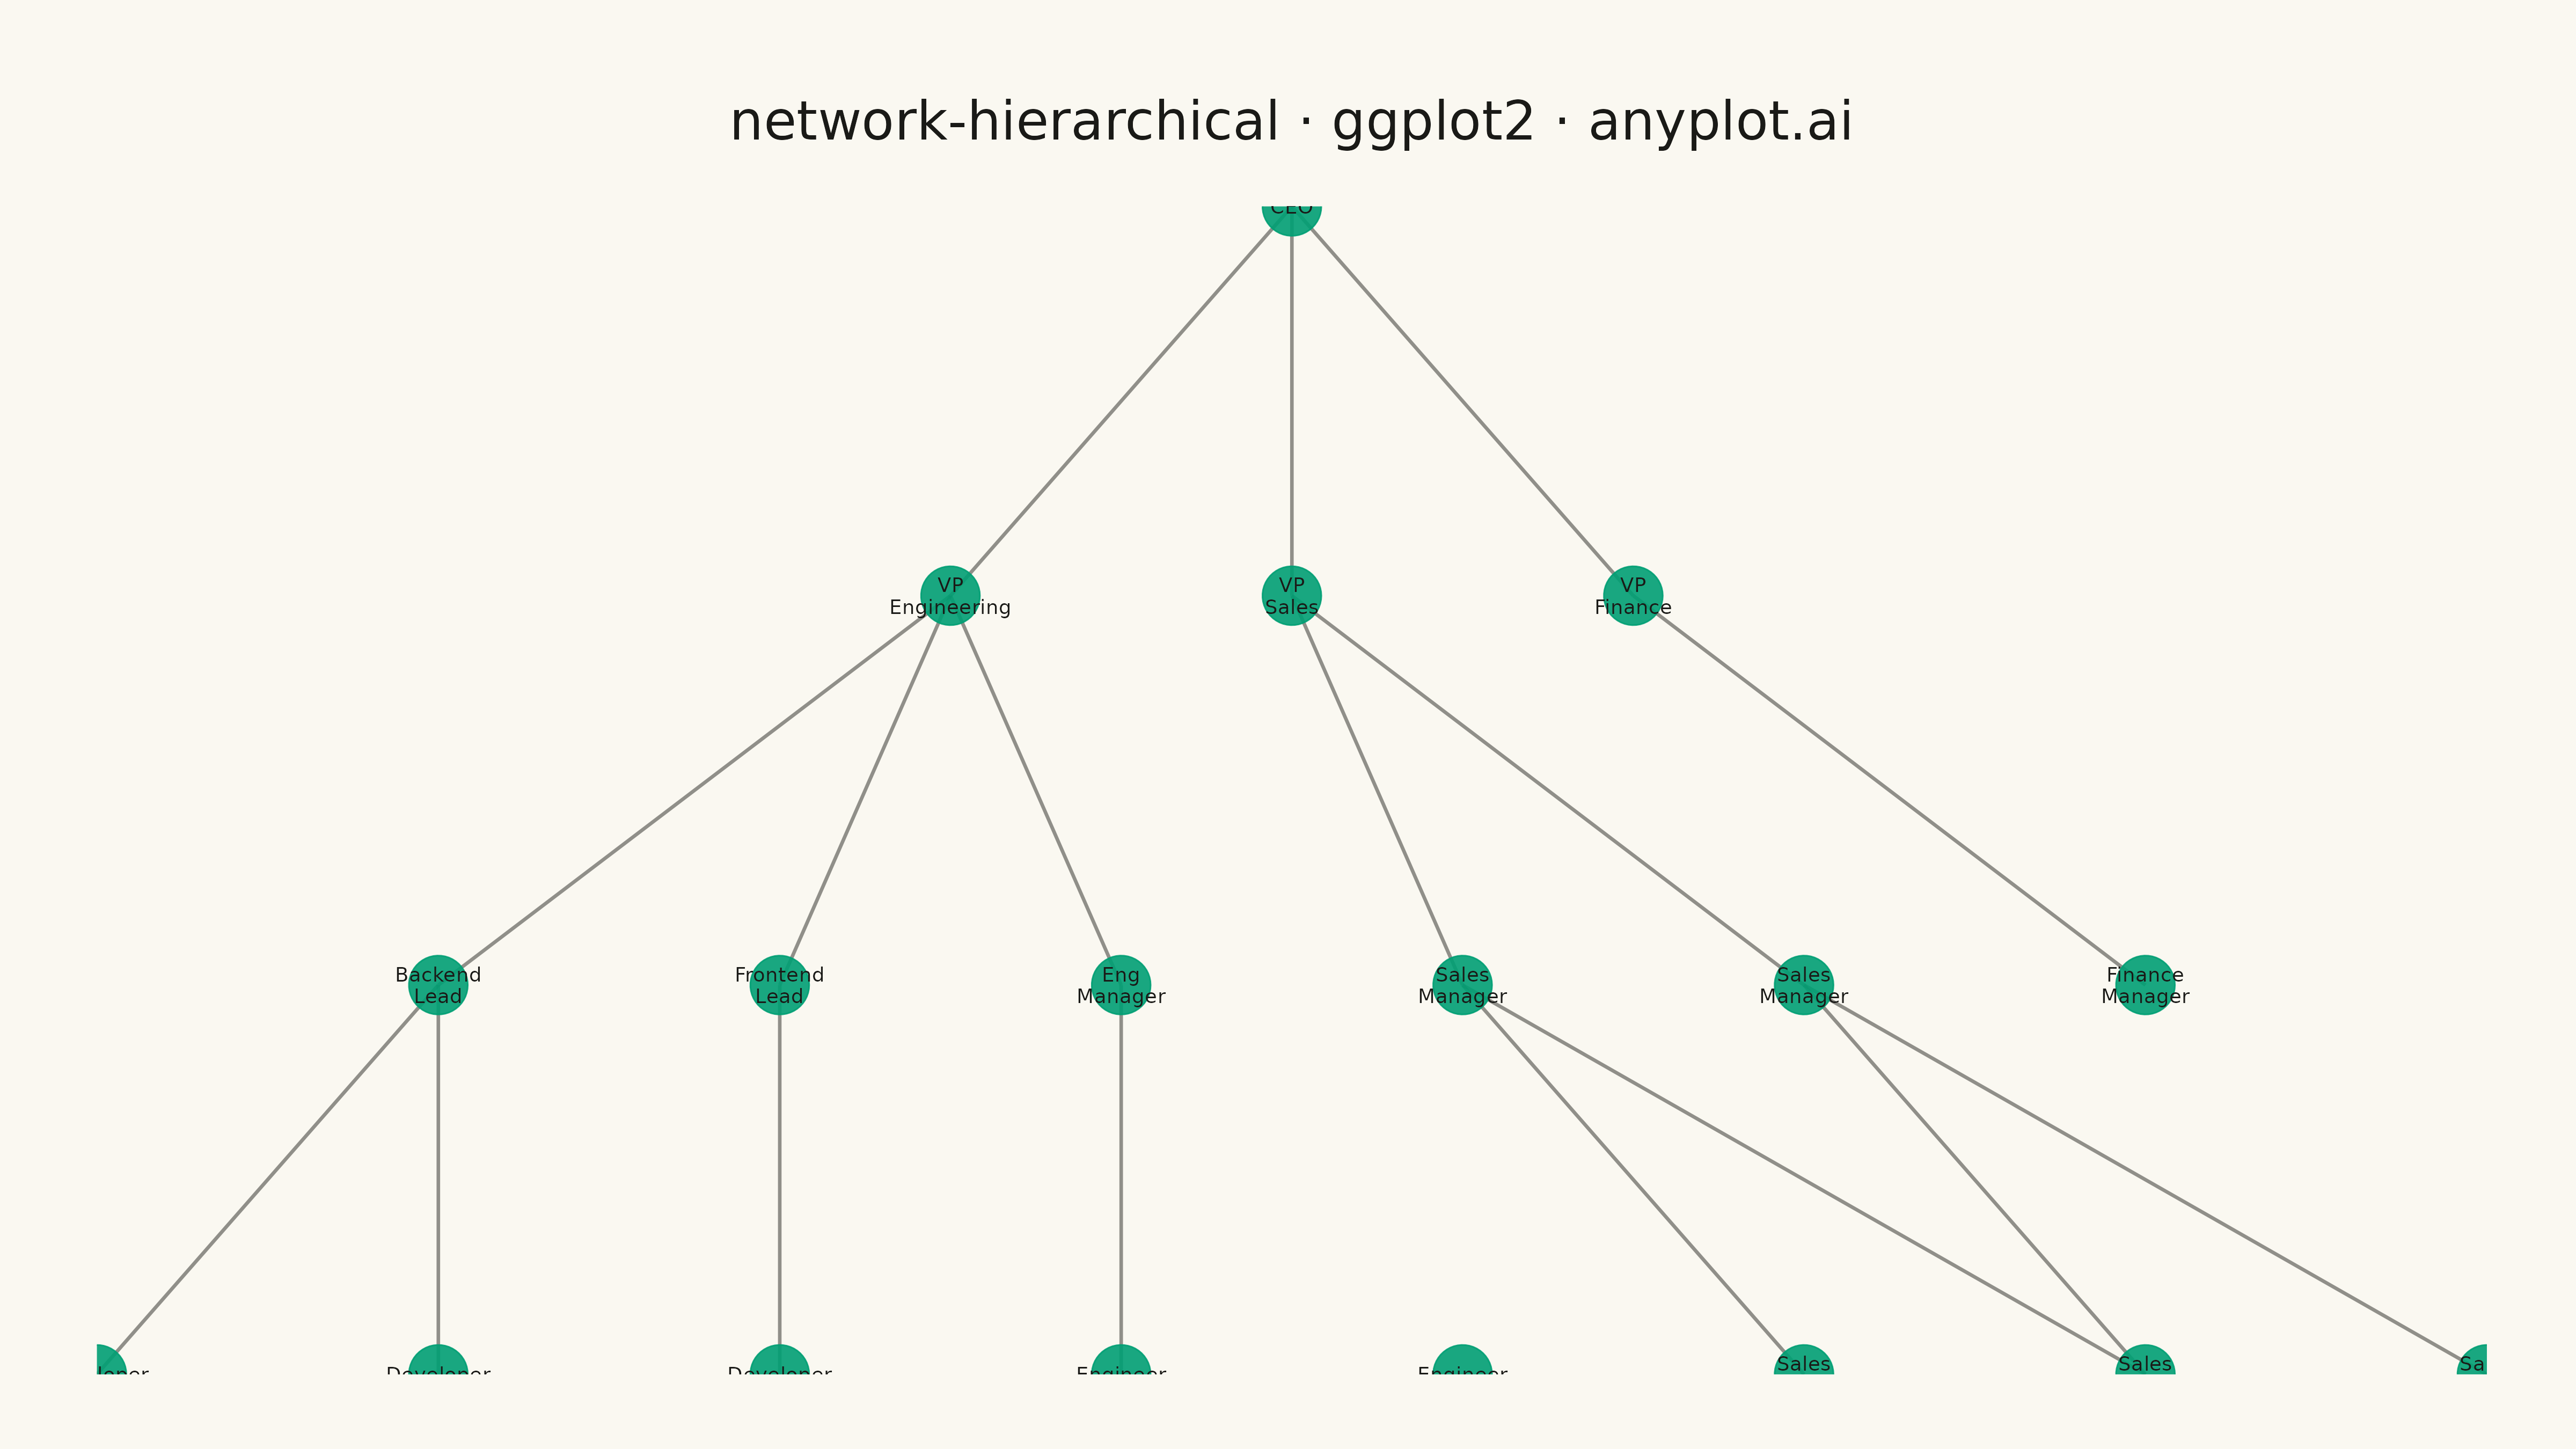
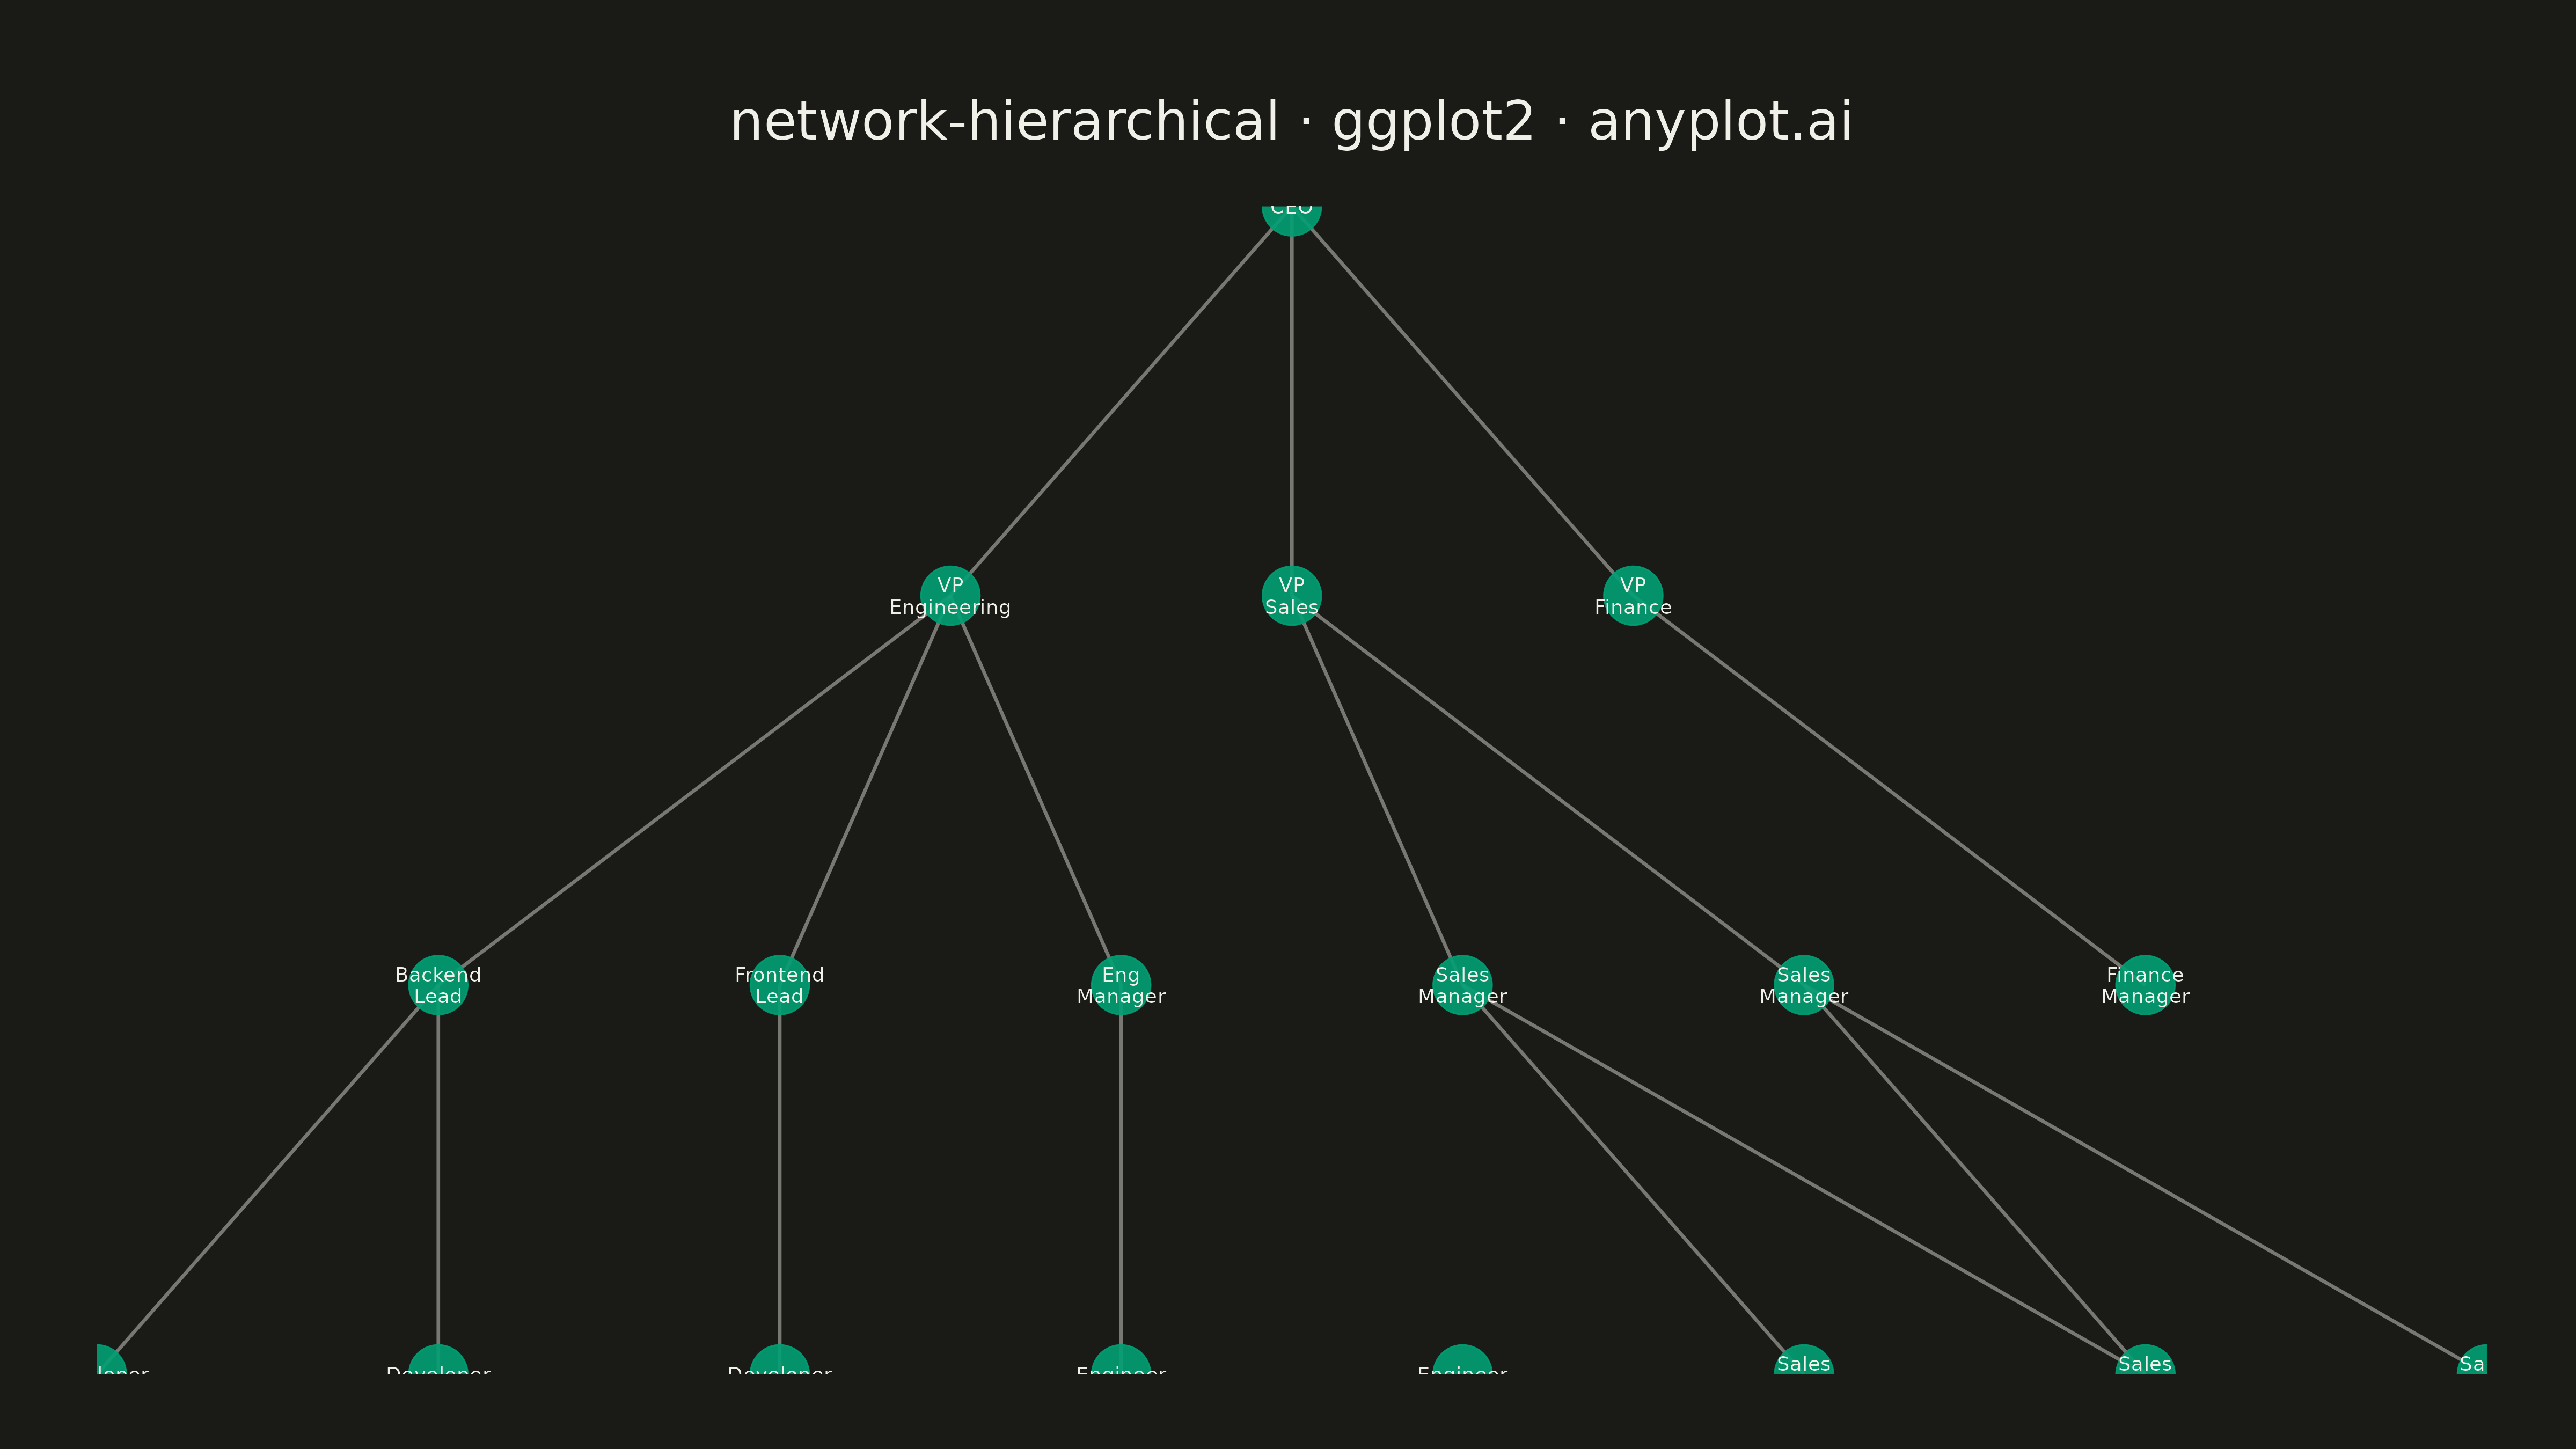
A hierarchical network graph organizes nodes in distinct levels from root to leaves, with edges showing parent-child relationships between levels. Unlike force-directed layouts that optimize for aesthetic spacing, hierarchical layouts explicitly encode tree structure by positioning nodes at fixed vertical or horizontal levels. This visualization reveals organizational depth, branching patterns, and the overall tree structure at a glance.
#' anyplot.ai
#' network-hierarchical: Hierarchical Network Graph with Tree Layout
#' Library: ggplot2 3.5.1 | R 4.4.1
#' Quality: 81/100 | Created: 2026-05-17

library(ggplot2)
library(dplyr)
library(tidyr)
library(ragg)

set.seed(42)

# --- Theme tokens -----------------------------------------------------------
THEME       <- Sys.getenv("ANYPLOT_THEME", "light")
PAGE_BG     <- if (THEME == "light") "#FAF8F1" else "#1A1A17"
INK         <- if (THEME == "light") "#1A1A17" else "#F0EFE8"
INK_SOFT    <- if (THEME == "light") "#4A4A44" else "#B8B7B0"
IMPRINT   <- c("#009E73", "#C475FD", "#4467A3", "#BD8233",
                 "#AE3030", "#2ABCCD", "#954477")

# --- Data: Organization hierarchy -------------------------------------------
# Define nodes with their level (depth in tree)
nodes <- data.frame(
  id = c("ceo", "vp_eng", "vp_sales", "vp_fin",
         "be_lead", "fe_lead", "eng_mgr",
         "sales1", "sales2",
         "fin_mgr",
         "dev1", "dev2", "dev3",
         "eng1", "eng2",
         "rep1", "rep2", "rep3"),
  label = c("CEO", "VP\nEngineering", "VP\nSales", "VP\nFinance",
            "Backend\nLead", "Frontend\nLead", "Eng\nManager",
            "Sales\nManager", "Sales\nManager",
            "Finance\nManager",
            "Developer", "Developer", "Developer",
            "Engineer", "Engineer",
            "Sales\nRep", "Sales\nRep", "Sales\nRep"),
  level = c(0, 1, 1, 1,
            2, 2, 2,
            2, 2,
            2,
            3, 3, 3,
            3, 3,
            3, 3, 3)
)

# Define edges (parent -> child relationships)
edges <- data.frame(
  from_id = c("ceo", "ceo", "ceo",
              "vp_eng", "vp_eng", "vp_eng",
              "vp_sales", "vp_sales",
              "vp_fin",
              "be_lead", "be_lead",
              "fe_lead",
              "eng_mgr",
              "sales1", "sales1", "sales2", "sales2"),
  to_id = c("vp_eng", "vp_sales", "vp_fin",
            "be_lead", "fe_lead", "eng_mgr",
            "sales1", "sales2",
            "fin_mgr",
            "dev1", "dev2",
            "dev3",
            "eng1",
            "rep1", "rep2", "rep3", "rep2")
)

# Calculate horizontal positions for each level
level_counts <- nodes %>%
  group_by(level) %>%
  mutate(
    pos_in_level = row_number(),
    n_at_level = n(),
    x = pos_in_level - (n_at_level + 1) / 2
  ) %>%
  ungroup() %>%
  select(id, x)

# Add coordinates to nodes
nodes <- nodes %>%
  left_join(level_counts, by = "id") %>%
  mutate(y = -level * 2.2)

# Merge coordinates for edges
edges <- edges %>%
  left_join(nodes %>% select(id, x, y), by = c("from_id" = "id")) %>%
  rename(x_from = x, y_from = y) %>%
  left_join(nodes %>% select(id, x, y), by = c("to_id" = "id")) %>%
  rename(x_to = x, y_to = y)

# --- Plot -------------------------------------------------------------------
p <- ggplot() +
  # Draw edges (parent to child)
  geom_segment(
    data = edges,
    aes(x = x_from, y = y_from, xend = x_to, yend = y_to),
    color = INK_SOFT, linewidth = 0.75, alpha = 0.6
  ) +
  # Draw nodes
  geom_point(
    data = nodes,
    aes(x = x, y = y),
    color = IMPRINT[1], size = 12, alpha = 0.9
  ) +
  # Add node labels
  geom_text(
    data = nodes,
    aes(x = x, y = y, label = label),
    size = 3.2, color = INK, vjust = 0.5, hjust = 0.5,
    lineheight = 0.9, fontface = "plain"
  ) +
  labs(
    title = "network-hierarchical · ggplot2 · anyplot.ai",
    x = "", y = ""
  ) +
  theme_minimal(base_size = 14) +
  theme(
    plot.background = element_rect(fill = PAGE_BG, color = PAGE_BG),
    panel.background = element_rect(fill = PAGE_BG, color = NA),
    panel.grid = element_blank(),
    axis.text = element_blank(),
    axis.title = element_blank(),
    axis.ticks = element_blank(),
    plot.title = element_text(
      color = INK, size = 24, hjust = 0.5,
      margin = margin(b = 25, t = 15)
    ),
    plot.margin = margin(30, 40, 30, 40, "pt")
  ) +
  coord_cartesian(expand = FALSE)

# --- Save -------------------------------------------------------------------
ggsave(
  filename = sprintf("plot-%s.png", THEME),
  plot = p,
  device = ragg::agg_png,
  width = 16,
  height = 9,
  units = "in",
  dpi = 300
)
Runnable source as JSON, for any HTTP client: https://api.anyplot.ai/specs/network-hierarchical/ggplot2/code. Any spec id and library id listed in llms-full.txt fit the same URL shape; every URL below is complete and callable.
{
  "spec_id": "network-hierarchical",
  "language": "r",
  "library": "ggplot2",
  "page": "https://anyplot.ai/network-hierarchical/r/ggplot2",
  "hub": "https://anyplot.ai/network-hierarchical",
  "code_json": "https://api.anyplot.ai/specs/network-hierarchical/ggplot2/code",
  "spec_json": "https://api.anyplot.ai/specs/network-hierarchical",
  "render_light_png": "https://storage.googleapis.com/anyplot-images/plots/network-hierarchical/r/ggplot2/plot-light.png",
  "render_dark_png": "https://storage.googleapis.com/anyplot-images/plots/network-hierarchical/r/ggplot2/plot-dark.png",
  "quality_score": 81.0,
  "license": "MIT",
  "guide": "https://anyplot.ai/llms.txt"
}
Part of Hierarchical Network Graph with Tree Layout on anyplot.ai.