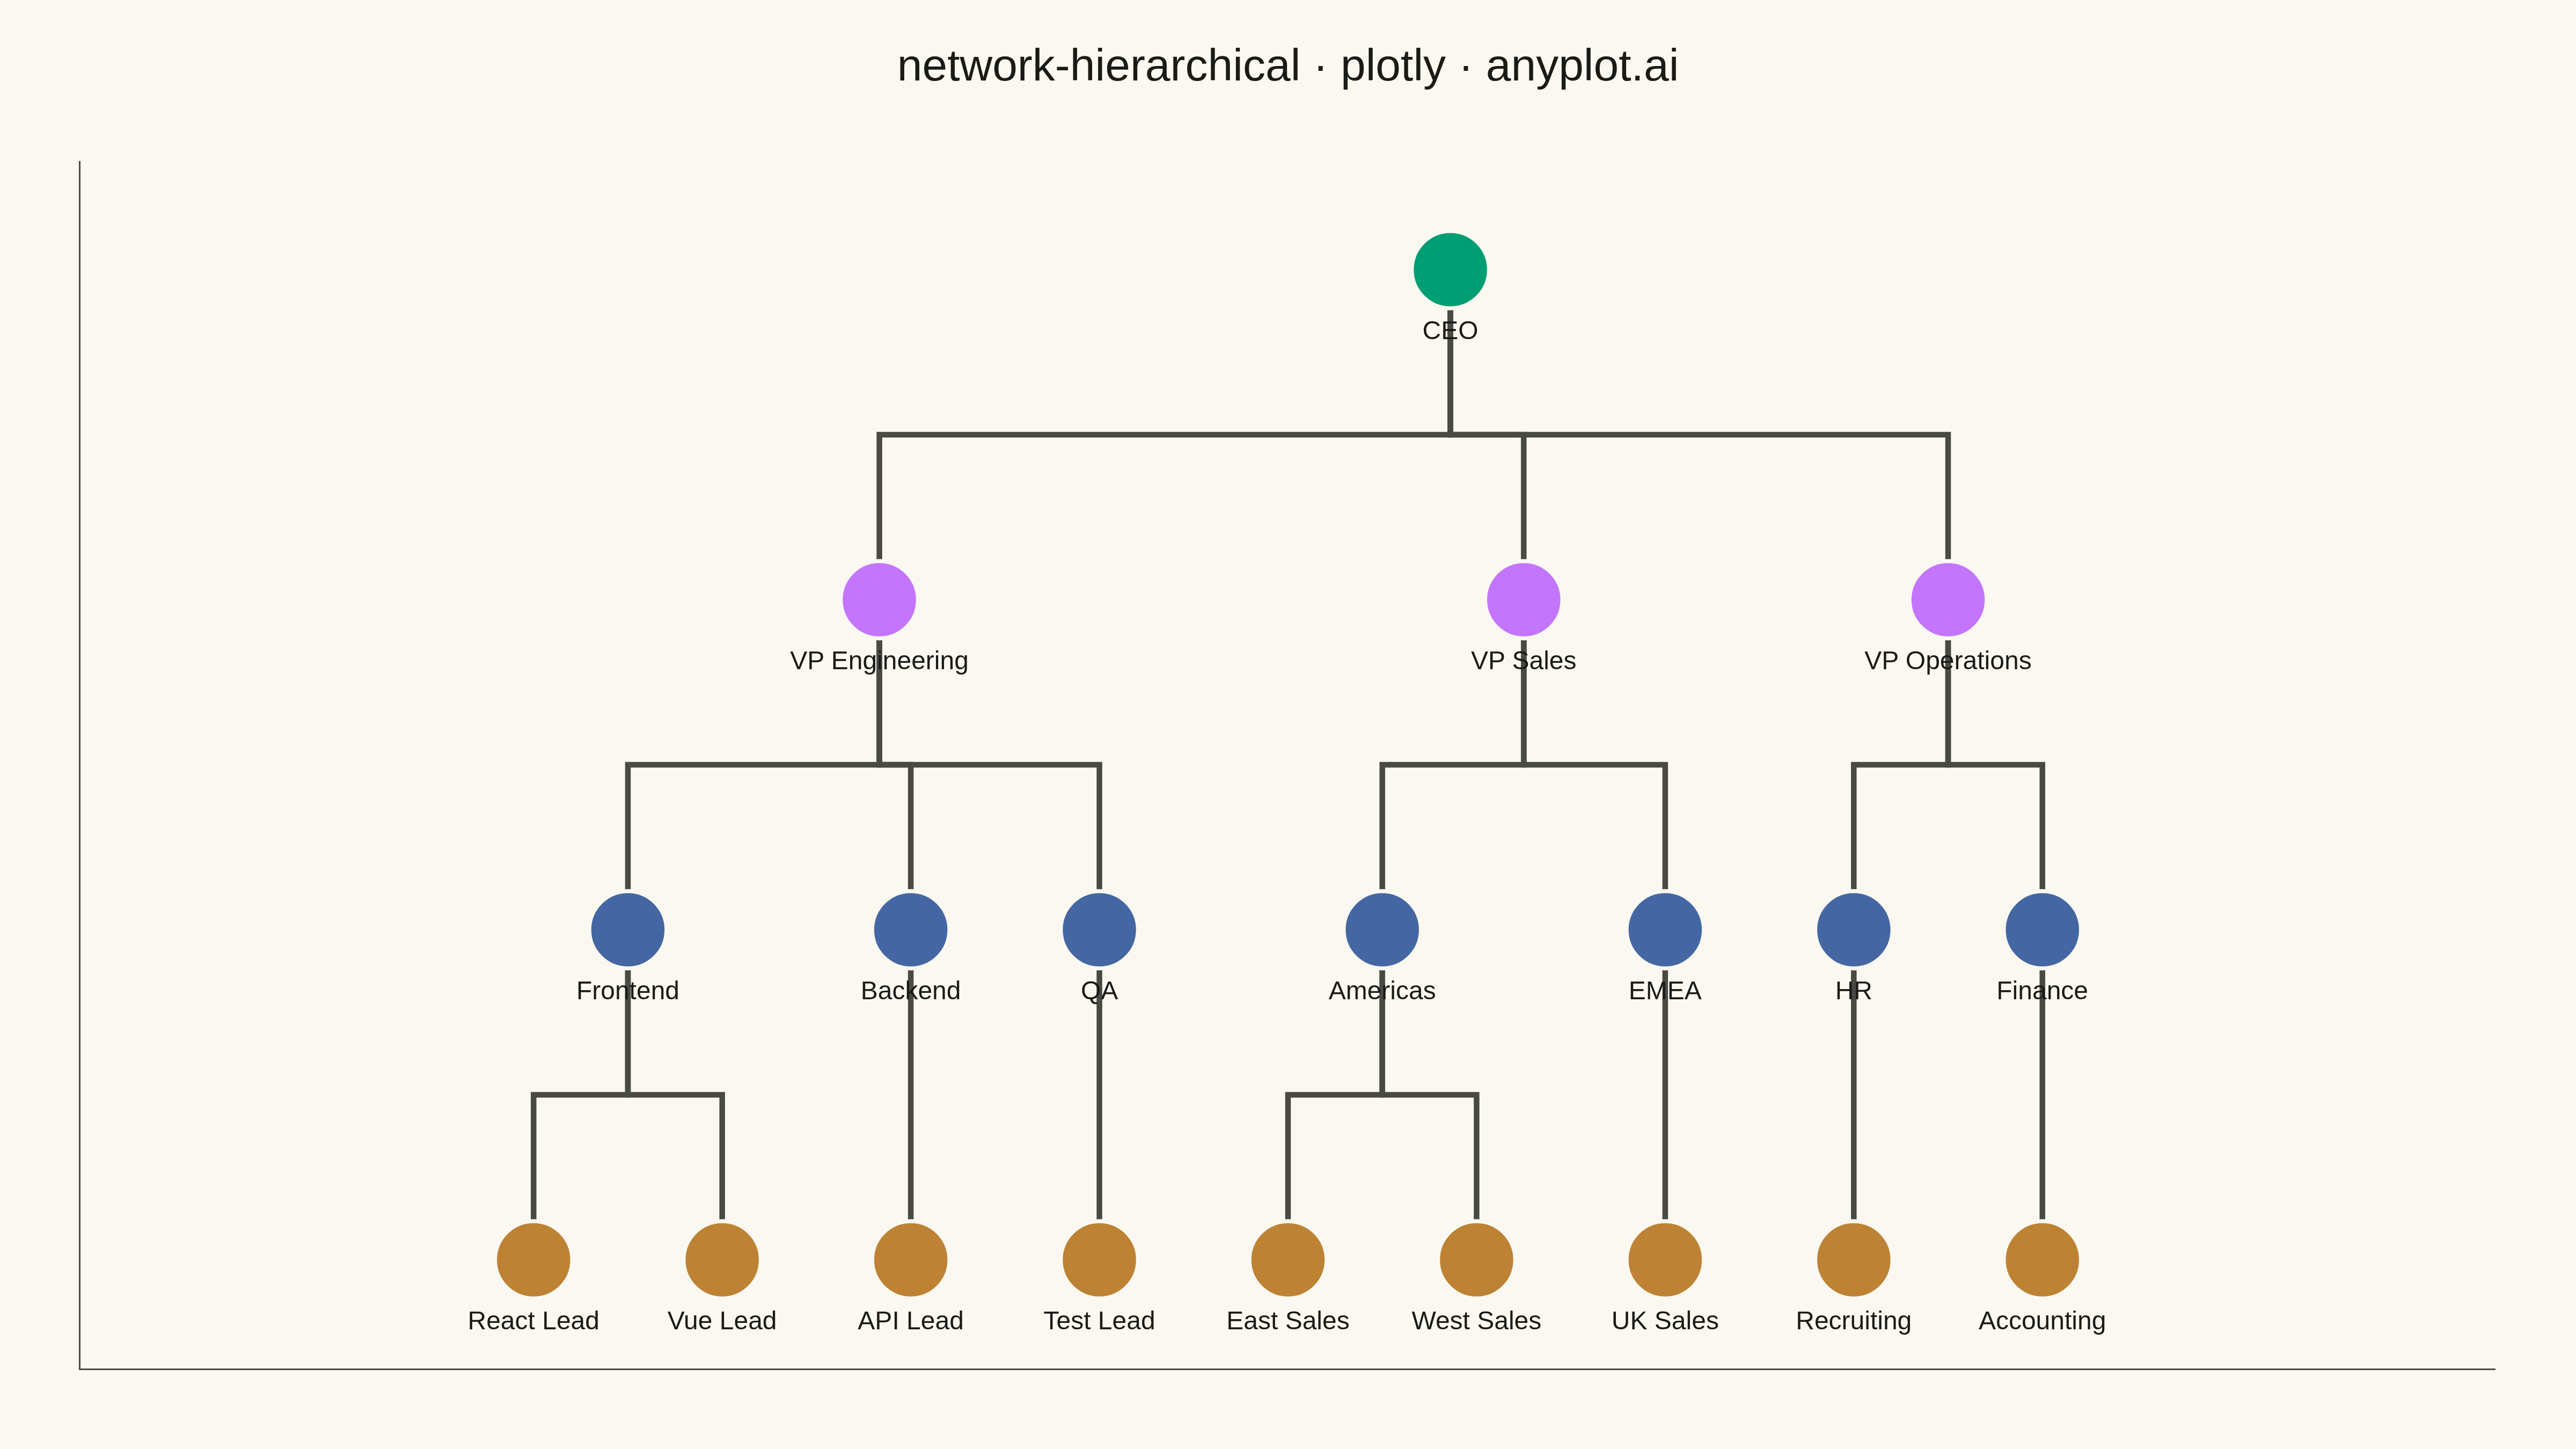
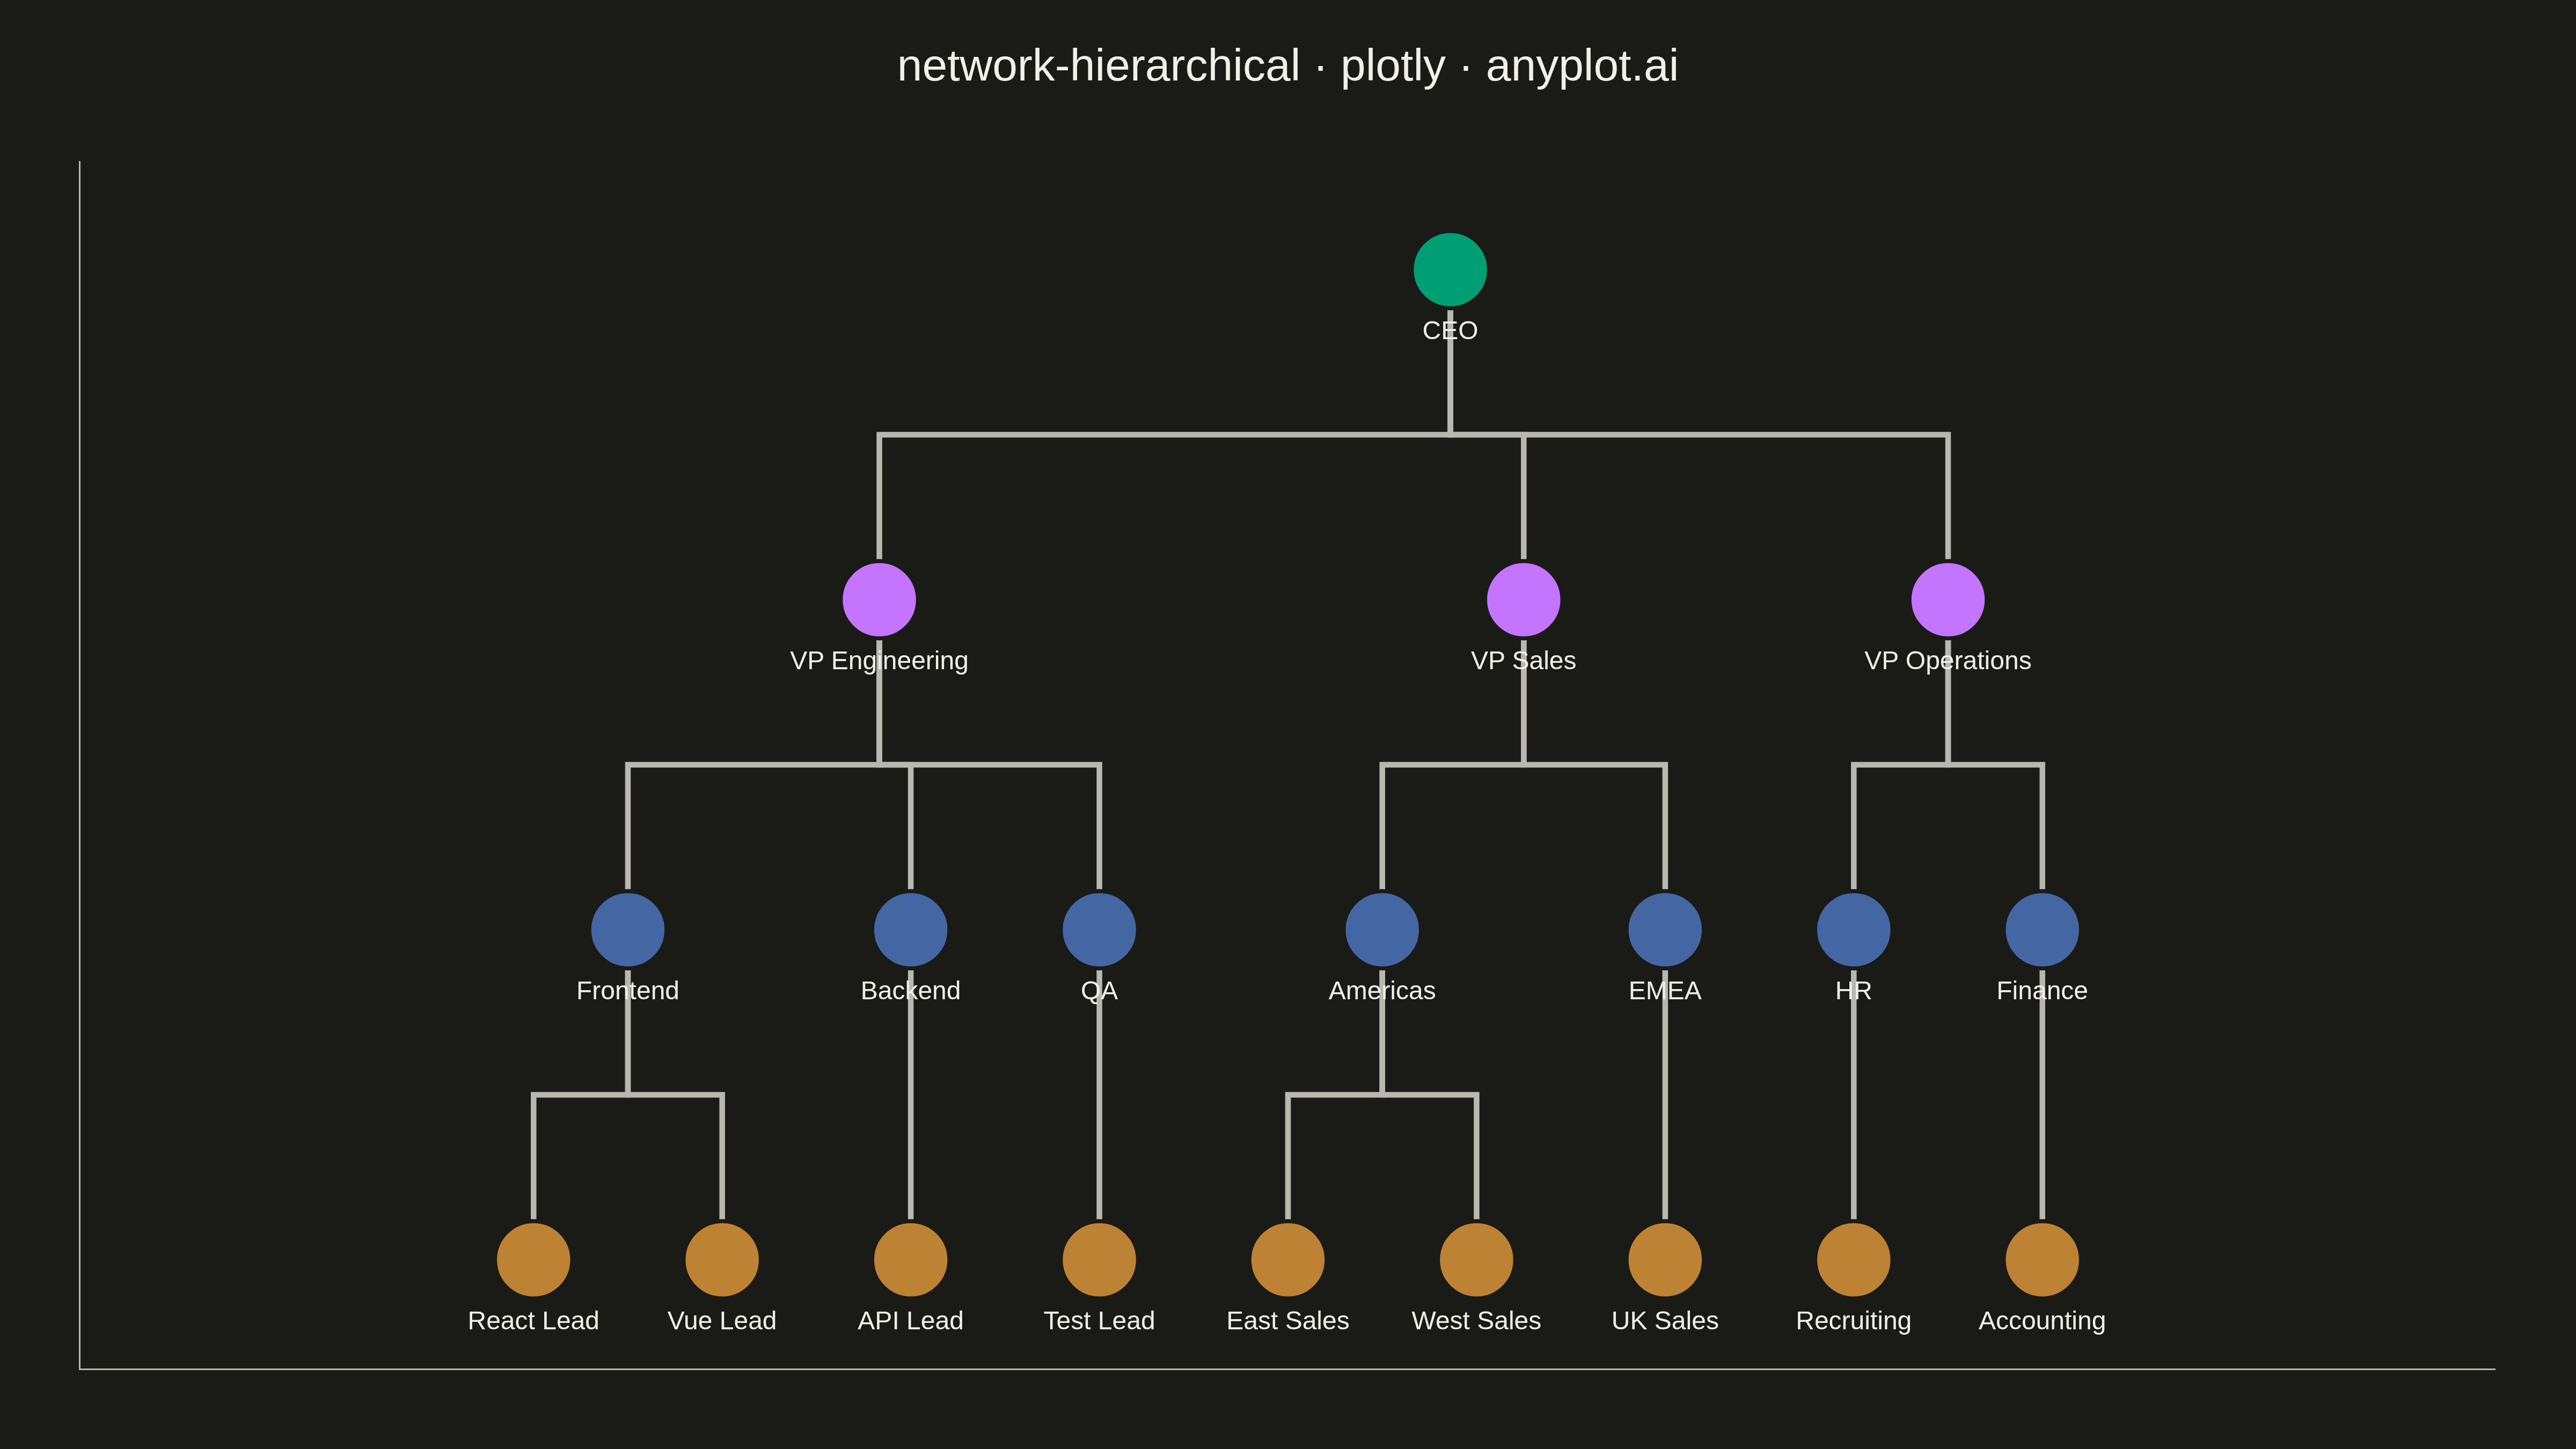
A hierarchical network graph organizes nodes in distinct levels from root to leaves, with edges showing parent-child relationships between levels. Unlike force-directed layouts that optimize for aesthetic spacing, hierarchical layouts explicitly encode tree structure by positioning nodes at fixed vertical or horizontal levels. This visualization reveals organizational depth, branching patterns, and the overall tree structure at a glance.
""" anyplot.ai
network-hierarchical: Hierarchical Network Graph with Tree Layout
Library: plotly 6.7.0 | Python 3.13.13
Quality: 90/100 | Updated: 2026-05-17
"""

import os

import plotly.graph_objects as go


# Theme tokens
THEME = os.getenv("ANYPLOT_THEME", "light")
PAGE_BG = "#FAF8F1" if THEME == "light" else "#1A1A17"
ELEVATED_BG = "#FFFDF6" if THEME == "light" else "#242420"
INK = "#1A1A17" if THEME == "light" else "#F0EFE8"
INK_SOFT = "#4A4A44" if THEME == "light" else "#B8B7B0"

# Okabe-Ito palette for hierarchy levels (position 1 is brand, then positions 2-4)
LEVEL_COLORS = {
    0: "#009E73",  # Position 1 - brand green (CEO)
    1: "#C475FD",  # Position 2 - vermillion (VPs)
    2: "#4467A3",  # Position 3 - blue (Directors)
    3: "#BD8233",  # Position 4 - reddish purple (Leads)
}

# Data: Organizational chart with 22 employees across 4 levels - asymmetric structure
nodes = {
    # Level 0 - CEO
    "CEO": {"label": "CEO", "level": 0, "parent": None},
    # Level 1 - VPs (3 VPs, different subtree sizes)
    "VP_Eng": {"label": "VP Engineering", "level": 1, "parent": "CEO"},
    "VP_Sales": {"label": "VP Sales", "level": 1, "parent": "CEO"},
    "VP_Ops": {"label": "VP Operations", "level": 1, "parent": "CEO"},
    # Level 2 - Directors (asymmetric: 3 under Eng, 2 under Sales, 2 under Ops)
    "Dir_FE": {"label": "Frontend", "level": 2, "parent": "VP_Eng"},
    "Dir_BE": {"label": "Backend", "level": 2, "parent": "VP_Eng"},
    "Dir_QA": {"label": "QA", "level": 2, "parent": "VP_Eng"},
    "Dir_NA": {"label": "Americas", "level": 2, "parent": "VP_Sales"},
    "Dir_EU": {"label": "EMEA", "level": 2, "parent": "VP_Sales"},
    "Dir_HR": {"label": "HR", "level": 2, "parent": "VP_Ops"},
    "Dir_Fin": {"label": "Finance", "level": 2, "parent": "VP_Ops"},
    # Level 3 - Leads (asymmetric: 2 under FE, 1 under BE, 1 under QA, 2 under NA, 1 under EU, 1 under HR, 1 under Fin)
    "Mgr_React": {"label": "React Lead", "level": 3, "parent": "Dir_FE"},
    "Mgr_Vue": {"label": "Vue Lead", "level": 3, "parent": "Dir_FE"},
    "Mgr_API": {"label": "API Lead", "level": 3, "parent": "Dir_BE"},
    "Mgr_Test": {"label": "Test Lead", "level": 3, "parent": "Dir_QA"},
    "Mgr_East": {"label": "East Sales", "level": 3, "parent": "Dir_NA"},
    "Mgr_West": {"label": "West Sales", "level": 3, "parent": "Dir_NA"},
    "Mgr_UK": {"label": "UK Sales", "level": 3, "parent": "Dir_EU"},
    "Mgr_Recruit": {"label": "Recruiting", "level": 3, "parent": "Dir_HR"},
    "Mgr_Acct": {"label": "Accounting", "level": 3, "parent": "Dir_Fin"},
}

# Build edges and children lookup
edges = []
children = {node_id: [] for node_id in nodes}
for node_id, data in nodes.items():
    if data["parent"]:
        edges.append((data["parent"], node_id))
        children[data["parent"]].append(node_id)

# Calculate positions using bottom-up tree layout
positions = {}
leaf_spacing = 1.6
level_height = 2.8

# Get all leaf nodes (level 3) and assign sequential x positions
leaf_nodes = [n for n in nodes if nodes[n]["level"] == 3]
for i, node_id in enumerate(leaf_nodes):
    x = (i - (len(leaf_nodes) - 1) / 2) * leaf_spacing
    positions[node_id] = (x, -3 * level_height)

# Level 2: center each director over its children
for node_id in [n for n in nodes if nodes[n]["level"] == 2]:
    child_xs = [positions[c][0] for c in children[node_id]]
    center_x = sum(child_xs) / len(child_xs) if child_xs else 0
    positions[node_id] = (center_x, -2 * level_height)

# Level 1: center each VP over its children
for node_id in [n for n in nodes if nodes[n]["level"] == 1]:
    child_xs = [positions[c][0] for c in children[node_id]]
    center_x = sum(child_xs) / len(child_xs) if child_xs else 0
    positions[node_id] = (center_x, -1 * level_height)

# Level 0: center CEO over VPs
ceo_children = children["CEO"]
center_x = sum(positions[c][0] for c in ceo_children) / len(ceo_children)
positions["CEO"] = (center_x, 0)

# Create edge traces with orthogonal routing
edge_x = []
edge_y = []
for parent_id, child_id in edges:
    x0, y0 = positions[parent_id]
    x1, y1 = positions[child_id]
    mid_y = (y0 + y1) / 2
    edge_x.extend([x0, x0, x1, x1, None])
    edge_y.extend([y0, mid_y, mid_y, y1, None])

edge_trace = go.Scatter(
    x=edge_x, y=edge_y, mode="lines", line={"width": 3.5, "color": INK_SOFT}, hoverinfo="none", showlegend=False
)

# Create node trace
node_x = [positions[n][0] for n in nodes]
node_y = [positions[n][1] for n in nodes]
node_labels = [nodes[n]["label"] for n in nodes]
node_colors = [LEVEL_COLORS[nodes[n]["level"]] for n in nodes]
node_levels = [nodes[n]["level"] for n in nodes]

# Enhanced hover text with level information
hover_texts = [f"{nodes[n]['label']}<br>Level {nodes[n]['level']}" for n in nodes]

node_trace = go.Scatter(
    x=node_x,
    y=node_y,
    mode="markers+text",
    marker={"size": 48, "color": node_colors, "line": {"width": 2.5, "color": PAGE_BG}},
    text=node_labels,
    textposition="bottom center",
    textfont={"size": 16, "color": INK},
    hoverinfo="text",
    hovertext=hover_texts,
    showlegend=False,
)

# Create figure
fig = go.Figure(data=[edge_trace, node_trace])

# Update layout with theme-adaptive styling
fig.update_layout(
    title={
        "text": "network-hierarchical · plotly · anyplot.ai", "font": {"size": 28, "color": INK}, "x": 0.5, "xanchor": "center"
    },
    showlegend=False,
    xaxis={"showgrid": False, "zeroline": False, "showticklabels": False, "title": "", "linecolor": INK_SOFT},
    yaxis={
        "showgrid": False,
        "zeroline": False,
        "showticklabels": False,
        "title": "",
        "scaleanchor": "x",
        "scaleratio": 1,
        "linecolor": INK_SOFT,
    },
    paper_bgcolor=PAGE_BG,
    plot_bgcolor=PAGE_BG,
    margin={"l": 50, "r": 50, "t": 100, "b": 50},
    height=900,
    font={"color": INK},
)

# Save as PNG and HTML with theme suffix
fig.write_image(f"plot-{THEME}.png", width=1600, height=900, scale=3)
fig.write_html(f"plot-{THEME}.html", include_plotlyjs="cdn")
Runnable source as JSON, for any HTTP client: https://api.anyplot.ai/specs/network-hierarchical/plotly/code. Any spec id and library id listed in llms-full.txt fit the same URL shape; every URL below is complete and callable.
{
  "spec_id": "network-hierarchical",
  "language": "python",
  "library": "plotly",
  "page": "https://anyplot.ai/network-hierarchical/python/plotly",
  "hub": "https://anyplot.ai/network-hierarchical",
  "code_json": "https://api.anyplot.ai/specs/network-hierarchical/plotly/code",
  "spec_json": "https://api.anyplot.ai/specs/network-hierarchical",
  "render_light_png": "https://storage.googleapis.com/anyplot-images/plots/network-hierarchical/python/plotly/plot-light.png",
  "render_dark_png": "https://storage.googleapis.com/anyplot-images/plots/network-hierarchical/python/plotly/plot-dark.png",
  "interactive_light_html": "https://storage.googleapis.com/anyplot-images/plots/network-hierarchical/python/plotly/plot-light.html",
  "interactive_dark_html": "https://storage.googleapis.com/anyplot-images/plots/network-hierarchical/python/plotly/plot-dark.html",
  "quality_score": 90.0,
  "license": "MIT",
  "guide": "https://anyplot.ai/llms.txt"
}
Part of Hierarchical Network Graph with Tree Layout on anyplot.ai.