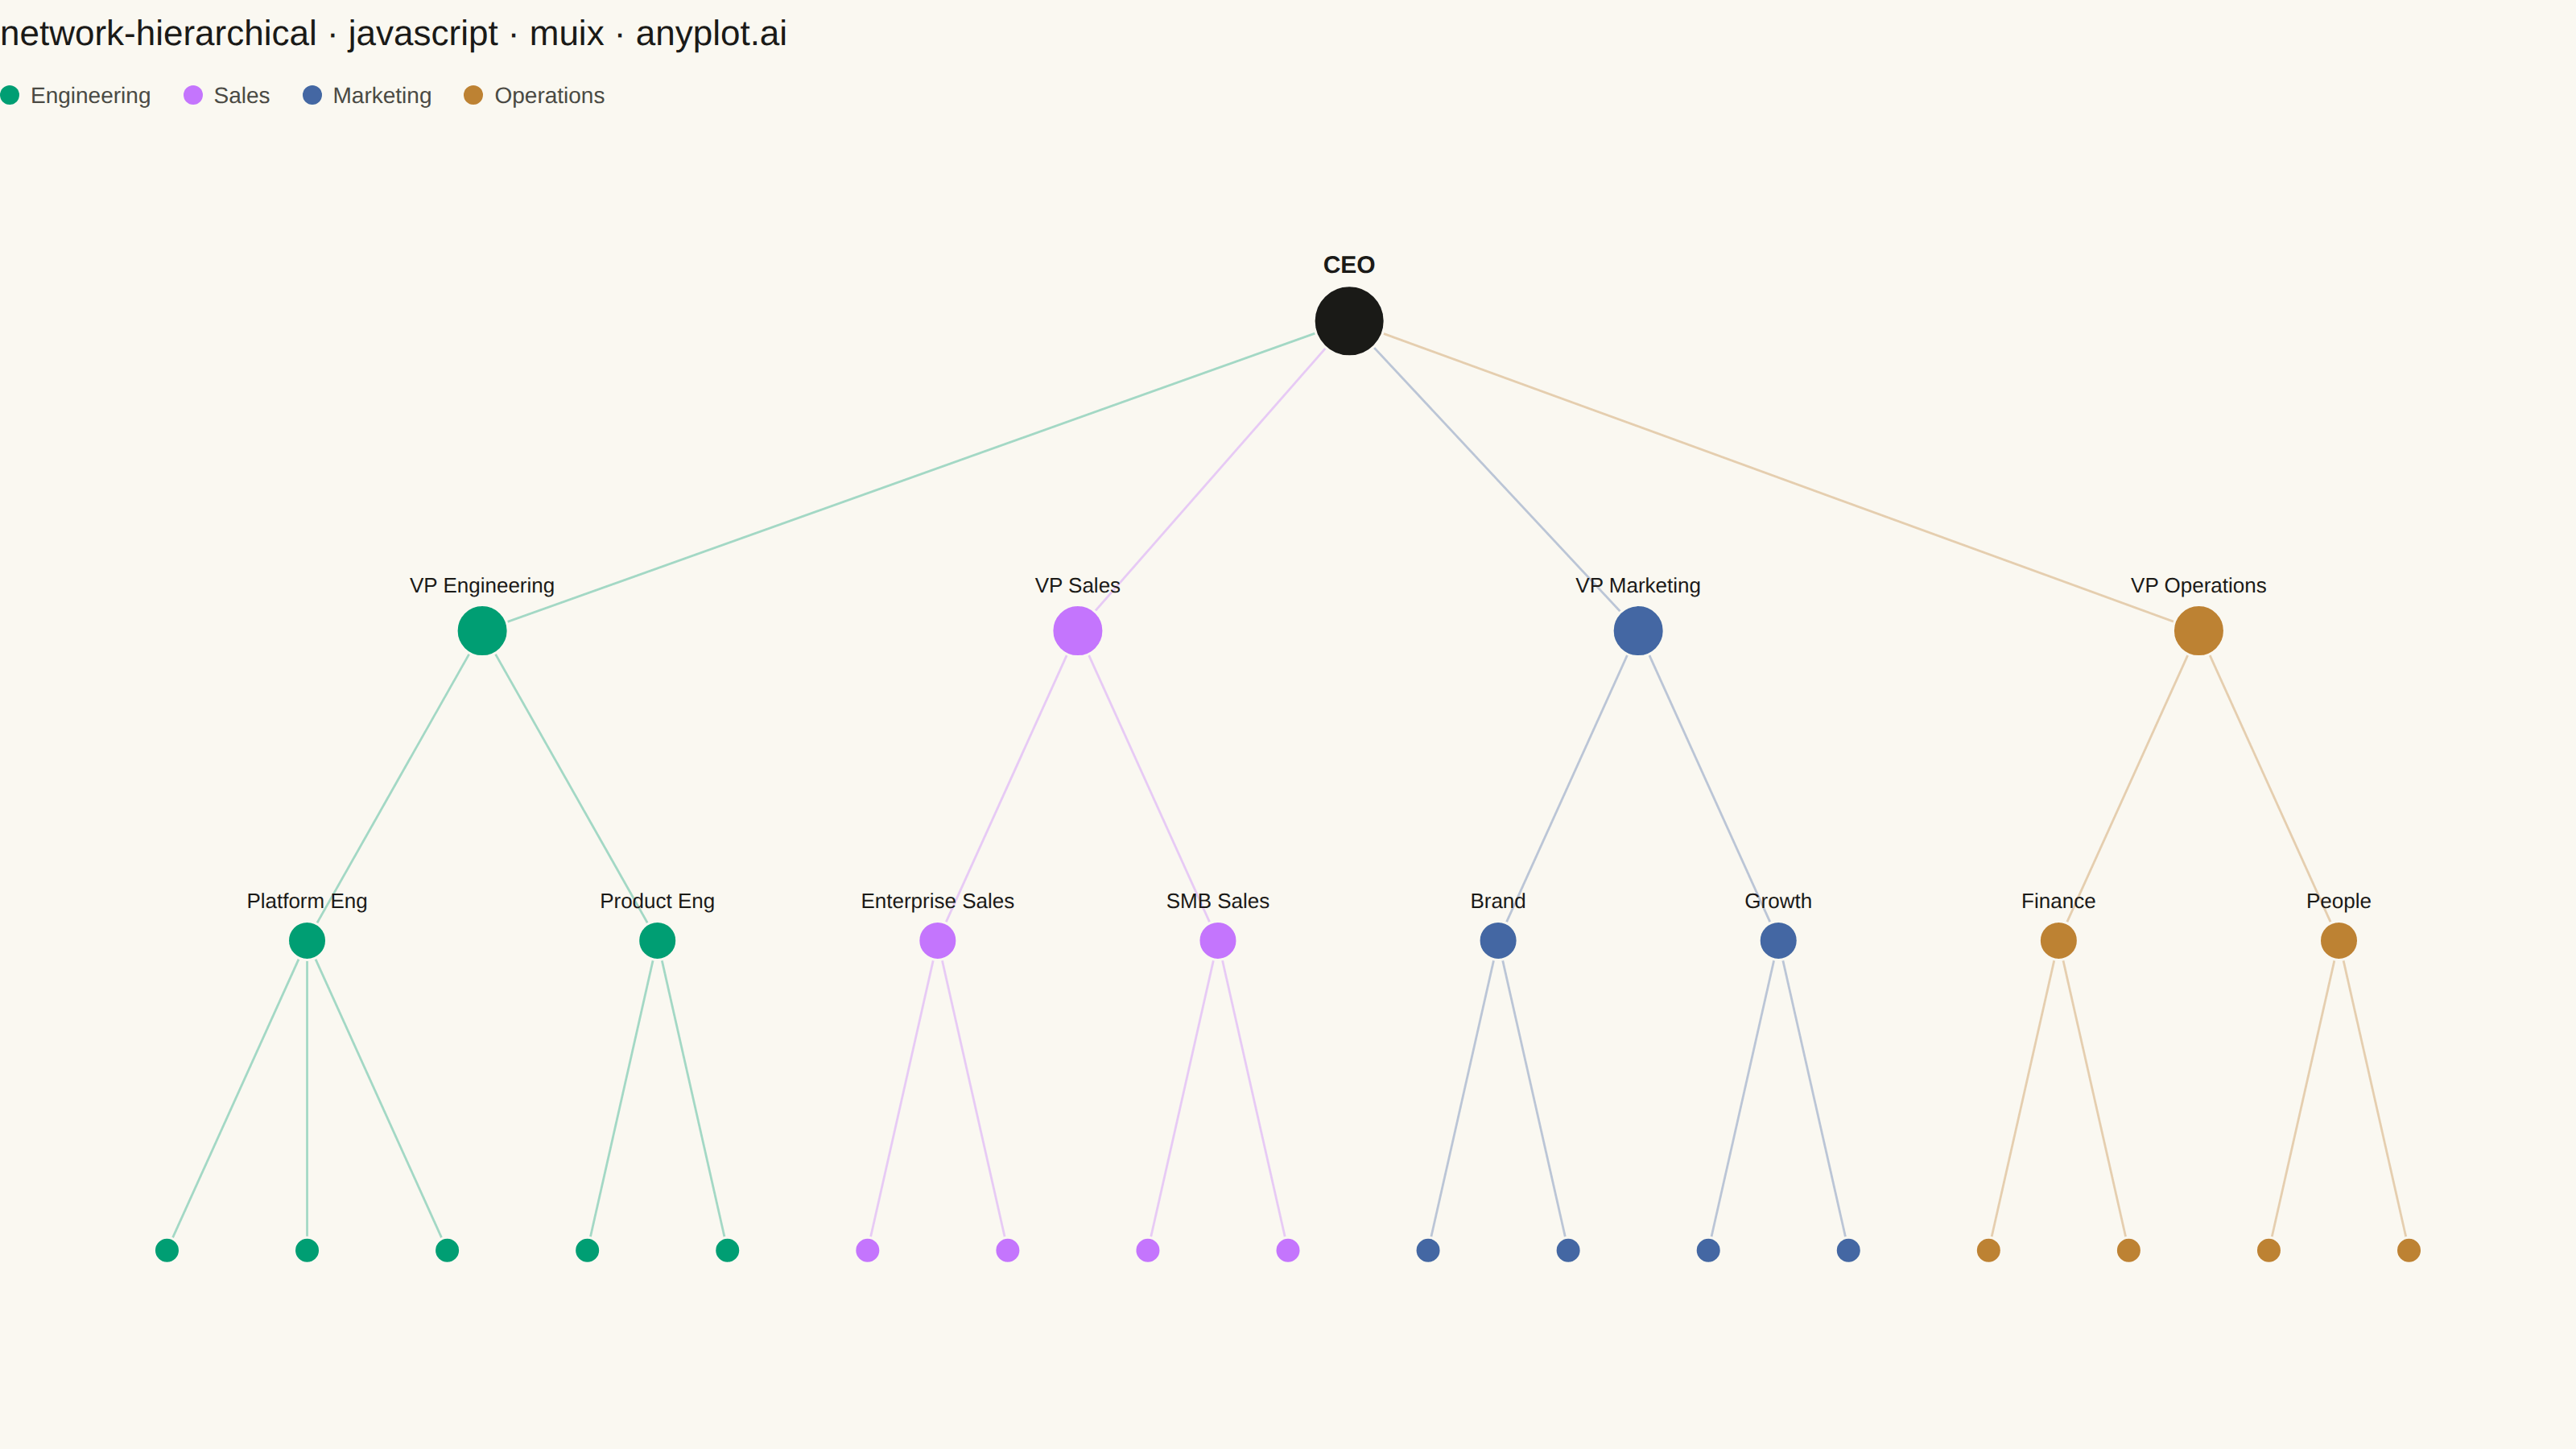
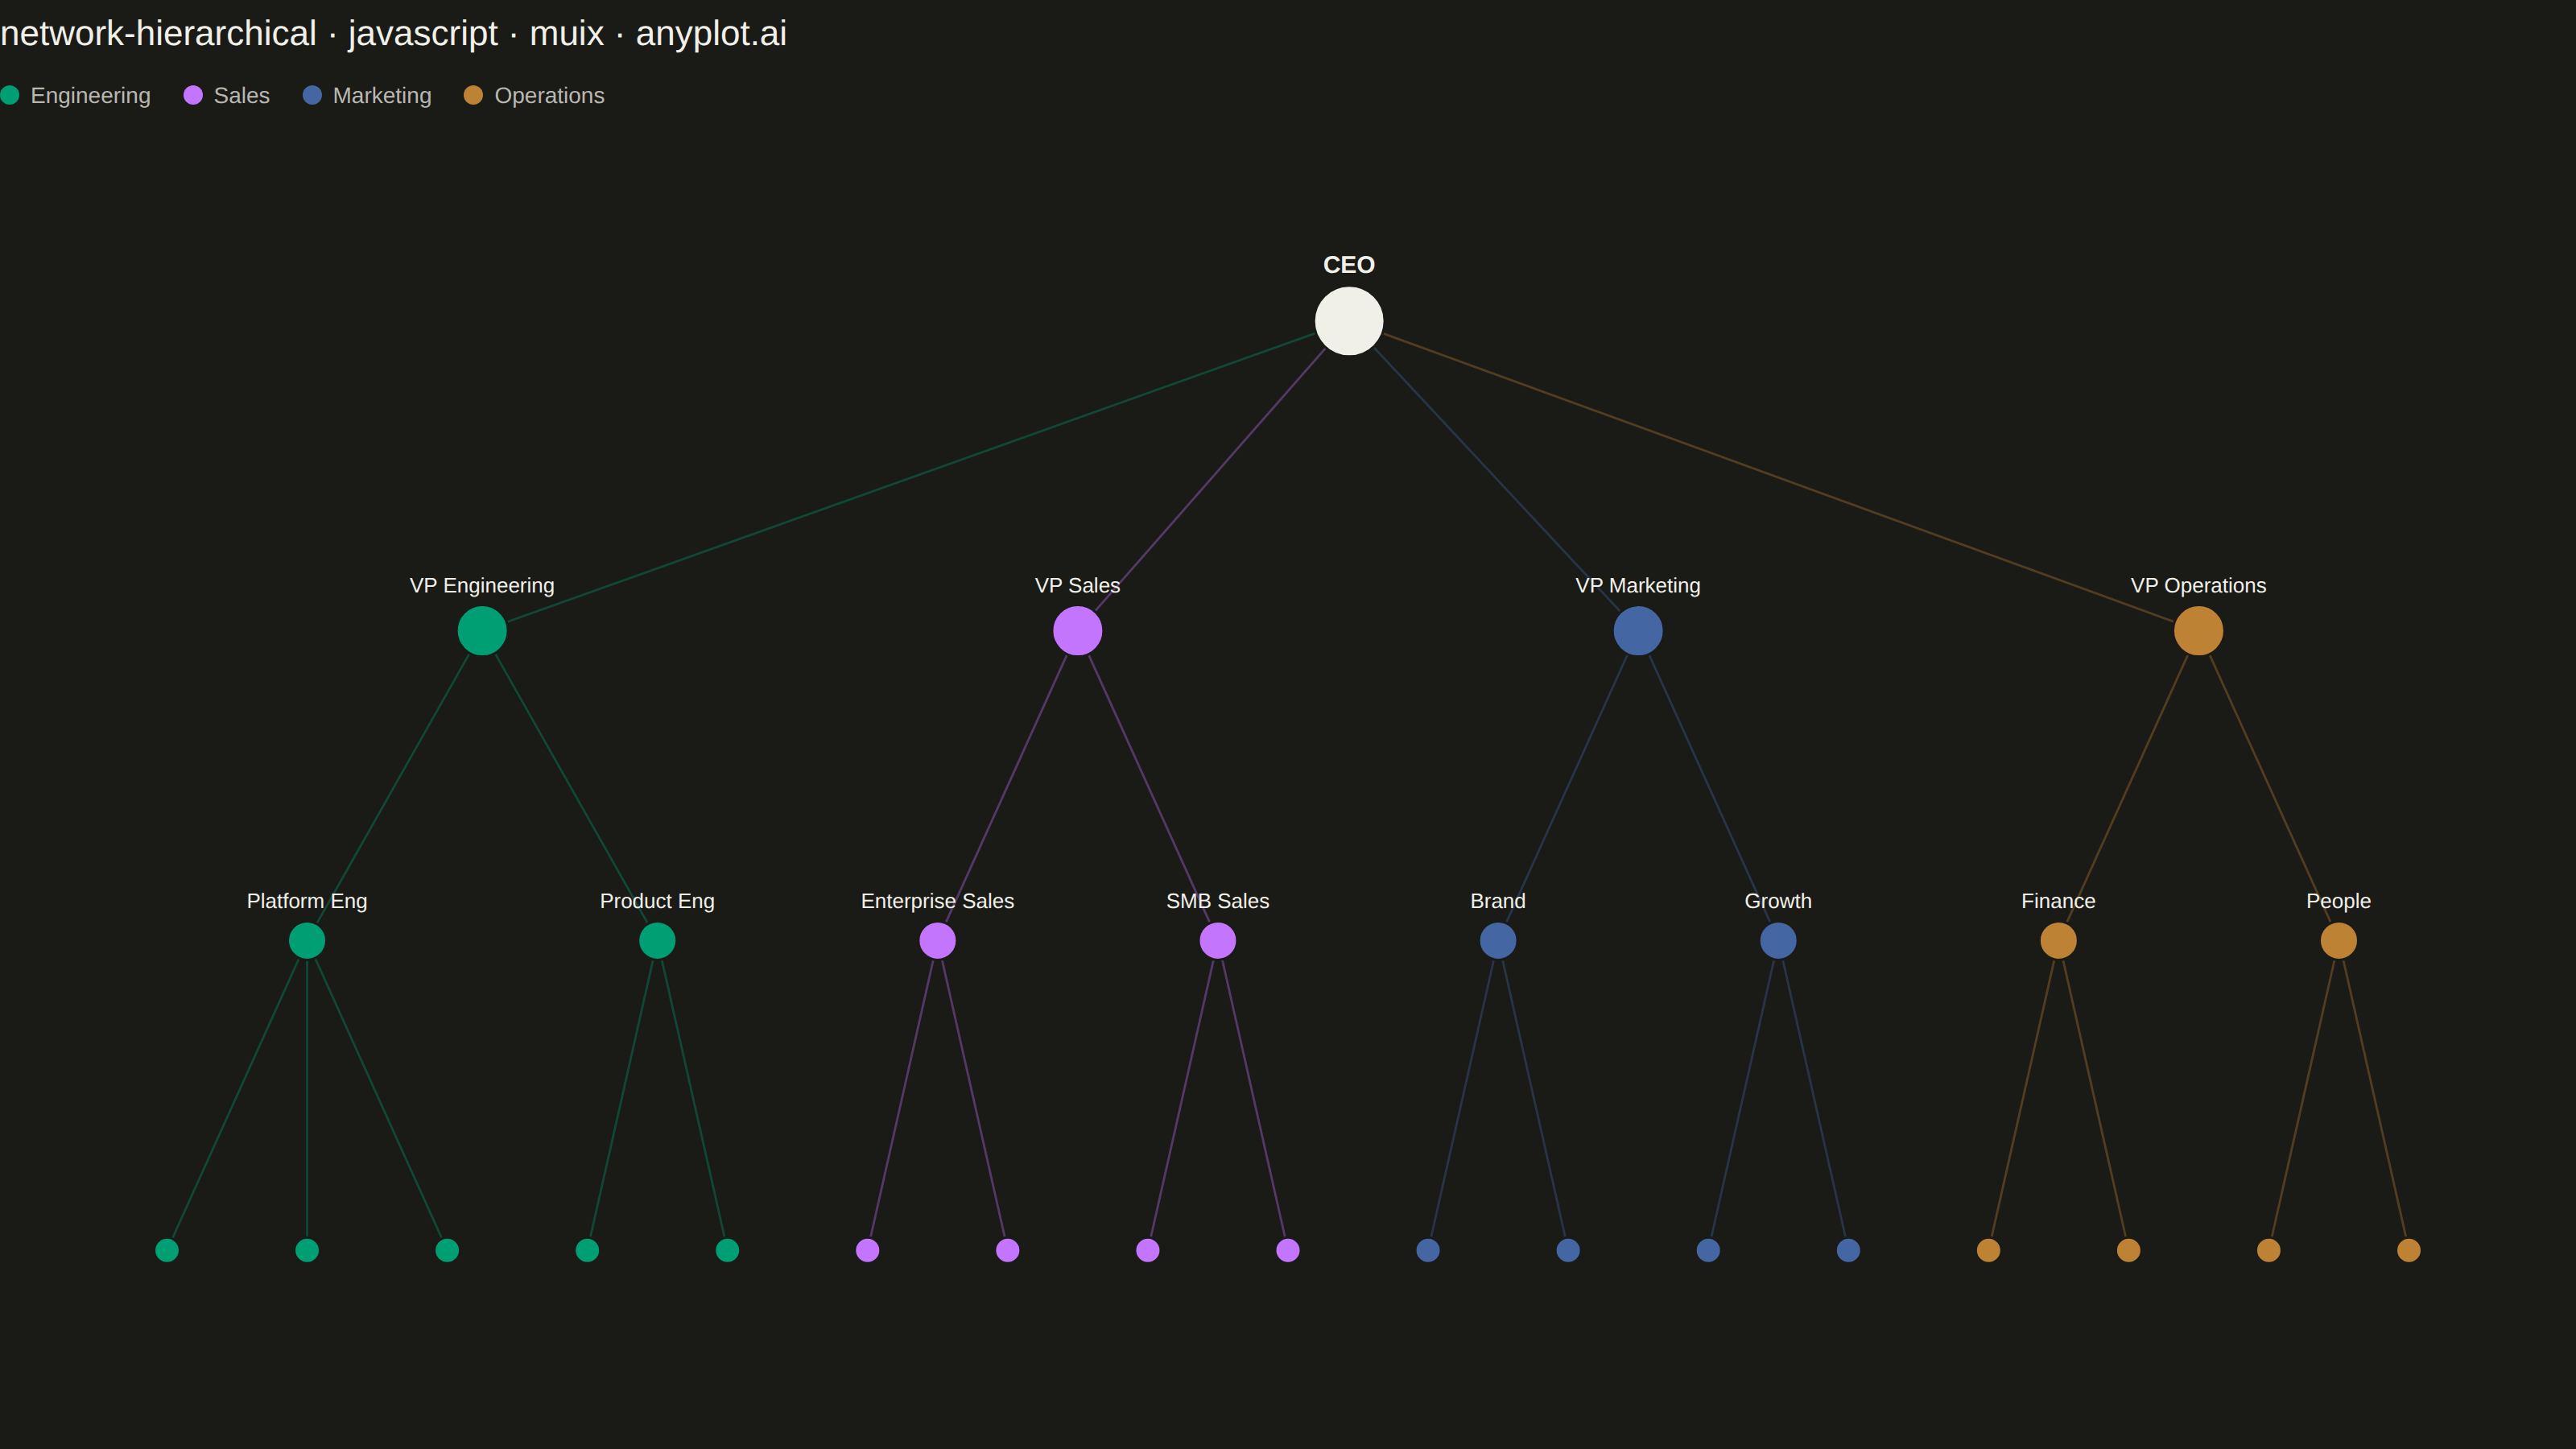
The same plot in 14 other libraries — JavaScript: Chart.js, D3.js, Apache ECharts, Highcharts; Python: Altair, Bokeh, lets-plot, Matplotlib, Plotly, plotnine, Pygal, Seaborn; R: ggplot2; Julia: Makie.jl. Compare all 15 side by side: Hierarchical Network Graph with Tree Layout in Python, R, Julia and JavaScript.
A hierarchical network graph organizes nodes in distinct levels from root to leaves, with edges showing parent-child relationships between levels. Unlike force-directed layouts that optimize for aesthetic spacing, hierarchical layouts explicitly encode tree structure by positioning nodes at fixed vertical or horizontal levels. This visualization reveals organizational depth, branching patterns, and the overall tree structure at a glance.
// anyplot.ai
// network-hierarchical: Hierarchical Network Graph with Tree Layout
// Library: muix 7.29.1 | JavaScript 22.23.2
// Quality: 90/100 | Created: 2026-09-02
import * as React from "react";
import { ChartContainer } from "@mui/x-charts/ChartContainer";
import { useXScale, useYScale } from "@mui/x-charts/hooks";

const t = window.ANYPLOT_TOKENS;

// --- Data: a 4-level company org chart (in-memory, deterministic) ----------
const DEPARTMENTS = [
  {
    name: "Engineering",
    directors: [
      { name: "Platform Eng", reports: ["Backend Eng 1", "Backend Eng 2", "Infra Eng"] },
      { name: "Product Eng", reports: ["Frontend Eng 1", "Frontend Eng 2"] },
    ],
  },
  {
    name: "Sales",
    directors: [
      { name: "Enterprise Sales", reports: ["Account Exec 1", "Account Exec 2"] },
      { name: "SMB Sales", reports: ["Account Exec 3", "Account Exec 4"] },
    ],
  },
  {
    name: "Marketing",
    directors: [
      { name: "Brand", reports: ["Brand Manager", "Content Lead"] },
      { name: "Growth", reports: ["Growth Analyst", "SEO Specialist"] },
    ],
  },
  {
    name: "Operations",
    directors: [
      { name: "Finance", reports: ["Controller", "FP&A Analyst"] },
      { name: "People", reports: ["Recruiter", "HR Partner"] },
    ],
  },
];

let nextId = 0;
const nodesById = new Map();

function makeNode(label, level, branch, parentId) {
  const node = { id: nextId, label, level, branch, parentId, children: [] };
  nextId += 1;
  nodesById.set(node.id, node);
  if (parentId !== null) nodesById.get(parentId).children.push(node.id);
  return node;
}

const ceo = makeNode("CEO", 0, -1, null);
DEPARTMENTS.forEach((dept, branch) => {
  const vp = makeNode(`VP ${dept.name}`, 1, branch, ceo.id);
  dept.directors.forEach((dir) => {
    const director = makeNode(dir.name, 2, branch, vp.id);
    dir.reports.forEach((reportName) => {
      makeNode(reportName, 3, branch, director.id);
    });
  });
});

// --- Tidy tree layout: leaves get sequential x, parents average children ---
let nextLeafX = 0;
function assignX(node) {
  if (node.children.length === 0) {
    node.x = nextLeafX;
    nextLeafX += 1;
    return node.x;
  }
  const childXs = node.children.map((childId) => assignX(nodesById.get(childId)));
  node.x = childXs.reduce((sum, x) => sum + x, 0) / childXs.length;
  return node.x;
}
assignX(ceo);

const MAX_LEVEL = 3;
nodesById.forEach((node) => {
  node.y = MAX_LEVEL - node.level; // root at top, leaves at bottom
});

const allNodes = Array.from(nodesById.values());
const edges = allNodes.filter((n) => n.parentId !== null).map((n) => [n.parentId, n.id]);

const LEVEL_RADIUS = [22, 16, 12, 8];
const nodeRadius = (node) => LEVEL_RADIUS[node.level];
const nodeColor = (node) => (node.branch === -1 ? t.ink : t.palette[node.branch]);

// Padded domain around the tidy-tree coordinates.
const xMax = nextLeafX - 1;
const X_PAD = 1.1;
const Y_PAD = 0.6;
const domain = {
  xMin: -X_PAD,
  xMax: xMax + X_PAD,
  yMin: -Y_PAD,
  yMax: MAX_LEVEL + Y_PAD,
};

// --- Custom SVG layers, positioned via the chart's own scales --------------
function TreeEdges() {
  const xScale = useXScale();
  const yScale = useYScale();
  return (
    <g data-drawing-container>
      {edges.map(([parentId, childId], i) => {
        const parent = nodesById.get(parentId);
        const child = nodesById.get(childId);
        return (
          <line
            key={`edge-${i}`}
            x1={xScale(parent.x)}
            y1={yScale(parent.y)}
            x2={xScale(child.x)}
            y2={yScale(child.y)}
            stroke={nodeColor(child)}
            strokeOpacity={0.35}
            strokeWidth={1.4}
          />
        );
      })}
    </g>
  );
}

function TreeNodes() {
  const xScale = useXScale();
  const yScale = useYScale();
  return (
    <g data-drawing-container>
      {allNodes.map((node) => (
        <React.Fragment key={node.id}>
          <circle
            cx={xScale(node.x)}
            cy={yScale(node.y)}
            r={nodeRadius(node)}
            fill={nodeColor(node)}
            stroke={t.pageBg}
            strokeWidth={1.5}
          />
          {node.level <= 2 && (
            <text
              x={xScale(node.x)}
              y={yScale(node.y) - nodeRadius(node) - 8}
              textAnchor="middle"
              fontSize={node.level === 0 ? 15 : 13}
              fontWeight={node.level === 0 ? 600 : 400}
              fill={t.ink}
            >
              {node.label}
            </text>
          )}
        </React.Fragment>
      ))}
    </g>
  );
}

// --- Title + legend chrome ---------------------------------------------------
const TITLE = "network-hierarchical · javascript · muix · anyplot.ai";
const TITLE_FONT_DEFAULT = 22;
const titleFontSize =
  TITLE.length > 67 ? Math.round(TITLE_FONT_DEFAULT * (67 / TITLE.length)) : TITLE_FONT_DEFAULT;
const TITLE_H = 42;
const LEGEND_H = 34;

function Legend() {
  return (
    <div style={{ height: LEGEND_H, display: "flex", alignItems: "center", gap: "20px", flexWrap: "wrap" }}>
      {DEPARTMENTS.map((dept, i) => (
        <div key={dept.name} style={{ display: "flex", alignItems: "center", gap: "7px" }}>
          <span
            style={{
              width: "12px",
              height: "12px",
              borderRadius: "50%",
              backgroundColor: t.palette[i],
              display: "inline-block",
            }}
          />
          <span style={{ fontSize: "14px", color: t.inkSoft }}>{dept.name}</span>
        </div>
      ))}
    </div>
  );
}

// --- Chart (default-exported component — the harness mounts it) ------------
export default function Chart() {
  const { width, height } = window.ANYPLOT_SIZE;
  const chartHeight = height - TITLE_H - LEGEND_H;

  return (
    <div style={{ width, height, display: "flex", flexDirection: "column" }}>
      <div
        style={{
          height: `${TITLE_H}px`,
          lineHeight: `${TITLE_H}px`,
          fontSize: `${titleFontSize}px`,
          fontWeight: 500,
          color: t.ink,
        }}
      >
        {TITLE}
      </div>
      <Legend />
      <ChartContainer
        width={width}
        height={chartHeight}
        series={[]}
        margin={{ top: 8, bottom: 8, left: 8, right: 8 }}
        xAxis={[{ id: "x", scaleType: "linear", min: domain.xMin, max: domain.xMax }]}
        yAxis={[{ id: "y", scaleType: "linear", min: domain.yMin, max: domain.yMax }]}
        skipAnimation
      >
        <TreeEdges />
        <TreeNodes />
      </ChartContainer>
    </div>
  );
}
Runnable source as JSON, for any HTTP client: https://api.anyplot.ai/specs/network-hierarchical/muix/code. Any spec id and library id listed in llms-full.txt fit the same URL shape; every URL below is complete and callable.
{
  "spec_id": "network-hierarchical",
  "language": "javascript",
  "library": "muix",
  "page": "https://anyplot.ai/network-hierarchical/javascript/muix",
  "hub": "https://anyplot.ai/network-hierarchical",
  "code_json": "https://api.anyplot.ai/specs/network-hierarchical/muix/code",
  "spec_json": "https://api.anyplot.ai/specs/network-hierarchical",
  "render_light_png": "https://storage.googleapis.com/anyplot-images/plots/network-hierarchical/javascript/muix/plot-light.png",
  "render_dark_png": "https://storage.googleapis.com/anyplot-images/plots/network-hierarchical/javascript/muix/plot-dark.png",
  "interactive_light_html": "https://storage.googleapis.com/anyplot-images/plots/network-hierarchical/javascript/muix/plot-light.html",
  "interactive_dark_html": "https://storage.googleapis.com/anyplot-images/plots/network-hierarchical/javascript/muix/plot-dark.html",
  "quality_score": 90.0,
  "license": "MIT",
  "guide": "https://anyplot.ai/llms.txt"
}
Part of Hierarchical Network Graph with Tree Layout on anyplot.ai.