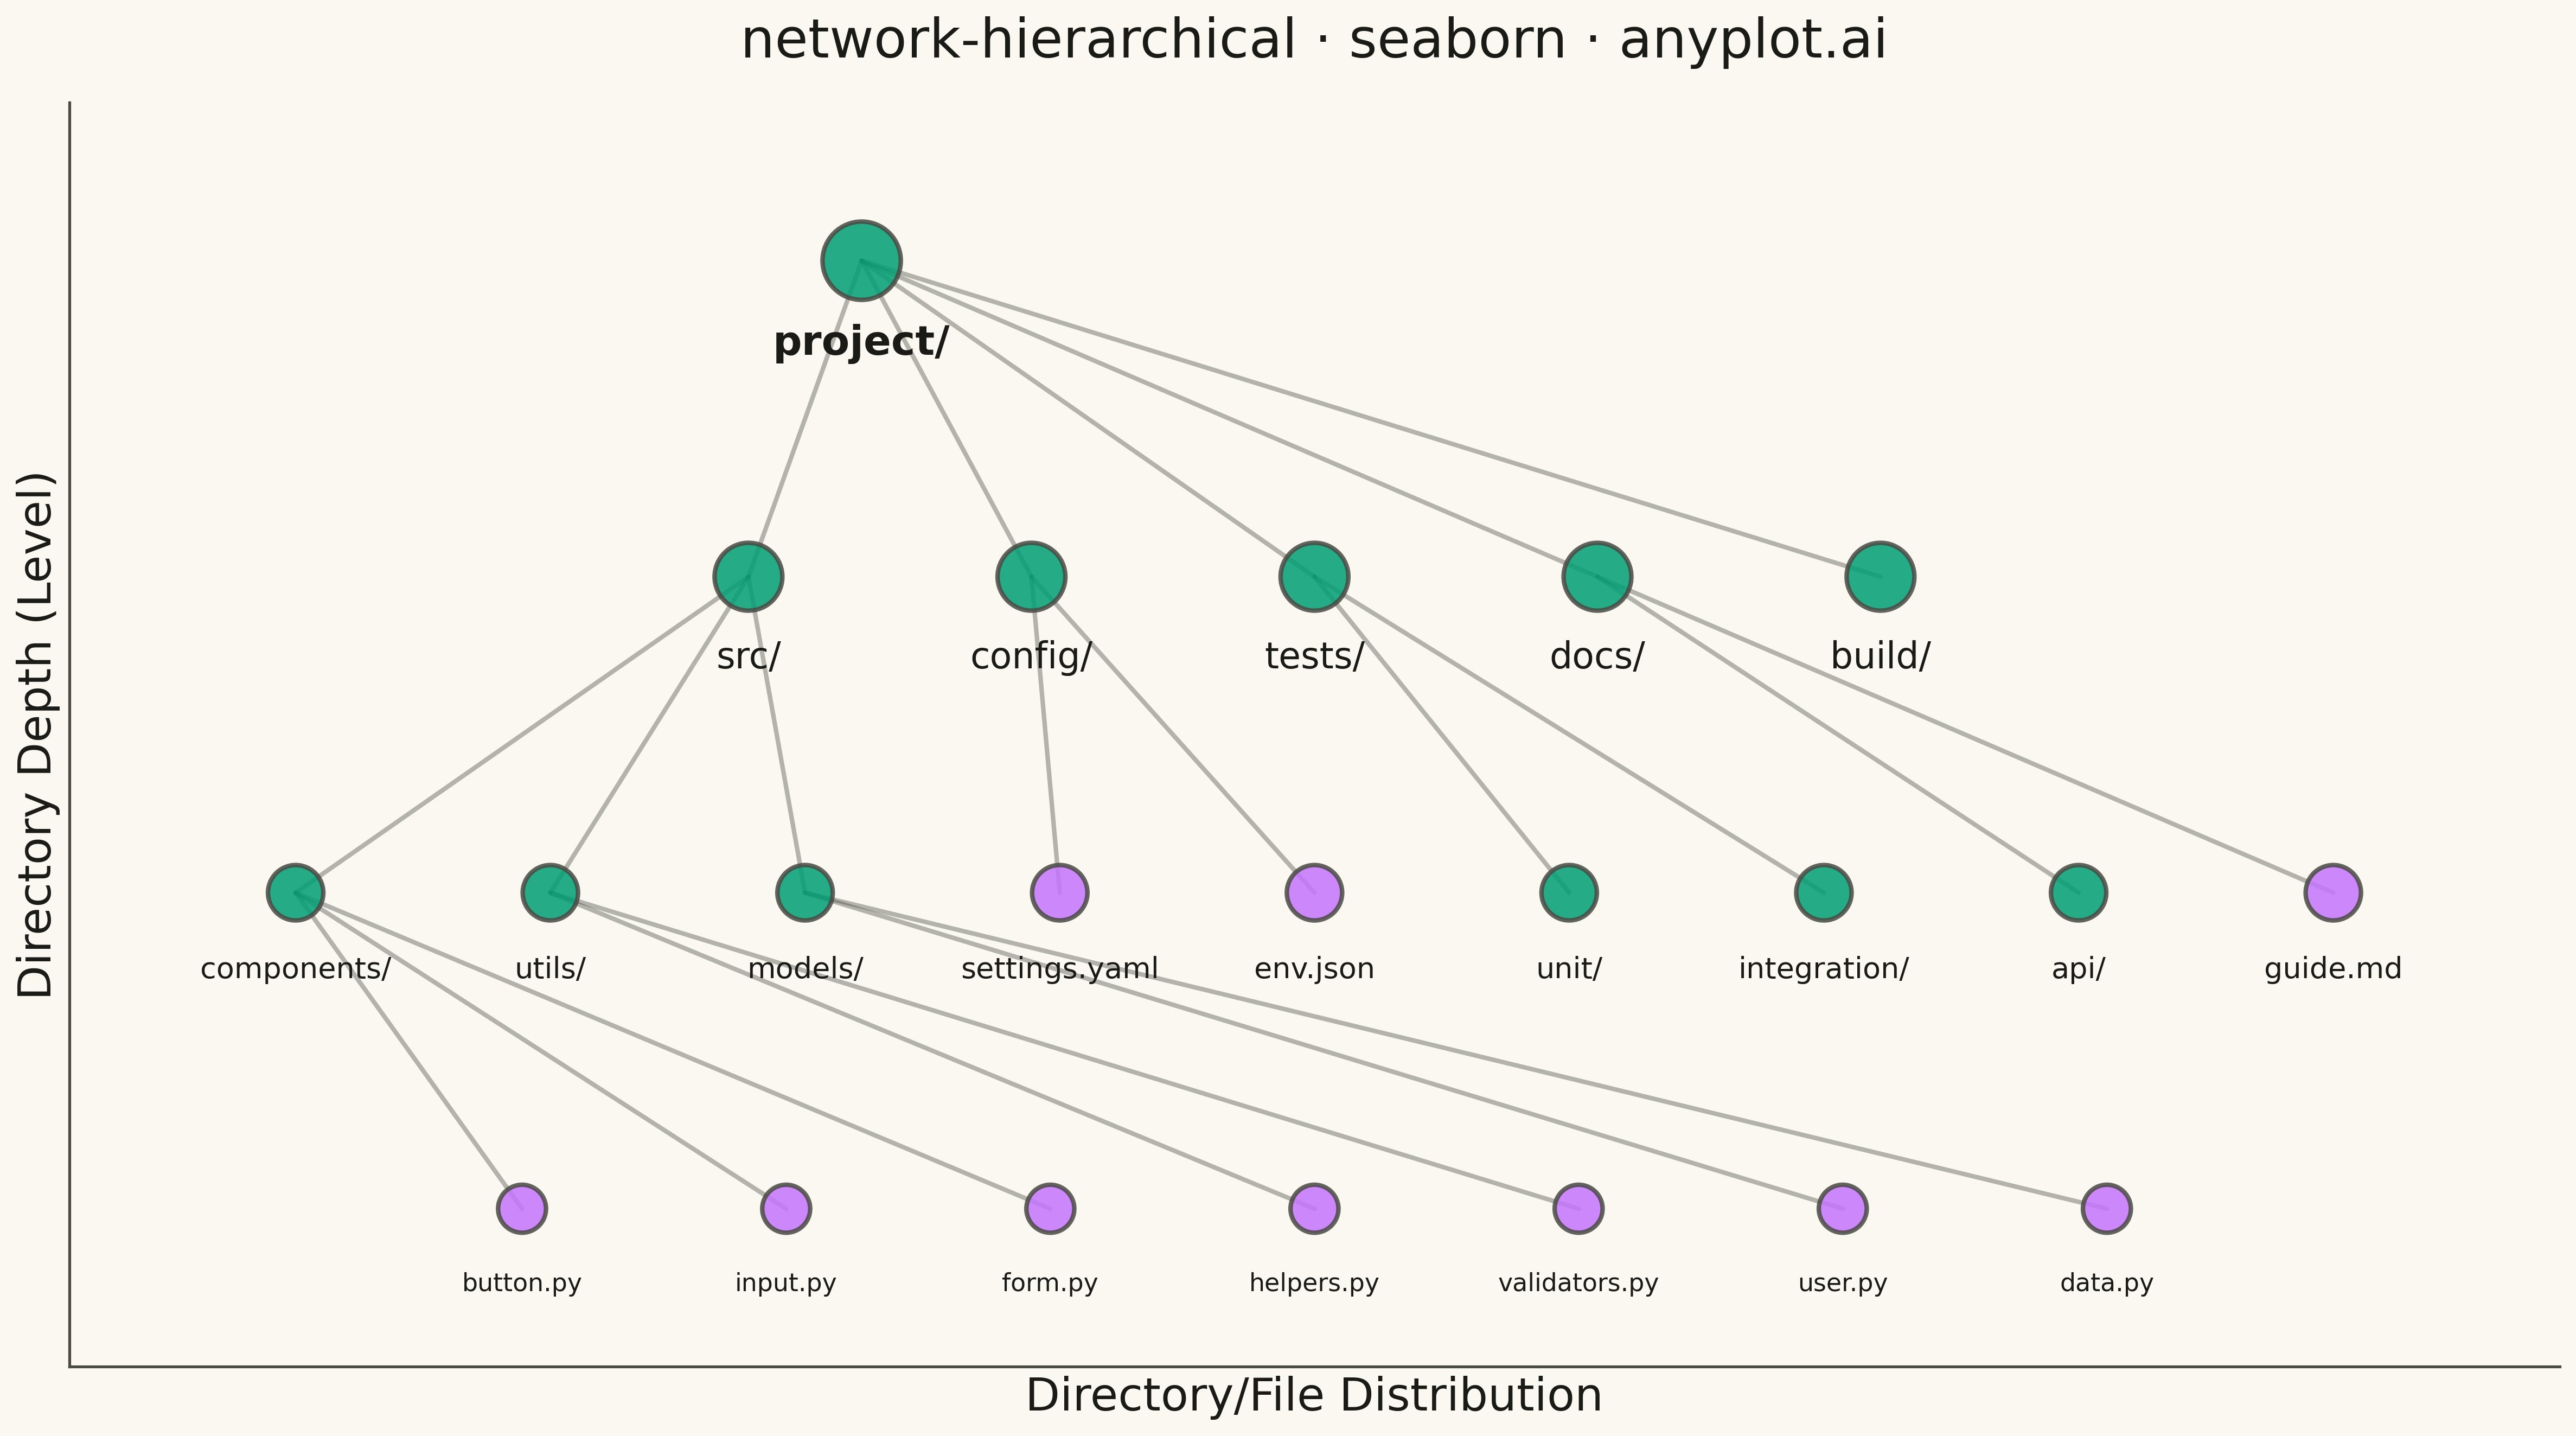
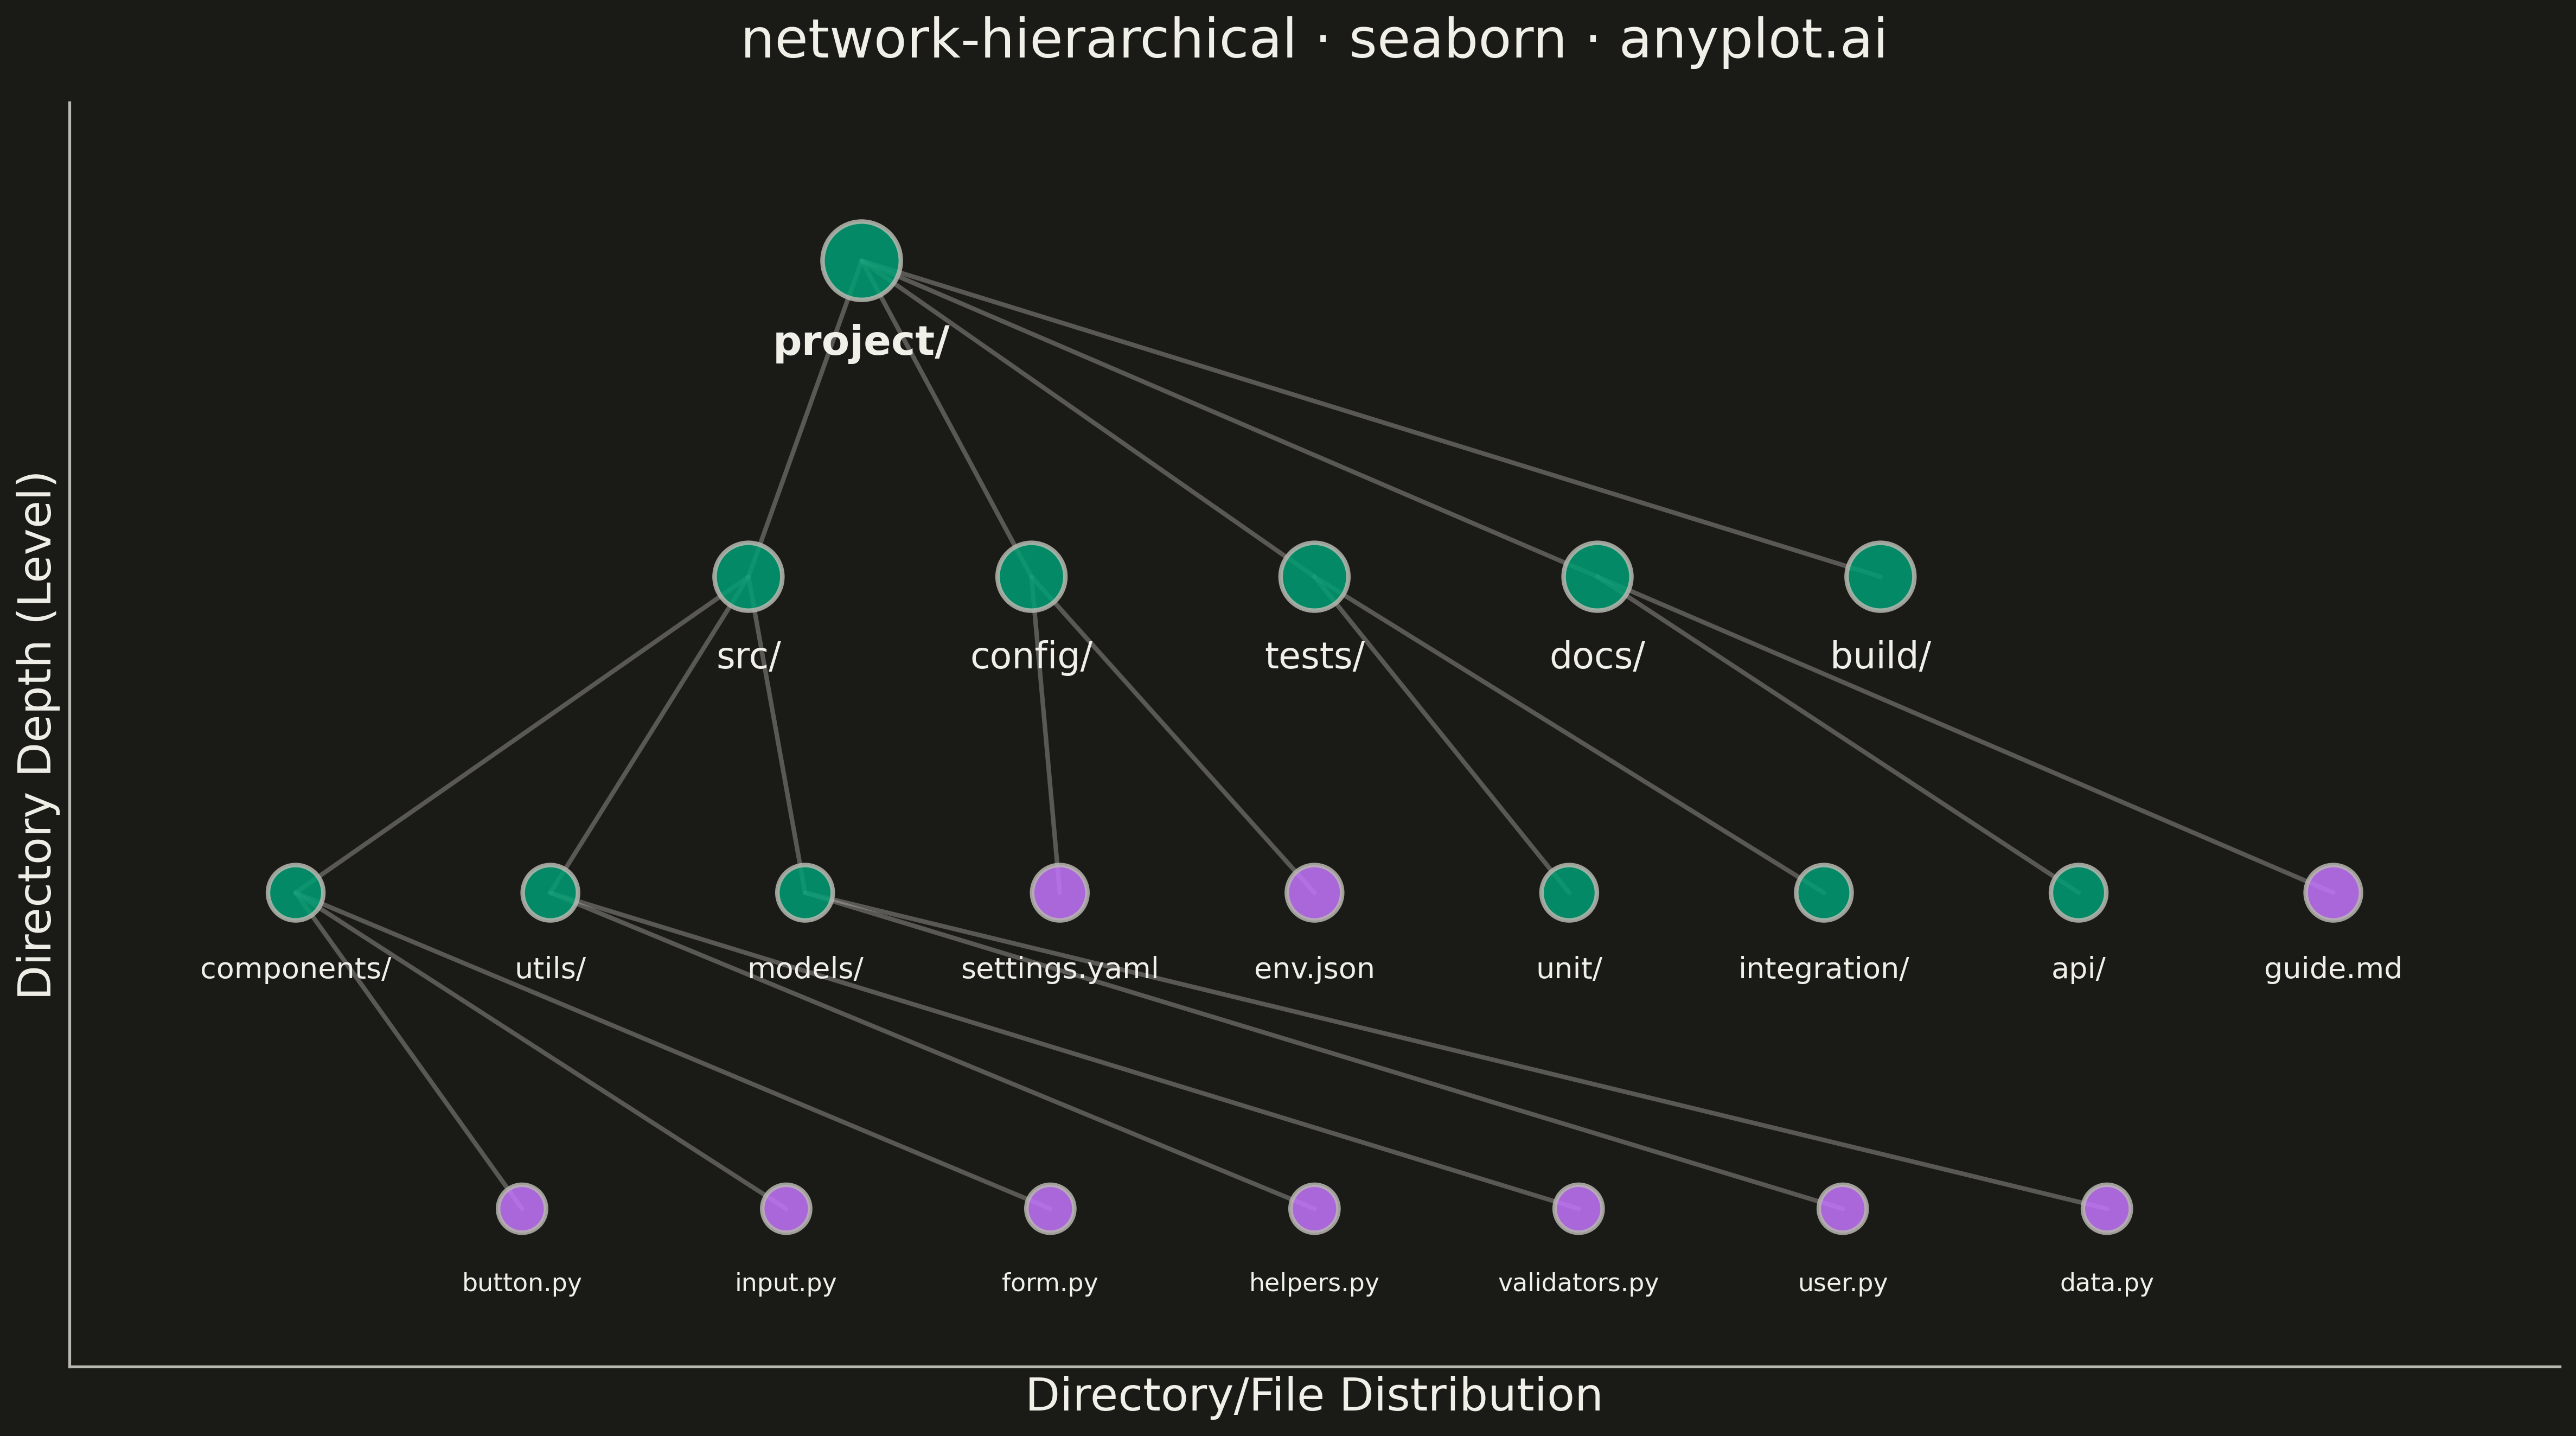
A hierarchical network graph organizes nodes in distinct levels from root to leaves, with edges showing parent-child relationships between levels. Unlike force-directed layouts that optimize for aesthetic spacing, hierarchical layouts explicitly encode tree structure by positioning nodes at fixed vertical or horizontal levels. This visualization reveals organizational depth, branching patterns, and the overall tree structure at a glance.
""" anyplot.ai
network-hierarchical: Hierarchical Network Graph with Tree Layout
Library: seaborn 0.13.2 | Python 3.13.13
Quality: 91/100 | Updated: 2026-05-17
"""

import os

import matplotlib.pyplot as plt
import numpy as np
import seaborn as sns


# Theme tokens
THEME = os.getenv("ANYPLOT_THEME", "light")
PAGE_BG = "#FAF8F1" if THEME == "light" else "#1A1A17"
ELEVATED_BG = "#FFFDF6" if THEME == "light" else "#242420"
INK = "#1A1A17" if THEME == "light" else "#F0EFE8"
INK_SOFT = "#4A4A44" if THEME == "light" else "#B8B7B0"

# Okabe-Ito palette - first series is always #009E73
IMPRINT = [
    "#009E73",  # bluish green (brand)
    "#C475FD",  # vermillion
    "#4467A3",  # blue
    "#BD8233",  # reddish purple
    "#AE3030",  # orange
]

# Apply seaborn theme
sns.set_theme(
    style="ticks",
    rc={
        "figure.facecolor": PAGE_BG,
        "axes.facecolor": PAGE_BG,
        "axes.edgecolor": INK_SOFT,
        "axes.labelcolor": INK,
        "text.color": INK,
        "xtick.color": INK_SOFT,
        "ytick.color": INK_SOFT,
    },
)

# Data: File system directory structure
# Root: /project with subdirectories for src, config, tests, docs, build
nodes = [
    # Level 0 - Root
    {"id": 0, "label": "project/", "level": 0, "type": "dir"},
    # Level 1 - Main directories
    {"id": 1, "label": "src/", "level": 1, "type": "dir"},
    {"id": 2, "label": "config/", "level": 1, "type": "dir"},
    {"id": 3, "label": "tests/", "level": 1, "type": "dir"},
    {"id": 4, "label": "docs/", "level": 1, "type": "dir"},
    {"id": 5, "label": "build/", "level": 1, "type": "dir"},
    # Level 2 - Source subdirectories
    {"id": 6, "label": "components/", "level": 2, "type": "dir"},
    {"id": 7, "label": "utils/", "level": 2, "type": "dir"},
    {"id": 8, "label": "models/", "level": 2, "type": "dir"},
    # Level 2 - Config files
    {"id": 9, "label": "settings.yaml", "level": 2, "type": "file"},
    {"id": 10, "label": "env.json", "level": 2, "type": "file"},
    # Level 2 - Test subdirectories
    {"id": 11, "label": "unit/", "level": 2, "type": "dir"},
    {"id": 12, "label": "integration/", "level": 2, "type": "dir"},
    # Level 2 - Docs files
    {"id": 13, "label": "api/", "level": 2, "type": "dir"},
    {"id": 14, "label": "guide.md", "level": 2, "type": "file"},
    # Level 3 - Component files
    {"id": 15, "label": "button.py", "level": 3, "type": "file"},
    {"id": 16, "label": "input.py", "level": 3, "type": "file"},
    {"id": 17, "label": "form.py", "level": 3, "type": "file"},
    # Level 3 - Utility files
    {"id": 18, "label": "helpers.py", "level": 3, "type": "file"},
    {"id": 19, "label": "validators.py", "level": 3, "type": "file"},
    # Level 3 - Model files
    {"id": 20, "label": "user.py", "level": 3, "type": "file"},
    {"id": 21, "label": "data.py", "level": 3, "type": "file"},
]

edges = [
    # Root to Level 1
    (0, 1),
    (0, 2),
    (0, 3),
    (0, 4),
    (0, 5),
    # src to subdirectories
    (1, 6),
    (1, 7),
    (1, 8),
    # config to files
    (2, 9),
    (2, 10),
    # tests to subdirectories
    (3, 11),
    (3, 12),
    # docs to contents
    (4, 13),
    (4, 14),
    # components to files
    (6, 15),
    (6, 16),
    (6, 17),
    # utils to files
    (7, 18),
    (7, 19),
    # models to files
    (8, 20),
    (8, 21),
]

# Compute hierarchical layout positions
levels = {}
for node in nodes:
    lvl = node["level"]
    if lvl not in levels:
        levels[lvl] = []
    levels[lvl].append(node)

# Calculate positions: levels spread vertically, nodes at each level spread horizontally
positions = {}
y_spacing = 2.0
for lvl in sorted(levels.keys()):
    nodes_at_level = levels[lvl]
    n = len(nodes_at_level)
    spread = max(n * 1.5, 6)
    x_positions = np.linspace(-spread / 2, spread / 2, n)
    y_pos = -lvl * y_spacing
    for i, node in enumerate(nodes_at_level):
        positions[node["id"]] = (x_positions[i], y_pos)

# Prepare data for plotting
node_x = [positions[n["id"]][0] for n in nodes]
node_y = [positions[n["id"]][1] for n in nodes]
node_labels = [n["label"] for n in nodes]
node_levels = [n["level"] for n in nodes]
node_types = [n["type"] for n in nodes]

# Color mapping: directories vs files
colors_by_type = {
    "dir": IMPRINT[0],  # Brand green for directories
    "file": IMPRINT[1],  # Vermillion for files
}
node_colors = [colors_by_type[nt] for nt in node_types]

# Node sizes based on level
size_map = {0: 1200, 1: 900, 2: 600, 3: 450}
node_sizes = [size_map[lvl] for lvl in node_levels]

# Create figure
fig, ax = plt.subplots(figsize=(16, 9), facecolor=PAGE_BG)
ax.set_facecolor(PAGE_BG)

# Draw edges first (underneath nodes)
for parent, child in edges:
    x0, y0 = positions[parent]
    x1, y1 = positions[child]
    ax.plot([x0, x1], [y0, y1], color=INK_SOFT, linewidth=2.0, alpha=0.4, zorder=1)

# Draw all nodes as a single scatter plot with colors
ax.scatter(node_x, node_y, s=node_sizes, c=node_colors, edgecolors=INK_SOFT, linewidth=2.0, alpha=0.85, zorder=2)

# Add node labels
for node in nodes:
    x, y = positions[node["id"]]
    lvl = node["level"]
    fontsize = 18 if lvl == 0 else 16 if lvl == 1 else 13 if lvl == 2 else 11
    fontweight = "bold" if lvl == 0 else "normal"
    ax.annotate(
        node["label"],
        (x, y),
        textcoords="offset points",
        xytext=(0, -28),
        ha="center",
        va="top",
        fontsize=fontsize,
        fontweight=fontweight,
        color=INK,
    )

# Style the plot
ax.set_title("network-hierarchical · seaborn · anyplot.ai", fontsize=24, fontweight="medium", color=INK, pad=20)

# Set axis properties
ax.set_xlabel("Directory/File Distribution", fontsize=20, color=INK)
ax.set_ylabel("Directory Depth (Level)", fontsize=20, color=INK)
ax.set_xticks([])
ax.set_yticks([])
ax.tick_params(axis="both", labelsize=16, colors=INK_SOFT)

# Set axis limits with padding
x_padding = 1.5
y_padding = 1.0
ax.set_xlim(min(node_x) - x_padding, max(node_x) + x_padding)
ax.set_ylim(min(node_y) - y_padding, max(node_y) + y_padding)

# Remove spines for cleaner network visualization
ax.spines["top"].set_visible(False)
ax.spines["right"].set_visible(False)
ax.spines["left"].set_color(INK_SOFT)
ax.spines["bottom"].set_color(INK_SOFT)

# Disable grid for network visualization
ax.grid(False)

plt.tight_layout()
plt.savefig(f"plot-{THEME}.png", dpi=300, bbox_inches="tight", facecolor=PAGE_BG)
Runnable source as JSON, for any HTTP client: https://api.anyplot.ai/specs/network-hierarchical/seaborn/code. Any spec id and library id listed in llms-full.txt fit the same URL shape; every URL below is complete and callable.
{
  "spec_id": "network-hierarchical",
  "language": "python",
  "library": "seaborn",
  "page": "https://anyplot.ai/network-hierarchical/python/seaborn",
  "hub": "https://anyplot.ai/network-hierarchical",
  "code_json": "https://api.anyplot.ai/specs/network-hierarchical/seaborn/code",
  "spec_json": "https://api.anyplot.ai/specs/network-hierarchical",
  "render_light_png": "https://storage.googleapis.com/anyplot-images/plots/network-hierarchical/python/seaborn/plot-light.png",
  "render_dark_png": "https://storage.googleapis.com/anyplot-images/plots/network-hierarchical/python/seaborn/plot-dark.png",
  "quality_score": 91.0,
  "license": "MIT",
  "guide": "https://anyplot.ai/llms.txt"
}
Part of Hierarchical Network Graph with Tree Layout on anyplot.ai.