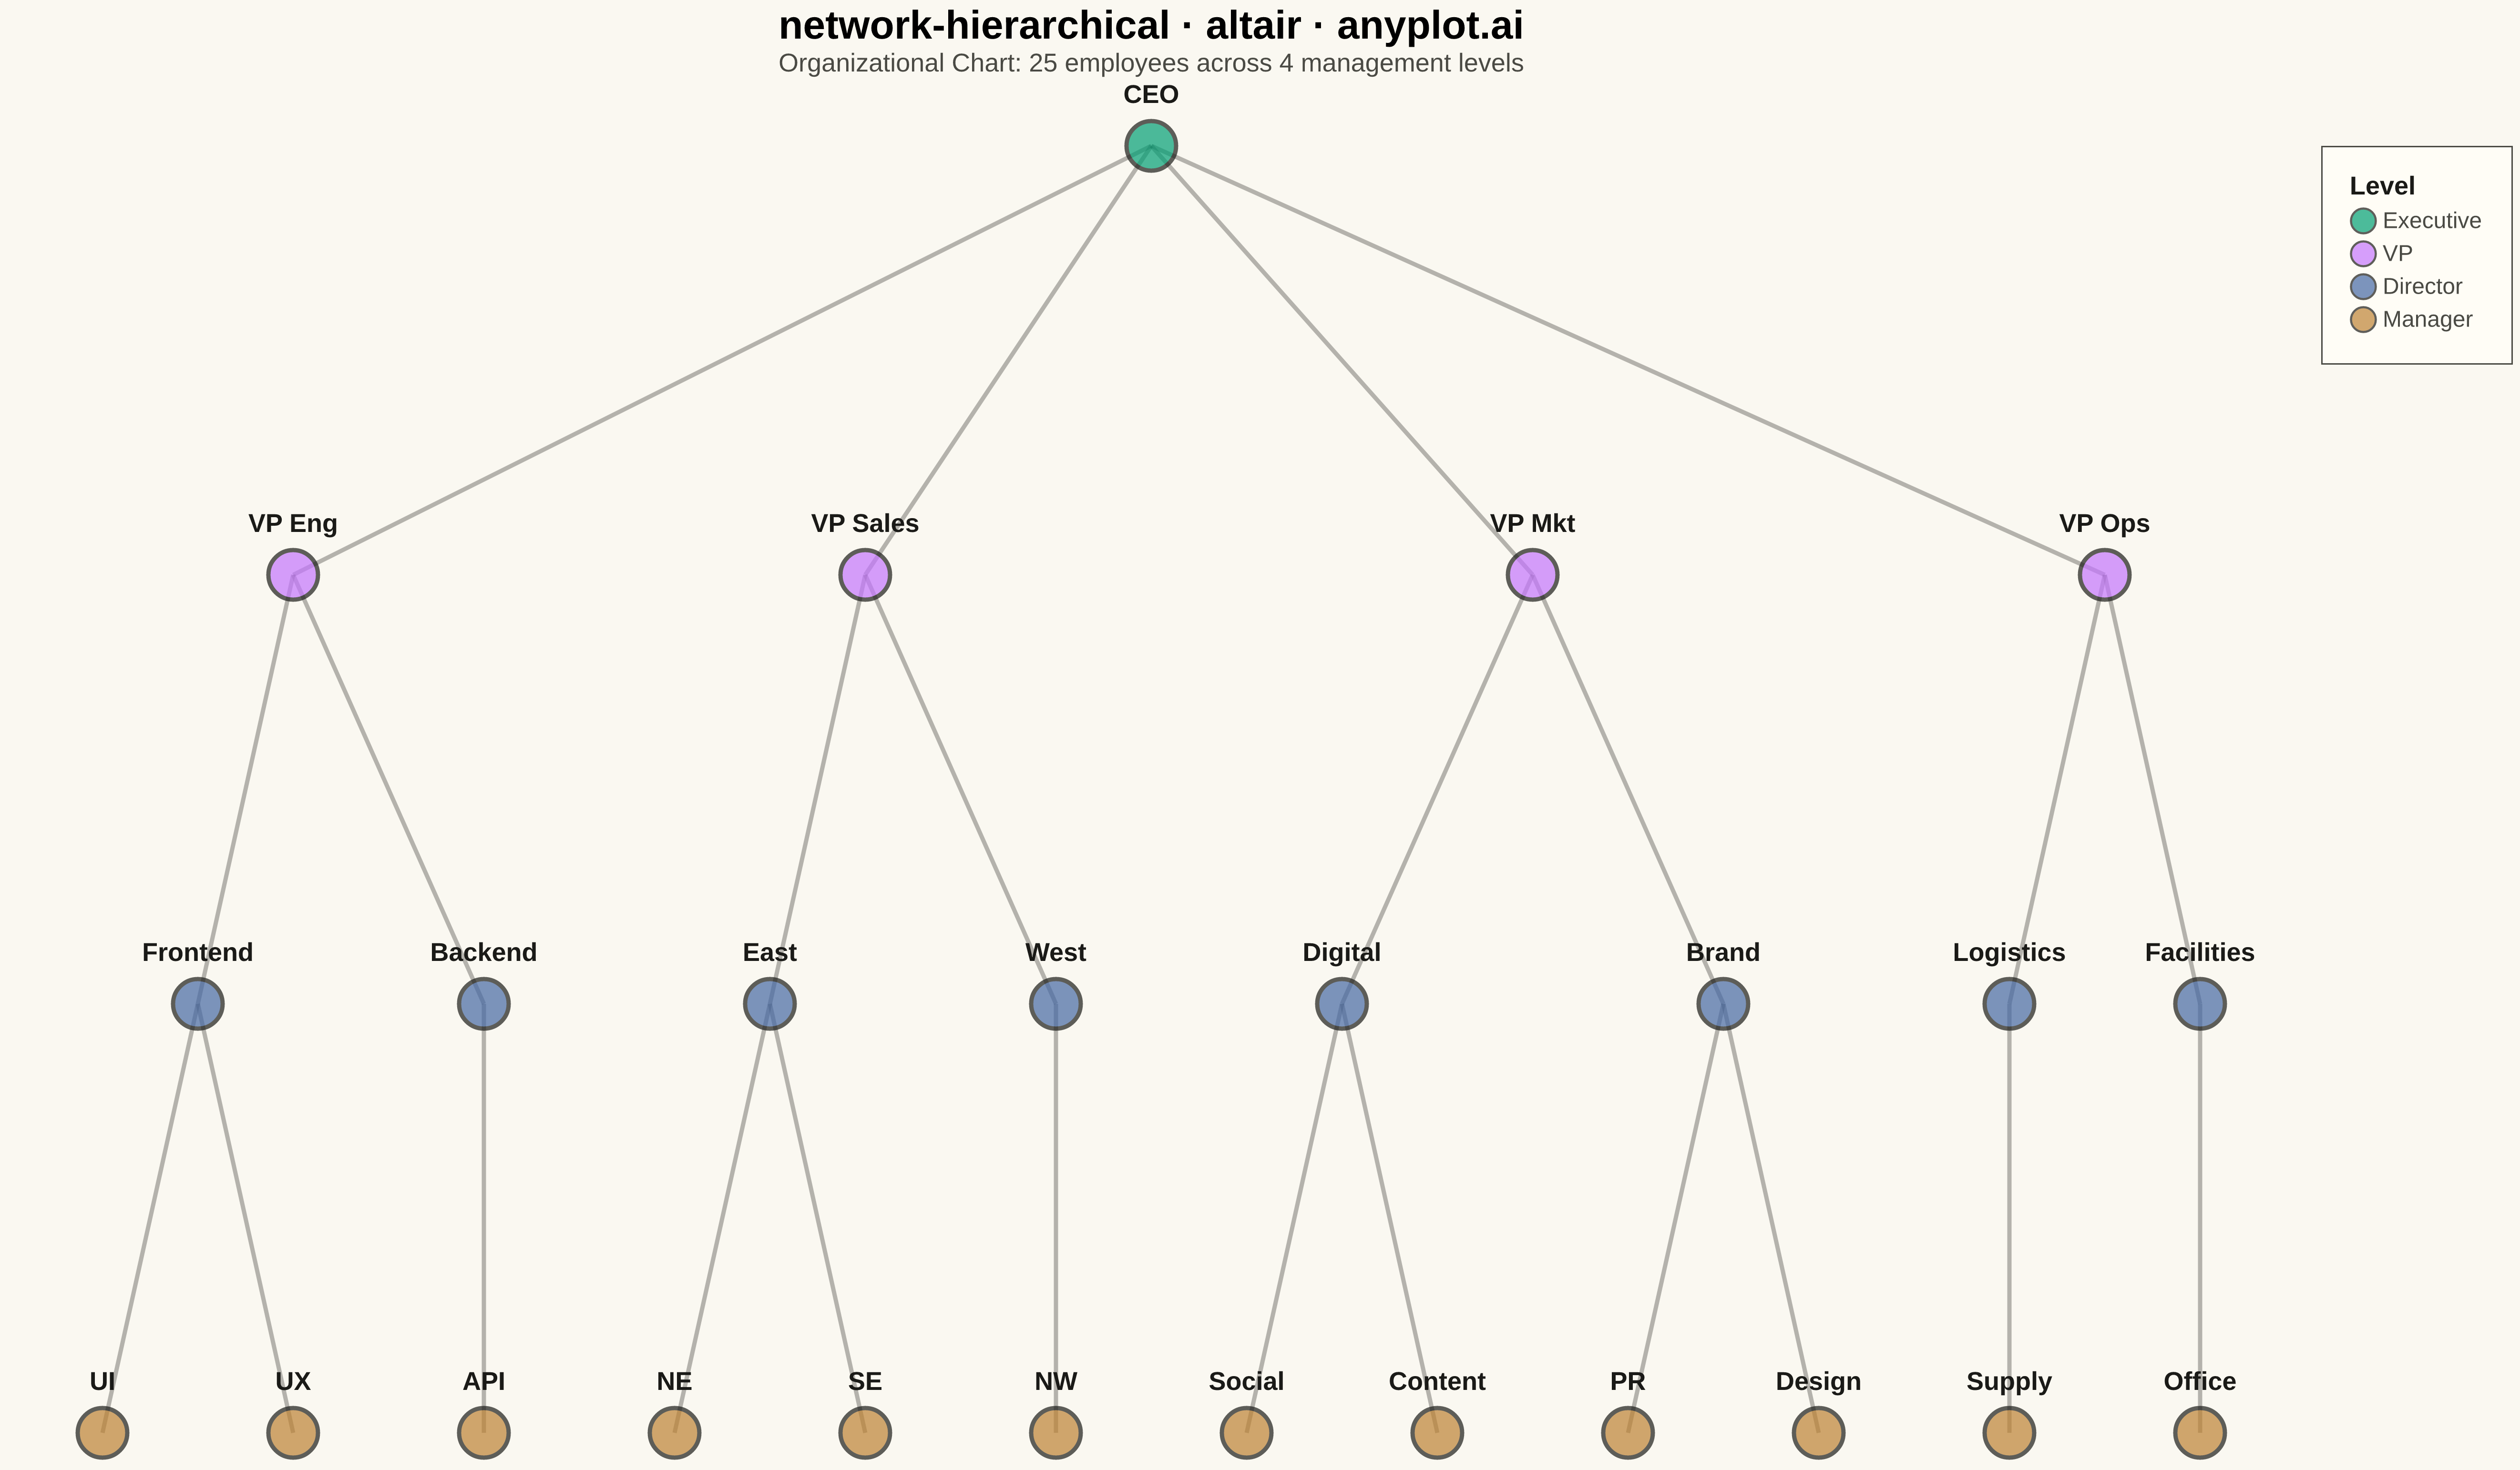
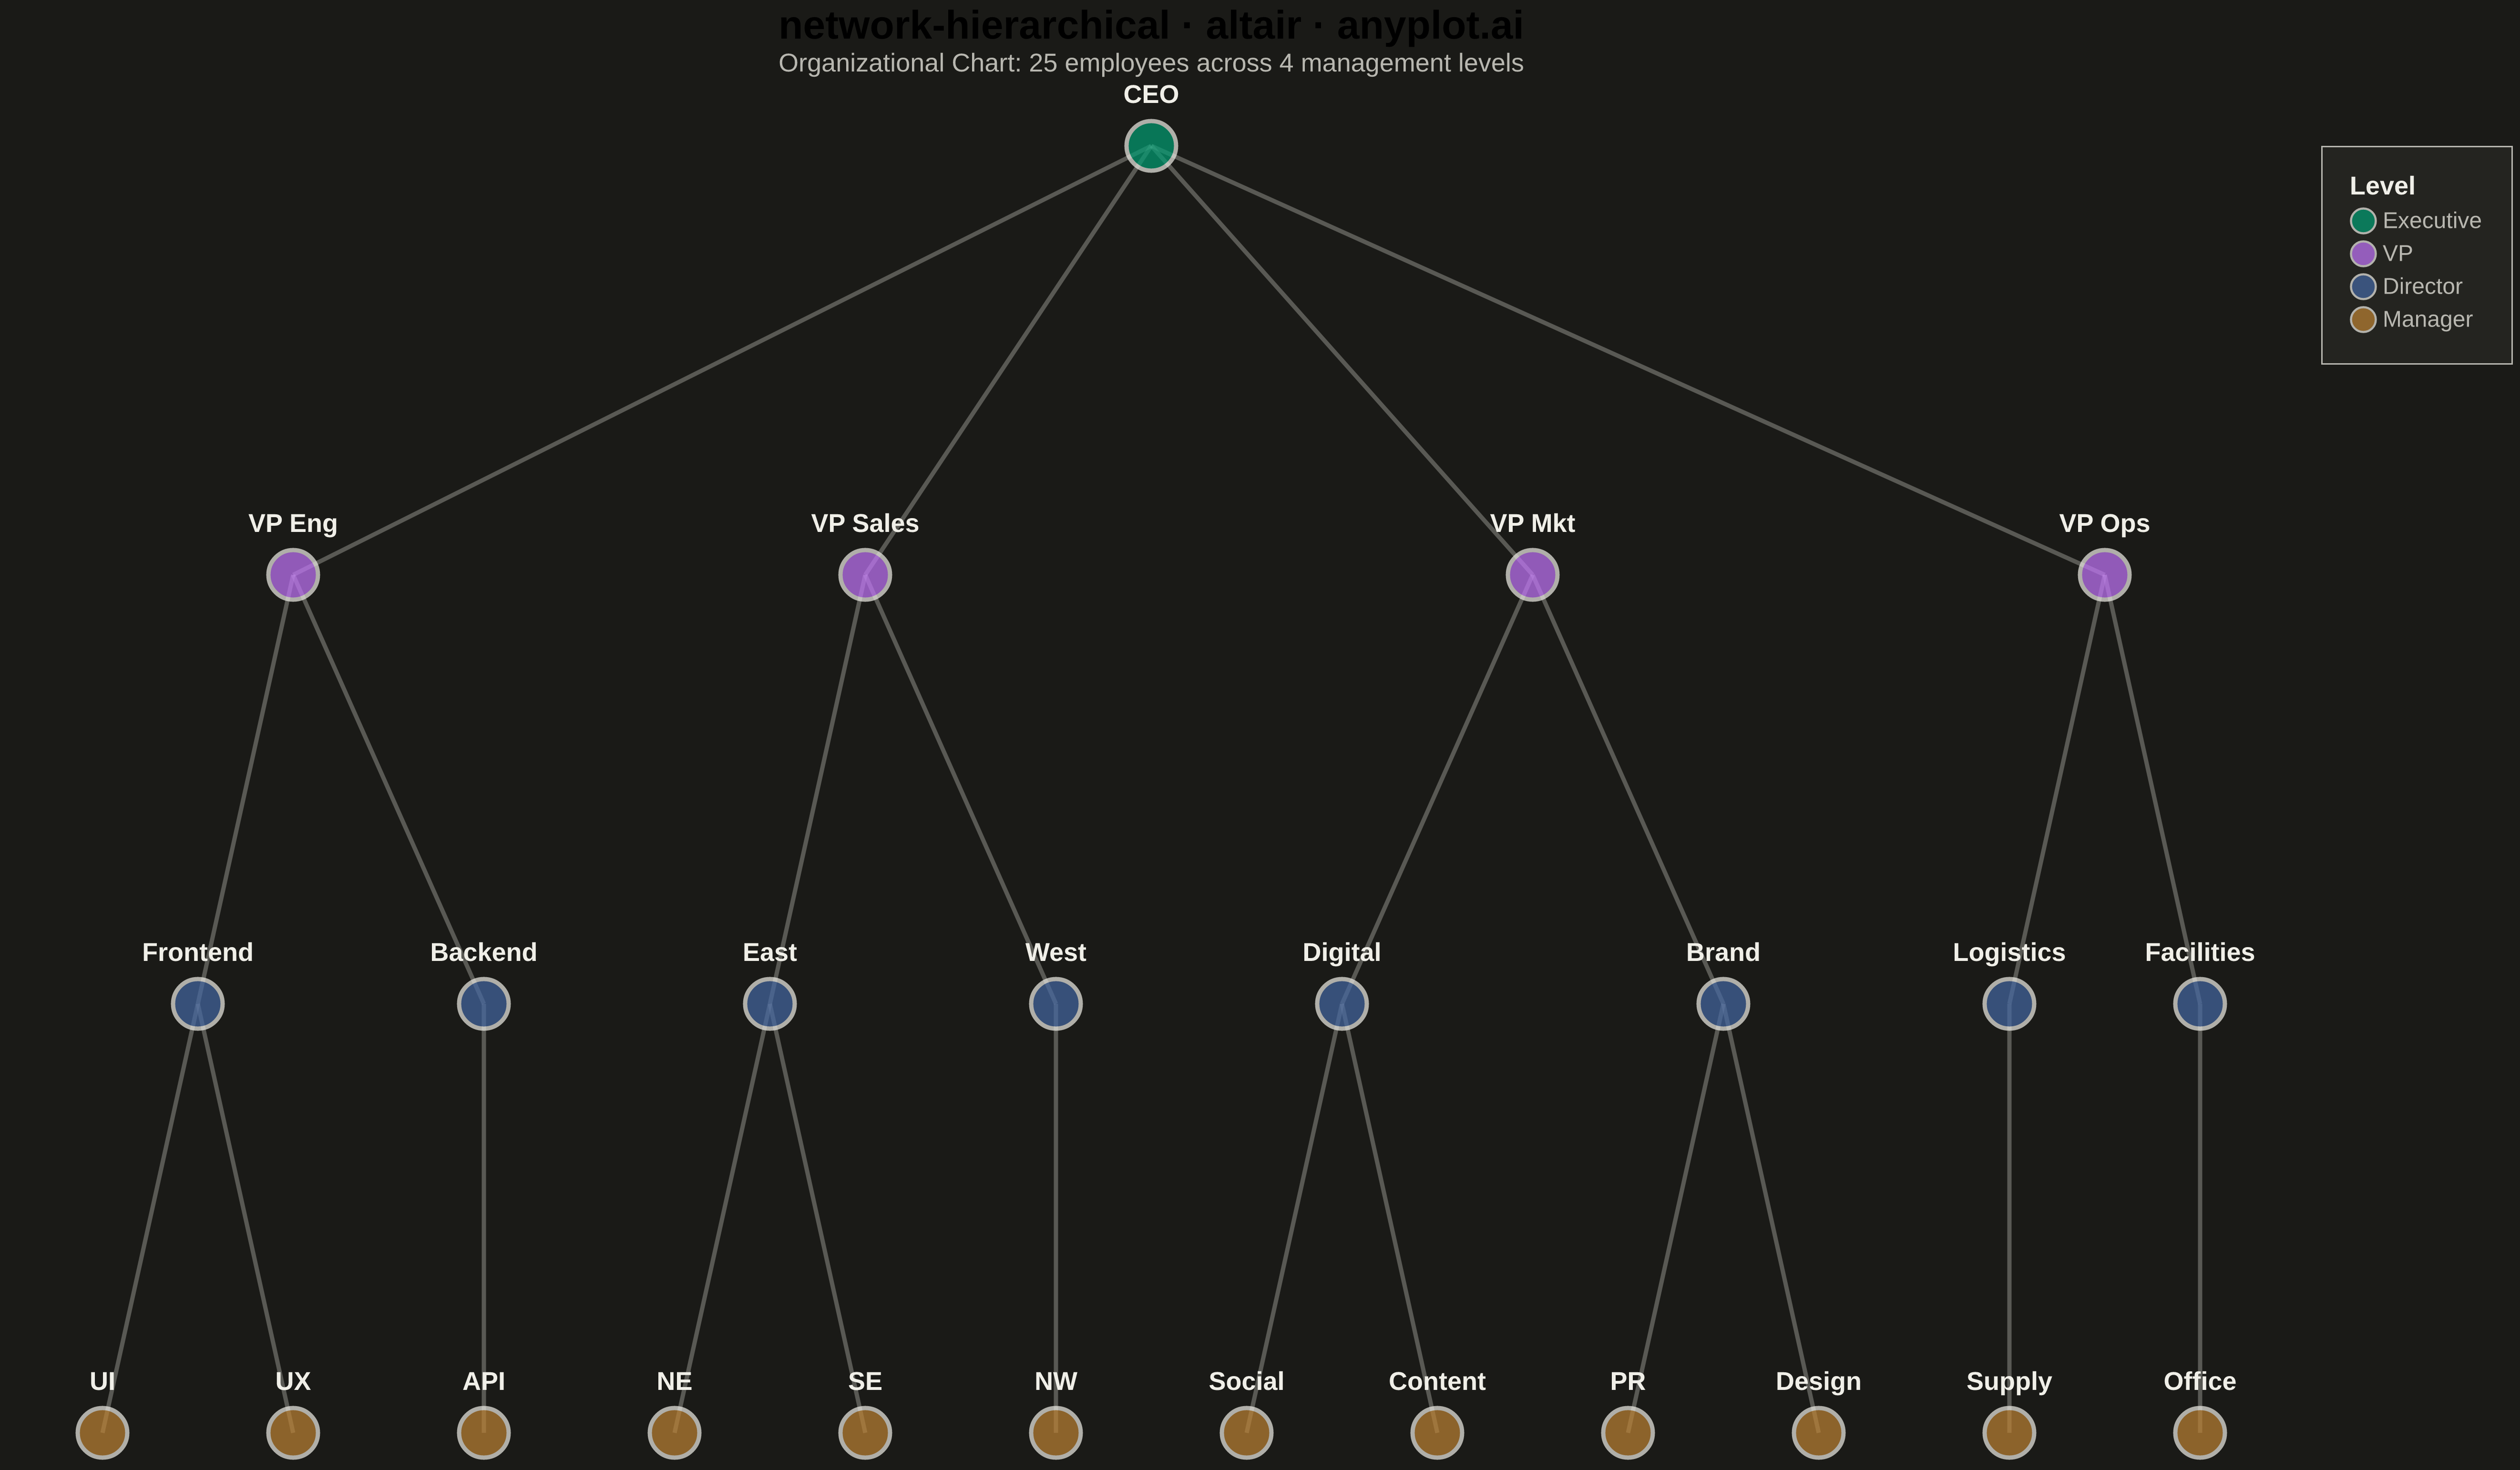
A hierarchical network graph organizes nodes in distinct levels from root to leaves, with edges showing parent-child relationships between levels. Unlike force-directed layouts that optimize for aesthetic spacing, hierarchical layouts explicitly encode tree structure by positioning nodes at fixed vertical or horizontal levels. This visualization reveals organizational depth, branching patterns, and the overall tree structure at a glance.
""" anyplot.ai
network-hierarchical: Hierarchical Network Graph with Tree Layout
Library: altair 6.1.0 | Python 3.13.13
Quality: 94/100 | Updated: 2026-05-17
"""

import os

import altair as alt
import numpy as np
import pandas as pd


# Theme tokens
THEME = os.getenv("ANYPLOT_THEME", "light")
PAGE_BG = "#FAF8F1" if THEME == "light" else "#1A1A17"
ELEVATED_BG = "#FFFDF6" if THEME == "light" else "#242420"
INK = "#1A1A17" if THEME == "light" else "#F0EFE8"
INK_SOFT = "#4A4A44" if THEME == "light" else "#B8B7B0"

# Okabe-Ito palette for levels
LEVEL_COLORS = ["#009E73", "#C475FD", "#4467A3", "#BD8233"]

# Data - Organizational chart with 25 employees across 4 levels
np.random.seed(42)

# Define hierarchical structure: CEO -> VPs -> Directors -> Managers
nodes = [
    # Level 0 - CEO
    {"id": 0, "label": "CEO", "level": 0, "parent": None},
    # Level 1 - VPs (4 reports)
    {"id": 1, "label": "VP Eng", "level": 1, "parent": 0},
    {"id": 2, "label": "VP Sales", "level": 1, "parent": 0},
    {"id": 3, "label": "VP Mkt", "level": 1, "parent": 0},
    {"id": 4, "label": "VP Ops", "level": 1, "parent": 0},
    # Level 2 - Directors (8 total, 2 per VP)
    {"id": 5, "label": "Frontend", "level": 2, "parent": 1},
    {"id": 6, "label": "Backend", "level": 2, "parent": 1},
    {"id": 7, "label": "East", "level": 2, "parent": 2},
    {"id": 8, "label": "West", "level": 2, "parent": 2},
    {"id": 9, "label": "Digital", "level": 2, "parent": 3},
    {"id": 10, "label": "Brand", "level": 2, "parent": 3},
    {"id": 11, "label": "Logistics", "level": 2, "parent": 4},
    {"id": 12, "label": "Facilities", "level": 2, "parent": 4},
    # Level 3 - Managers/Team Leads (12 total)
    {"id": 13, "label": "UI", "level": 3, "parent": 5},
    {"id": 14, "label": "UX", "level": 3, "parent": 5},
    {"id": 15, "label": "API", "level": 3, "parent": 6},
    {"id": 16, "label": "NE", "level": 3, "parent": 7},
    {"id": 17, "label": "SE", "level": 3, "parent": 7},
    {"id": 18, "label": "NW", "level": 3, "parent": 8},
    {"id": 19, "label": "Social", "level": 3, "parent": 9},
    {"id": 20, "label": "Content", "level": 3, "parent": 9},
    {"id": 21, "label": "PR", "level": 3, "parent": 10},
    {"id": 22, "label": "Design", "level": 3, "parent": 10},
    {"id": 23, "label": "Supply", "level": 3, "parent": 11},
    {"id": 24, "label": "Office", "level": 3, "parent": 12},
]

# Build children map
children = {n["id"]: [] for n in nodes}
for n in nodes:
    if n["parent"] is not None:
        children[n["parent"]].append(n["id"])

# Compute subtree widths iteratively (bottom-up)
subtree_width = {}
for level in [3, 2, 1, 0]:
    for n in nodes:
        if n["level"] == level:
            nid = n["id"]
            if not children[nid]:
                subtree_width[nid] = 1
            else:
                subtree_width[nid] = sum(subtree_width[c] for c in children[nid])

# Assign positions using BFS (level by level)
node_positions = {}
# Start with root
node_positions[0] = (subtree_width[0] / 2, 0)
queue = [0]
ranges = {0: (0, subtree_width[0])}

while queue:
    nid = queue.pop(0)
    x_start, x_end = ranges[nid]
    x = (x_start + x_end) / 2
    level = next(n["level"] for n in nodes if n["id"] == nid)
    y = -level  # Negative so root is at top
    node_positions[nid] = (x, y)

    kids = children[nid]
    if kids:
        total_w = sum(subtree_width[c] for c in kids)
        current_x = x_start
        for child in kids:
            child_w = subtree_width[child]
            child_end = current_x + (x_end - x_start) * child_w / total_w
            ranges[child] = (current_x, child_end)
            queue.append(child)
            current_x = child_end

# Create nodes DataFrame with positions
nodes_df = pd.DataFrame(nodes)
nodes_df["x"] = nodes_df["id"].map(lambda i: node_positions[i][0])
nodes_df["y"] = nodes_df["id"].map(lambda i: node_positions[i][1])

# Create edges DataFrame with line segments (two points per edge for mark_line)
edges_data = []
edge_id = 0
for n in nodes:
    if n["parent"] is not None:
        parent_id = n["parent"]
        child_id = n["id"]
        # Each edge has two points: parent and child
        edges_data.append({"edge_id": edge_id, "x": node_positions[parent_id][0], "y": node_positions[parent_id][1]})
        edges_data.append({"edge_id": edge_id, "x": node_positions[child_id][0], "y": node_positions[child_id][1]})
        edge_id += 1
edges_df = pd.DataFrame(edges_data)

# Create edge layer - lines connecting nodes using mark_line with detail encoding
edge_layer = (
    alt.Chart(edges_df)
    .mark_line(strokeWidth=3, opacity=0.4, color=INK_SOFT)
    .encode(x=alt.X("x:Q", axis=None), y=alt.Y("y:Q", axis=None), detail="edge_id:N")
)

# Create node layer - circles for each employee
node_layer = (
    alt.Chart(nodes_df)
    .mark_circle(size=1200, stroke=INK, strokeWidth=3)
    .encode(
        x=alt.X("x:Q", axis=None),
        y=alt.Y("y:Q", axis=None),
        color=alt.Color(
            "level:N",
            scale=alt.Scale(domain=[0, 1, 2, 3], range=LEVEL_COLORS),
            legend=alt.Legend(
                title="Level",
                labelFontSize=16,
                titleFontSize=18,
                symbolSize=300,
                labelExpr="datum.value == 0 ? 'Executive' : datum.value == 1 ? 'VP' : datum.value == 2 ? 'Director' : 'Manager'",
            ),
        ),
        tooltip=["label:N", "level:O"],
    )
)

# Create label layer - text labels for nodes (adjusted vertical spacing to prevent overlap)
label_layer = (
    alt.Chart(nodes_df)
    .mark_text(dy=-35, fontSize=18, fontWeight="bold")
    .encode(x=alt.X("x:Q"), y=alt.Y("y:Q"), text="label:N", color=alt.value(INK))
)

# Combine layers
chart = (
    alt.layer(edge_layer, node_layer, label_layer)
    .properties(
        width=1600,
        height=900,
        title=alt.Title(
            "network-hierarchical · altair · anyplot.ai",
            fontSize=28,
            anchor="middle",
            subtitle="Organizational Chart: 25 employees across 4 management levels",
            subtitleFontSize=18,
            subtitleColor=INK_SOFT,
        ),
        background=PAGE_BG,
    )
    .configure_view(strokeWidth=0, fill=PAGE_BG)
    .configure_legend(
        orient="right", padding=20, fillColor=ELEVATED_BG, strokeColor=INK_SOFT, labelColor=INK_SOFT, titleColor=INK
    )
)

# Save as PNG and HTML
chart.save(f"plot-{THEME}.png", scale_factor=3.0)
chart.save(f"plot-{THEME}.html")
Runnable source as JSON, for any HTTP client: https://api.anyplot.ai/specs/network-hierarchical/altair/code. Any spec id and library id listed in llms-full.txt fit the same URL shape; every URL below is complete and callable.
{
  "spec_id": "network-hierarchical",
  "language": "python",
  "library": "altair",
  "page": "https://anyplot.ai/network-hierarchical/python/altair",
  "hub": "https://anyplot.ai/network-hierarchical",
  "code_json": "https://api.anyplot.ai/specs/network-hierarchical/altair/code",
  "spec_json": "https://api.anyplot.ai/specs/network-hierarchical",
  "render_light_png": "https://storage.googleapis.com/anyplot-images/plots/network-hierarchical/python/altair/plot-light.png",
  "render_dark_png": "https://storage.googleapis.com/anyplot-images/plots/network-hierarchical/python/altair/plot-dark.png",
  "interactive_light_html": "https://storage.googleapis.com/anyplot-images/plots/network-hierarchical/python/altair/plot-light.html",
  "interactive_dark_html": "https://storage.googleapis.com/anyplot-images/plots/network-hierarchical/python/altair/plot-dark.html",
  "quality_score": 94.0,
  "license": "MIT",
  "guide": "https://anyplot.ai/llms.txt"
}
Part of Hierarchical Network Graph with Tree Layout on anyplot.ai.