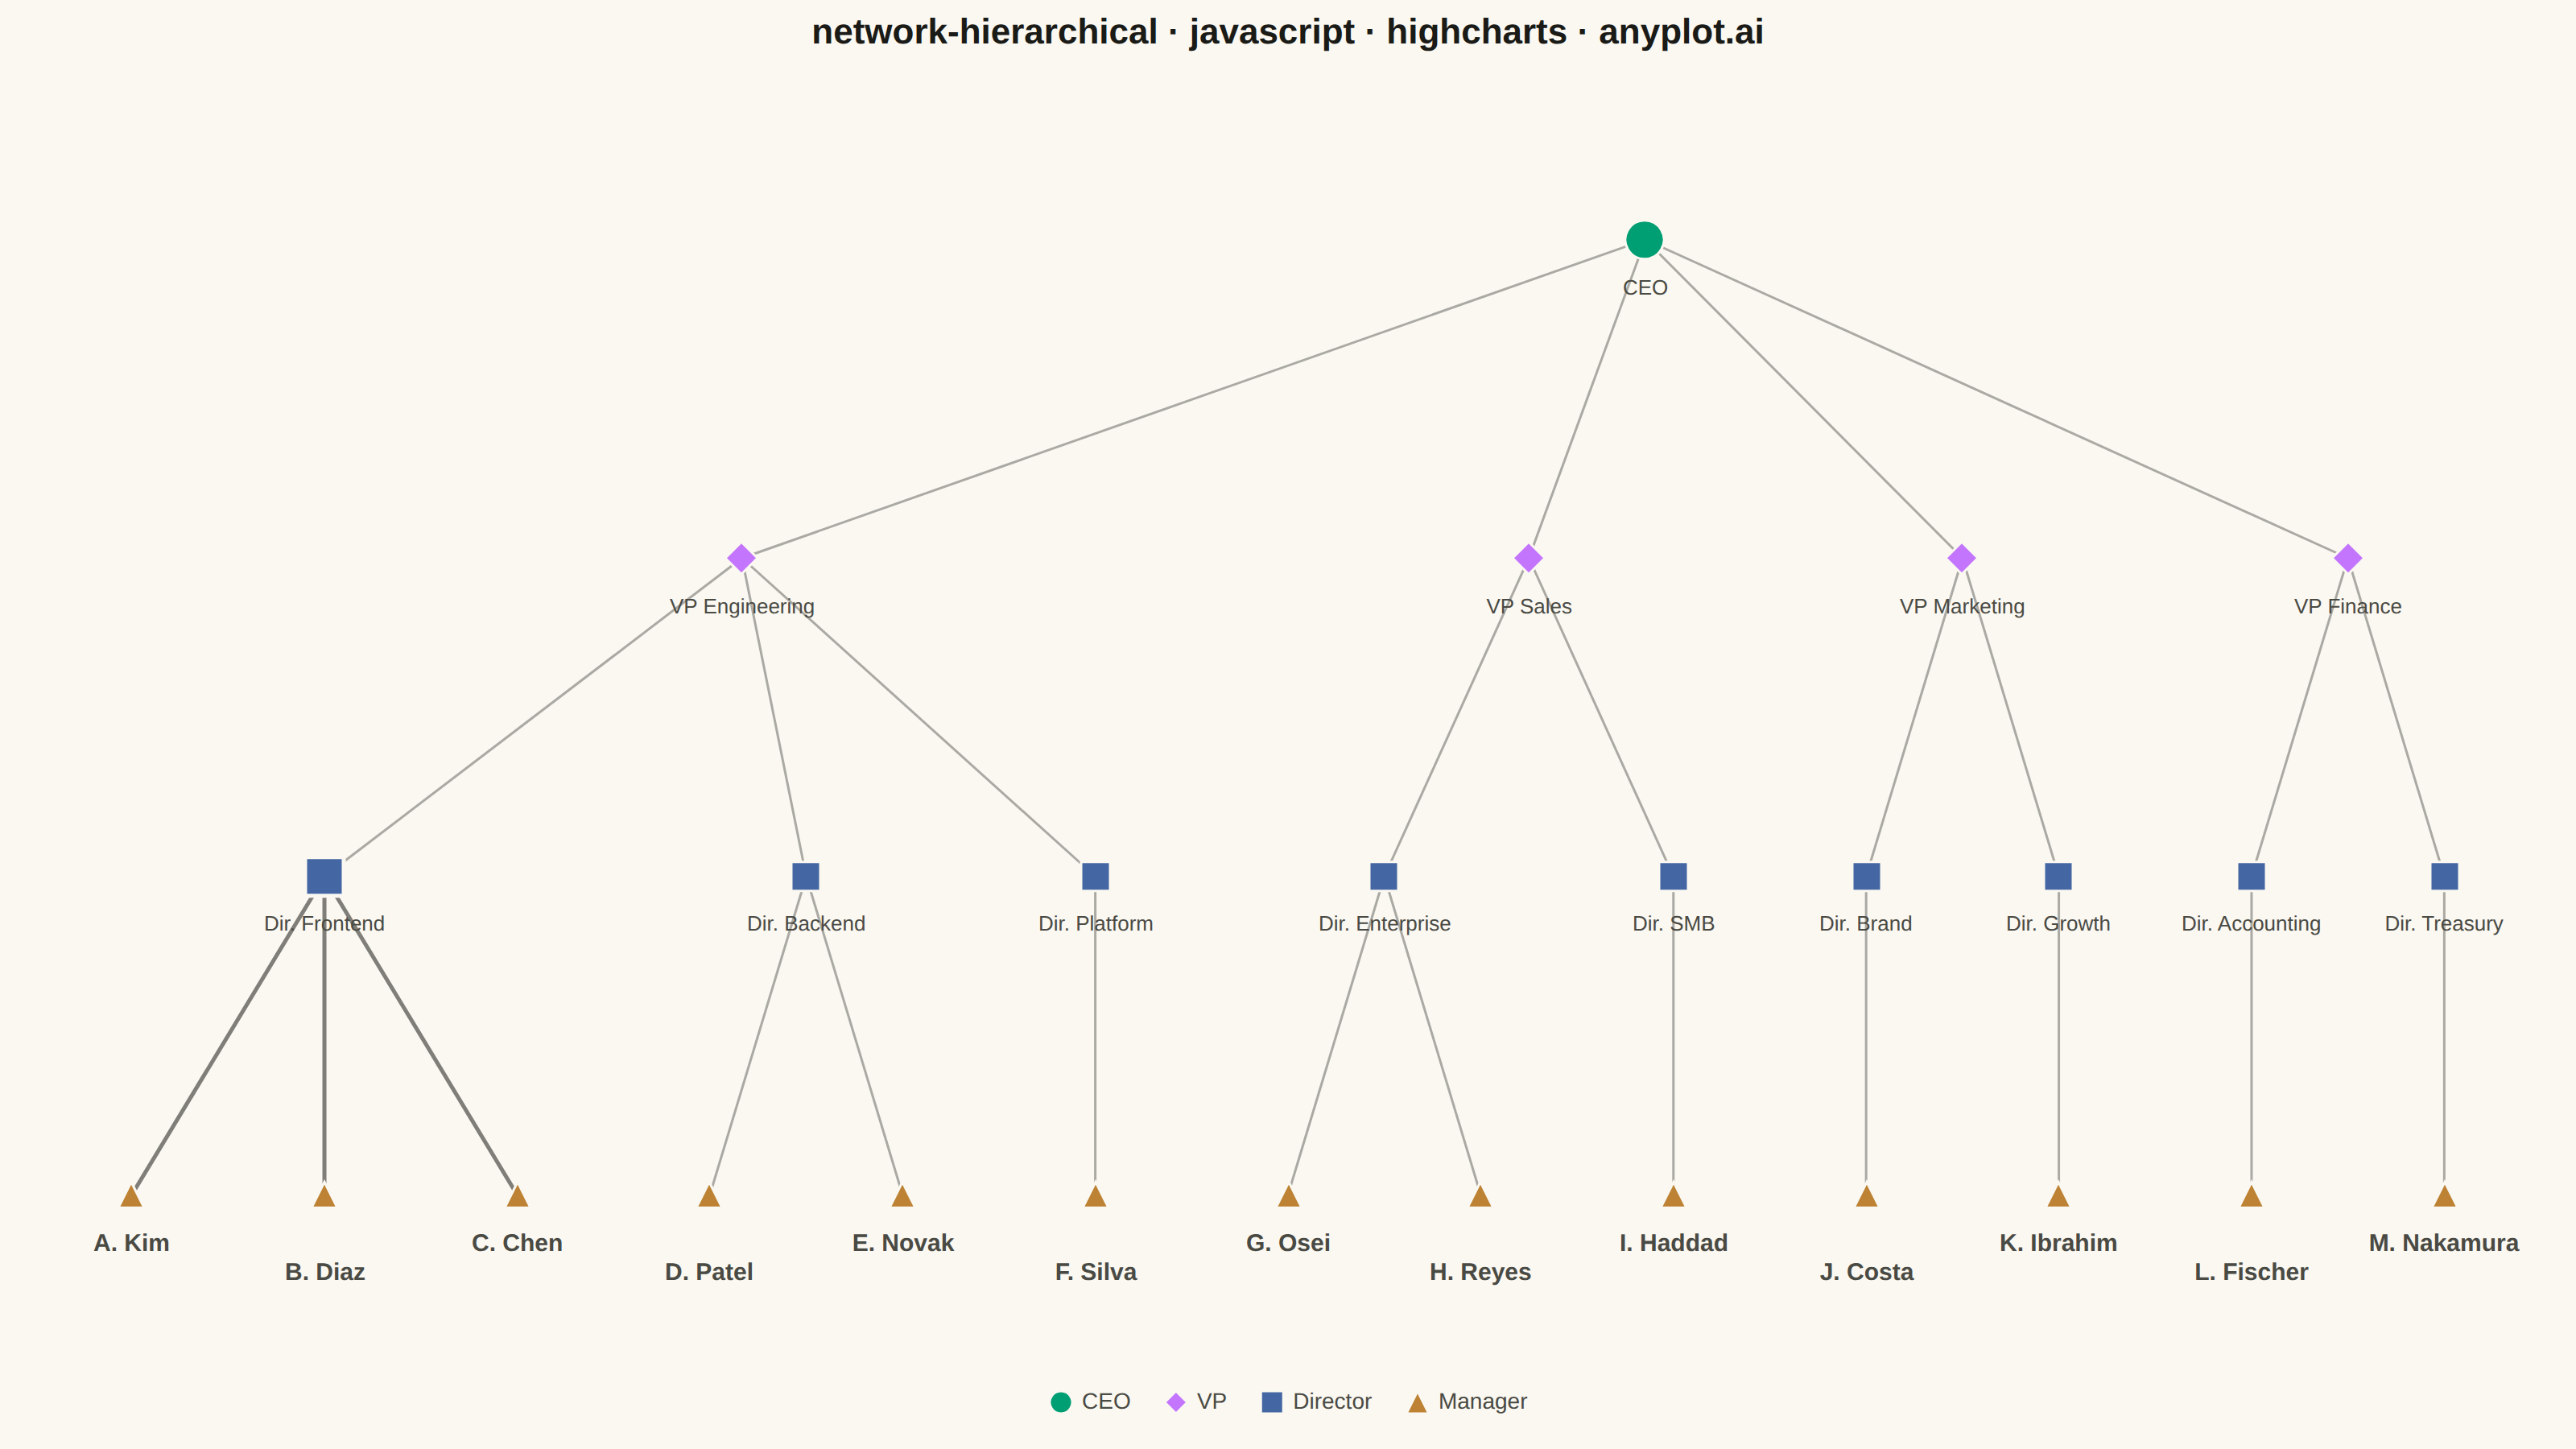
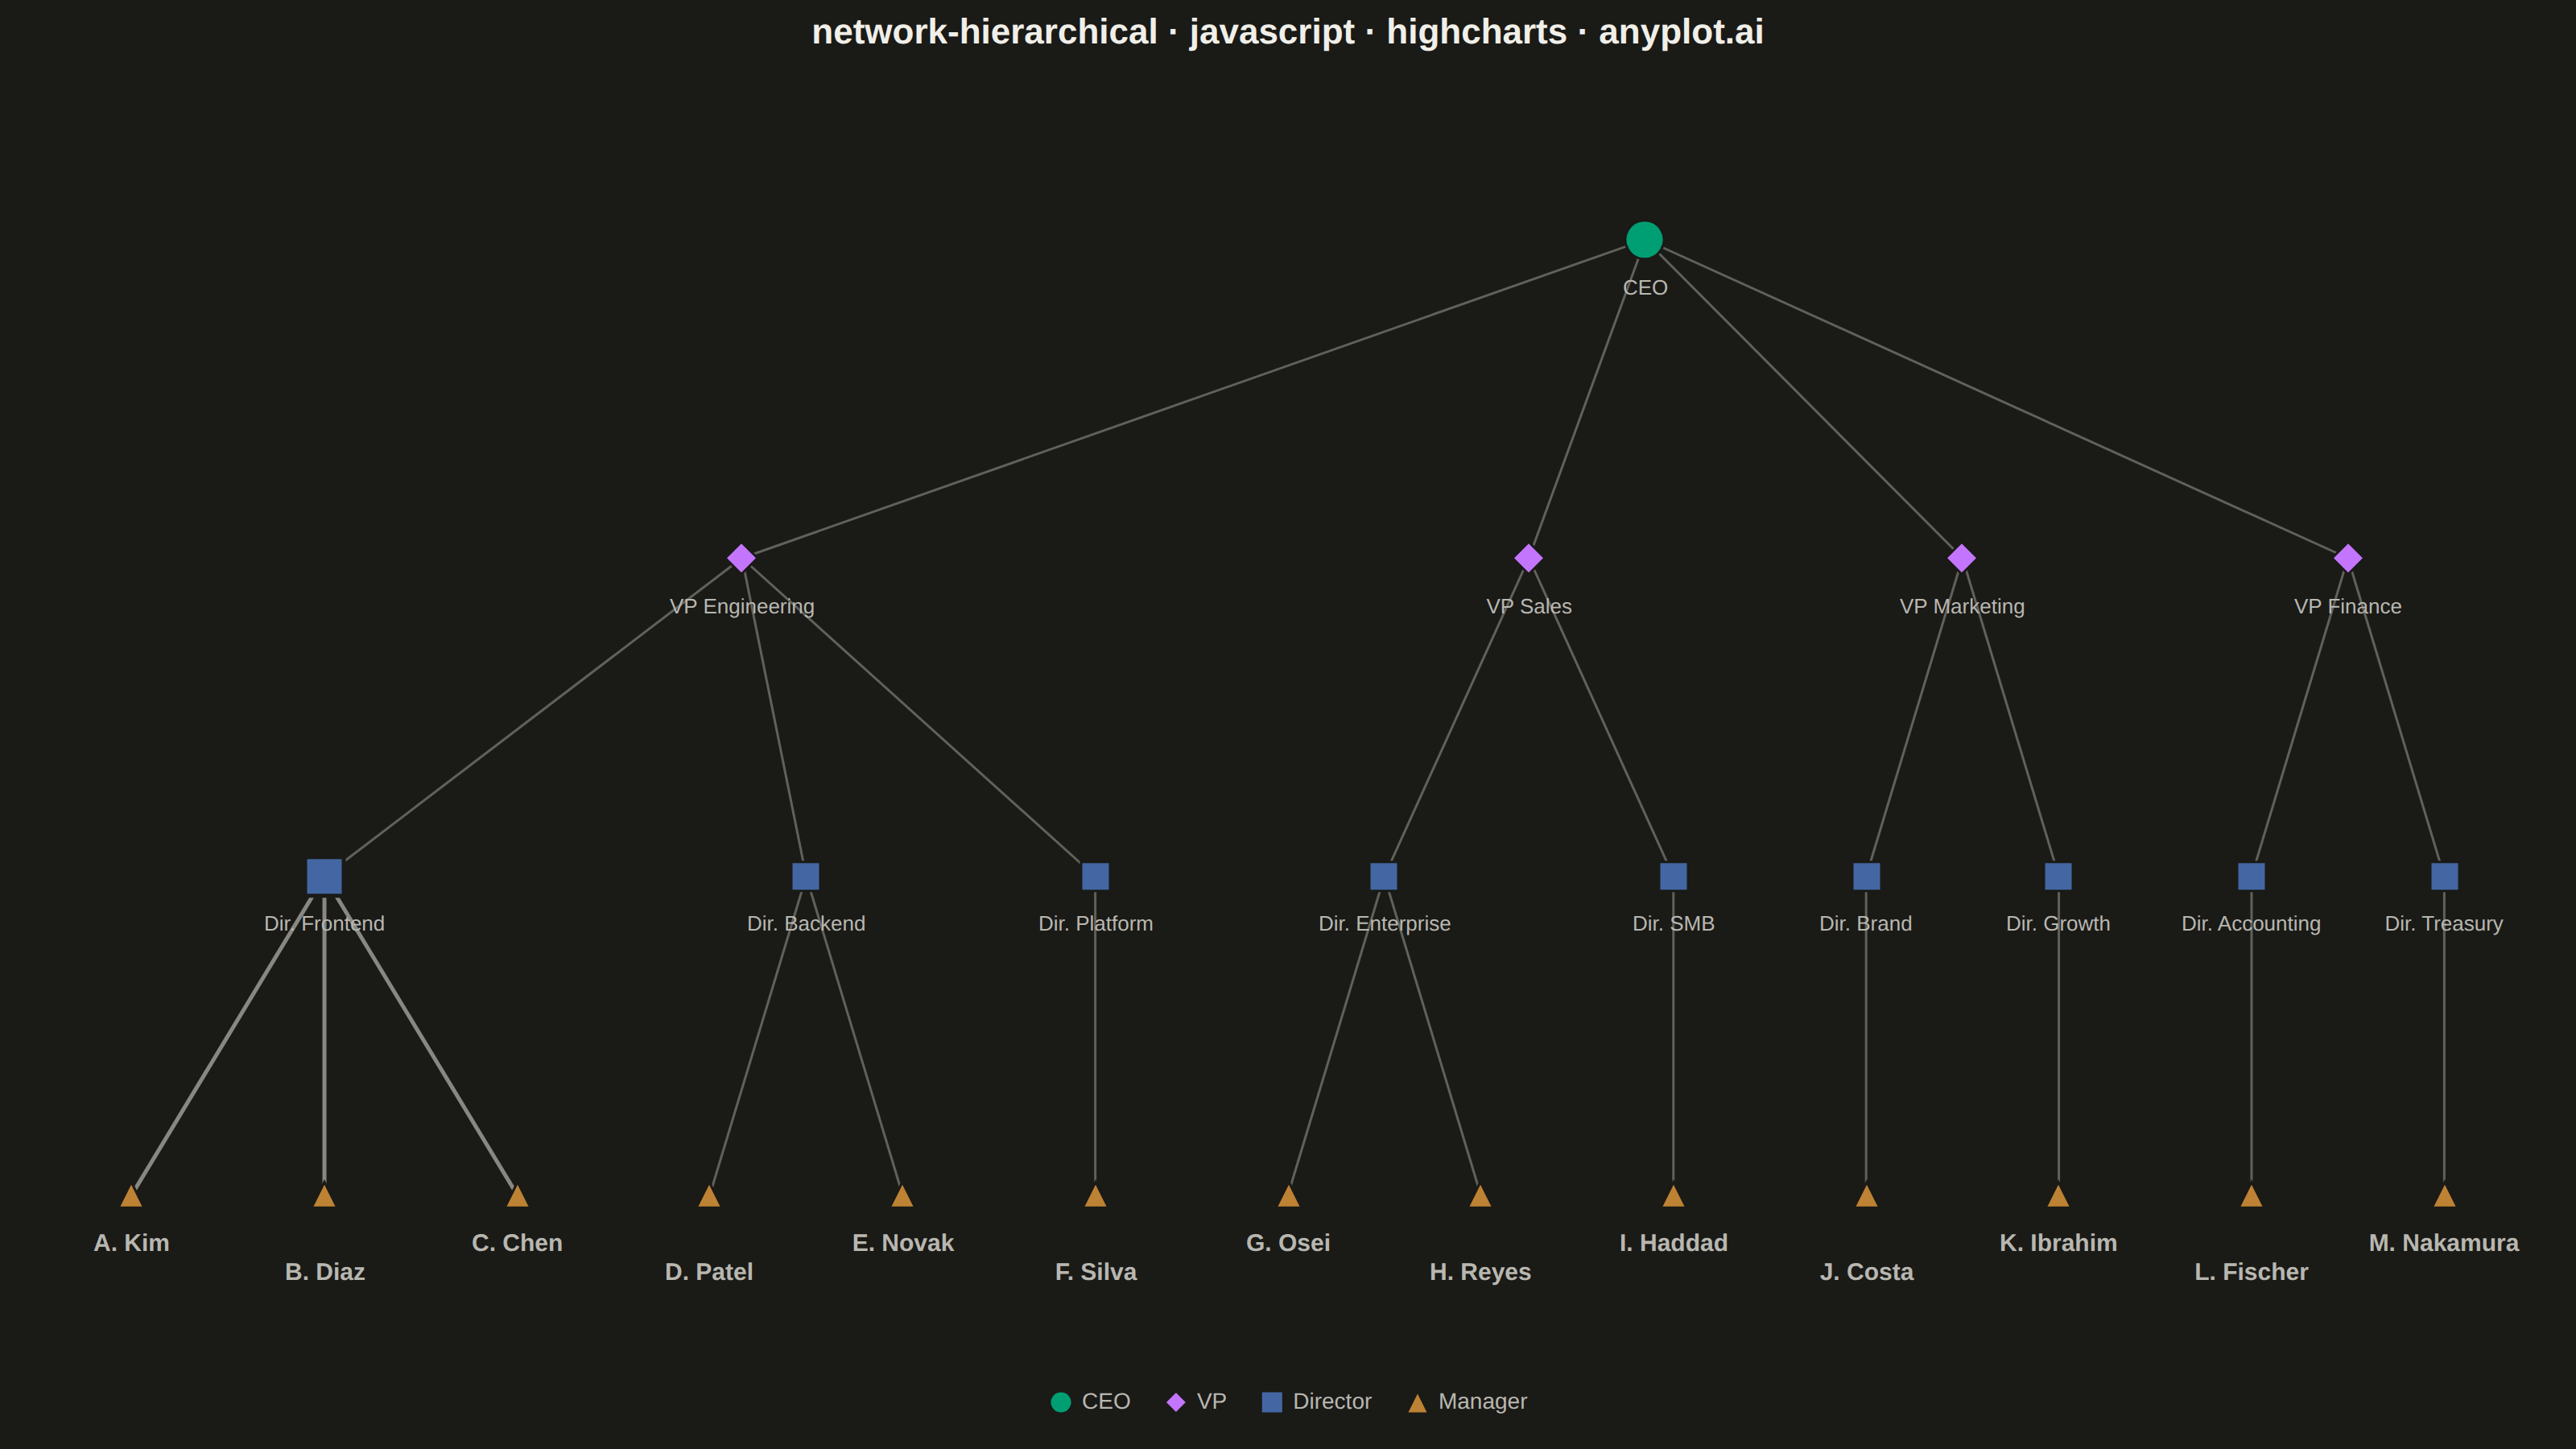
The same plot in 14 other libraries — JavaScript: Chart.js, D3.js, Apache ECharts, MUI X Charts; Python: Altair, Bokeh, lets-plot, Matplotlib, Plotly, plotnine, Pygal, Seaborn; R: ggplot2; Julia: Makie.jl. Compare all 15 side by side: Hierarchical Network Graph with Tree Layout in Python, R, Julia and JavaScript.
A hierarchical network graph organizes nodes in distinct levels from root to leaves, with edges showing parent-child relationships between levels. Unlike force-directed layouts that optimize for aesthetic spacing, hierarchical layouts explicitly encode tree structure by positioning nodes at fixed vertical or horizontal levels. This visualization reveals organizational depth, branching patterns, and the overall tree structure at a glance.
// anyplot.ai
// network-hierarchical: Hierarchical Network Graph with Tree Layout
// Library: highcharts 12.6.0 | JavaScript 22.23.2
// Quality: 88/100 | Created: 2026-09-02

const t = window.ANYPLOT_TOKENS;

// --- Data: organizational chart, 4 levels (CEO -> VP -> Director -> Manager) ---
// Branching is intentionally irregular (3 directors under VP Engineering vs. 2
// elsewhere, 3 managers under Dir. Frontend vs. 1-2 elsewhere) to show the span-
// of-control variation a hierarchical layout is meant to expose.
const org = {
  id: "ceo",
  name: "CEO",
  children: [
    {
      id: "vp-eng",
      name: "VP Engineering",
      children: [
        {
          id: "dir-fe",
          name: "Dir. Frontend",
          children: [
            { id: "mgr-a", name: "A. Kim" },
            { id: "mgr-b", name: "B. Diaz" },
            { id: "mgr-c", name: "C. Chen" },
          ],
        },
        {
          id: "dir-be",
          name: "Dir. Backend",
          children: [
            { id: "mgr-d", name: "D. Patel" },
            { id: "mgr-e", name: "E. Novak" },
          ],
        },
        {
          id: "dir-plat",
          name: "Dir. Platform",
          children: [{ id: "mgr-f", name: "F. Silva" }],
        },
      ],
    },
    {
      id: "vp-sales",
      name: "VP Sales",
      children: [
        {
          id: "dir-ent",
          name: "Dir. Enterprise",
          children: [
            { id: "mgr-g", name: "G. Osei" },
            { id: "mgr-h", name: "H. Reyes" },
          ],
        },
        {
          id: "dir-smb",
          name: "Dir. SMB",
          children: [{ id: "mgr-i", name: "I. Haddad" }],
        },
      ],
    },
    {
      id: "vp-mkt",
      name: "VP Marketing",
      children: [
        {
          id: "dir-brand",
          name: "Dir. Brand",
          children: [{ id: "mgr-j", name: "J. Costa" }],
        },
        {
          id: "dir-growth",
          name: "Dir. Growth",
          children: [{ id: "mgr-k", name: "K. Ibrahim" }],
        },
      ],
    },
    {
      id: "vp-fin",
      name: "VP Finance",
      children: [
        {
          id: "dir-acct",
          name: "Dir. Accounting",
          children: [{ id: "mgr-l", name: "L. Fischer" }],
        },
        {
          id: "dir-treas",
          name: "Dir. Treasury",
          children: [{ id: "mgr-m", name: "M. Nakamura" }],
        },
      ],
    },
  ],
};

// Flatten the tree into per-level nodes with a tidy-tree x layout (leaves get
// sequential x, internal nodes sit above the mean x of their children) plus
// parent-child edges for the connector overlay drawn in chart.events.render.
const LEVEL_NAMES = ["CEO", "VP", "Director", "Manager"];
const nodesByLevel = [[], [], [], []];
const edges = [];
let nextLeafX = 0;

function layout(node, level) {
  let x;
  if (!node.children) {
    x = nextLeafX;
    nextLeafX += 1;
  } else {
    const childXs = node.children.map((child) => {
      edges.push([node.id, child.id]);
      return layout(child, level + 1);
    });
    x = childXs.reduce((a, b) => a + b, 0) / childXs.length;
  }
  nodesByLevel[level].push({ id: node.id, name: node.name, x, y: level });
  return x;
}
layout(org, 0);

const nodeById = {};
nodesByLevel.forEach((level) => level.forEach((n) => { nodeById[n.id] = n; }));

// Data-storytelling emphasis: find the Director with the most direct Manager
// reports (the span-of-control outlier) and highlight its node + connectors.
const directorSpan = {};
edges.forEach(([parentId, childId]) => {
  if (nodeById[parentId].y === 2 && nodeById[childId].y === 3) {
    directorSpan[parentId] = (directorSpan[parentId] || 0) + 1;
  }
});
const largestTeamId = Object.keys(directorSpan).reduce(
  (best, id) => (directorSpan[id] > (directorSpan[best] || 0) ? id : best),
  null,
);

// Marker radius shrinks from root to leaves, reinforcing the depth encoding
// that color and shape already provide.
const LEVEL_RADII = [12, 10, 9, 8];

// --- Chart -------------------------------------------------------------------
Highcharts.chart("container", {
  chart: {
    type: "scatter",
    backgroundColor: "transparent",
    animation: false,
    style: { fontFamily: "inherit" },
    events: {
      // Core Highcharts has no built-in tree/network series (those live in the
      // unloaded networkgraph/treegraph modules), so parent-child connectors
      // are drawn by hand as SVG paths between each pair's pixel coordinates.
      render() {
        const chart = this;
        if (chart.edgeGroup) chart.edgeGroup.destroy();
        chart.edgeGroup = chart.renderer.g("edges").attr({ zIndex: 2 }).add();
        edges.forEach(([parentId, childId]) => {
          const p = nodeById[parentId];
          const c = nodeById[childId];
          const x1 = chart.xAxis[0].toPixels(p.x);
          const y1 = chart.yAxis[0].toPixels(p.y);
          const x2 = chart.xAxis[0].toPixels(c.x);
          const y2 = chart.yAxis[0].toPixels(c.y);
          // The largest-team director's connectors render bolder, flagging the
          // span-of-control outlier rather than a purely structural read.
          const highlighted = parentId === largestTeamId;
          chart.renderer
            .path(["M", x1, y1, "L", x2, y2])
            .attr({
              stroke: t.inkSoft,
              "stroke-width": highlighted ? 2.5 : 1.5,
              opacity: highlighted ? 0.7 : 0.45,
            })
            .add(chart.edgeGroup);
        });
      },
    },
  },
  credits: { enabled: false },
  colors: t.palette,
  title: {
    text: "network-hierarchical · javascript · highcharts · anyplot.ai",
    style: { color: t.ink, fontSize: "22px", fontWeight: "600" },
  },
  xAxis: { visible: false, min: -0.6, max: nextLeafX - 0.4 },
  yAxis: { visible: false, reversed: true, min: -0.4, max: 3.5 },
  legend: {
    itemStyle: { color: t.inkSoft, fontSize: "14px" },
    itemHoverStyle: { color: t.ink },
  },
  tooltip: { enabled: false },
  plotOptions: {
    series: { animation: false },
    scatter: {
      marker: { lineColor: t.pageBg, lineWidth: 1.5 },
      dataLabels: {
        enabled: true,
        format: "{point.name}",
        verticalAlign: "top",
        y: 16,
        crop: false,
        overflow: "allow",
        style: { color: t.inkSoft, fontSize: "13px", fontWeight: "normal", textOutline: "none" },
      },
    },
  },
  series: LEVEL_NAMES.map((name, level) => ({
    name,
    color: t.palette[level],
    marker: { radius: LEVEL_RADII[level] },
    // The Manager row is the most crowded level and the one that blurs first at
    // mobile thumbnail scale, so its labels get a larger, semibold font on top
    // of the vertical stagger that already prevents horizontal collisions.
    dataLabels:
      level === 3 ? { style: { fontSize: "15px", fontWeight: "600" } } : undefined,
    data: nodesByLevel[level].map((n, i) => ({
      x: n.x,
      y: n.y,
      name: n.name,
      dataLabels: level === 3 ? { y: i % 2 === 0 ? 16 : 34 } : undefined,
      // Call out the span-of-control outlier with a slightly larger, bolder
      // marker to match the bolder connector lines drawn in chart.events.render.
      marker: n.id === largestTeamId ? { radius: LEVEL_RADII[level] + 3, lineWidth: 2.5 } : undefined,
    })),
  })),
});
Runnable source as JSON, for any HTTP client: https://api.anyplot.ai/specs/network-hierarchical/highcharts/code. Any spec id and library id listed in llms-full.txt fit the same URL shape; every URL below is complete and callable.
{
  "spec_id": "network-hierarchical",
  "language": "javascript",
  "library": "highcharts",
  "page": "https://anyplot.ai/network-hierarchical/javascript/highcharts",
  "hub": "https://anyplot.ai/network-hierarchical",
  "code_json": "https://api.anyplot.ai/specs/network-hierarchical/highcharts/code",
  "spec_json": "https://api.anyplot.ai/specs/network-hierarchical",
  "render_light_png": "https://storage.googleapis.com/anyplot-images/plots/network-hierarchical/javascript/highcharts/plot-light.png",
  "render_dark_png": "https://storage.googleapis.com/anyplot-images/plots/network-hierarchical/javascript/highcharts/plot-dark.png",
  "interactive_light_html": "https://storage.googleapis.com/anyplot-images/plots/network-hierarchical/javascript/highcharts/plot-light.html",
  "interactive_dark_html": "https://storage.googleapis.com/anyplot-images/plots/network-hierarchical/javascript/highcharts/plot-dark.html",
  "quality_score": 88.0,
  "license": "MIT",
  "guide": "https://anyplot.ai/llms.txt"
}
Part of Hierarchical Network Graph with Tree Layout on anyplot.ai.