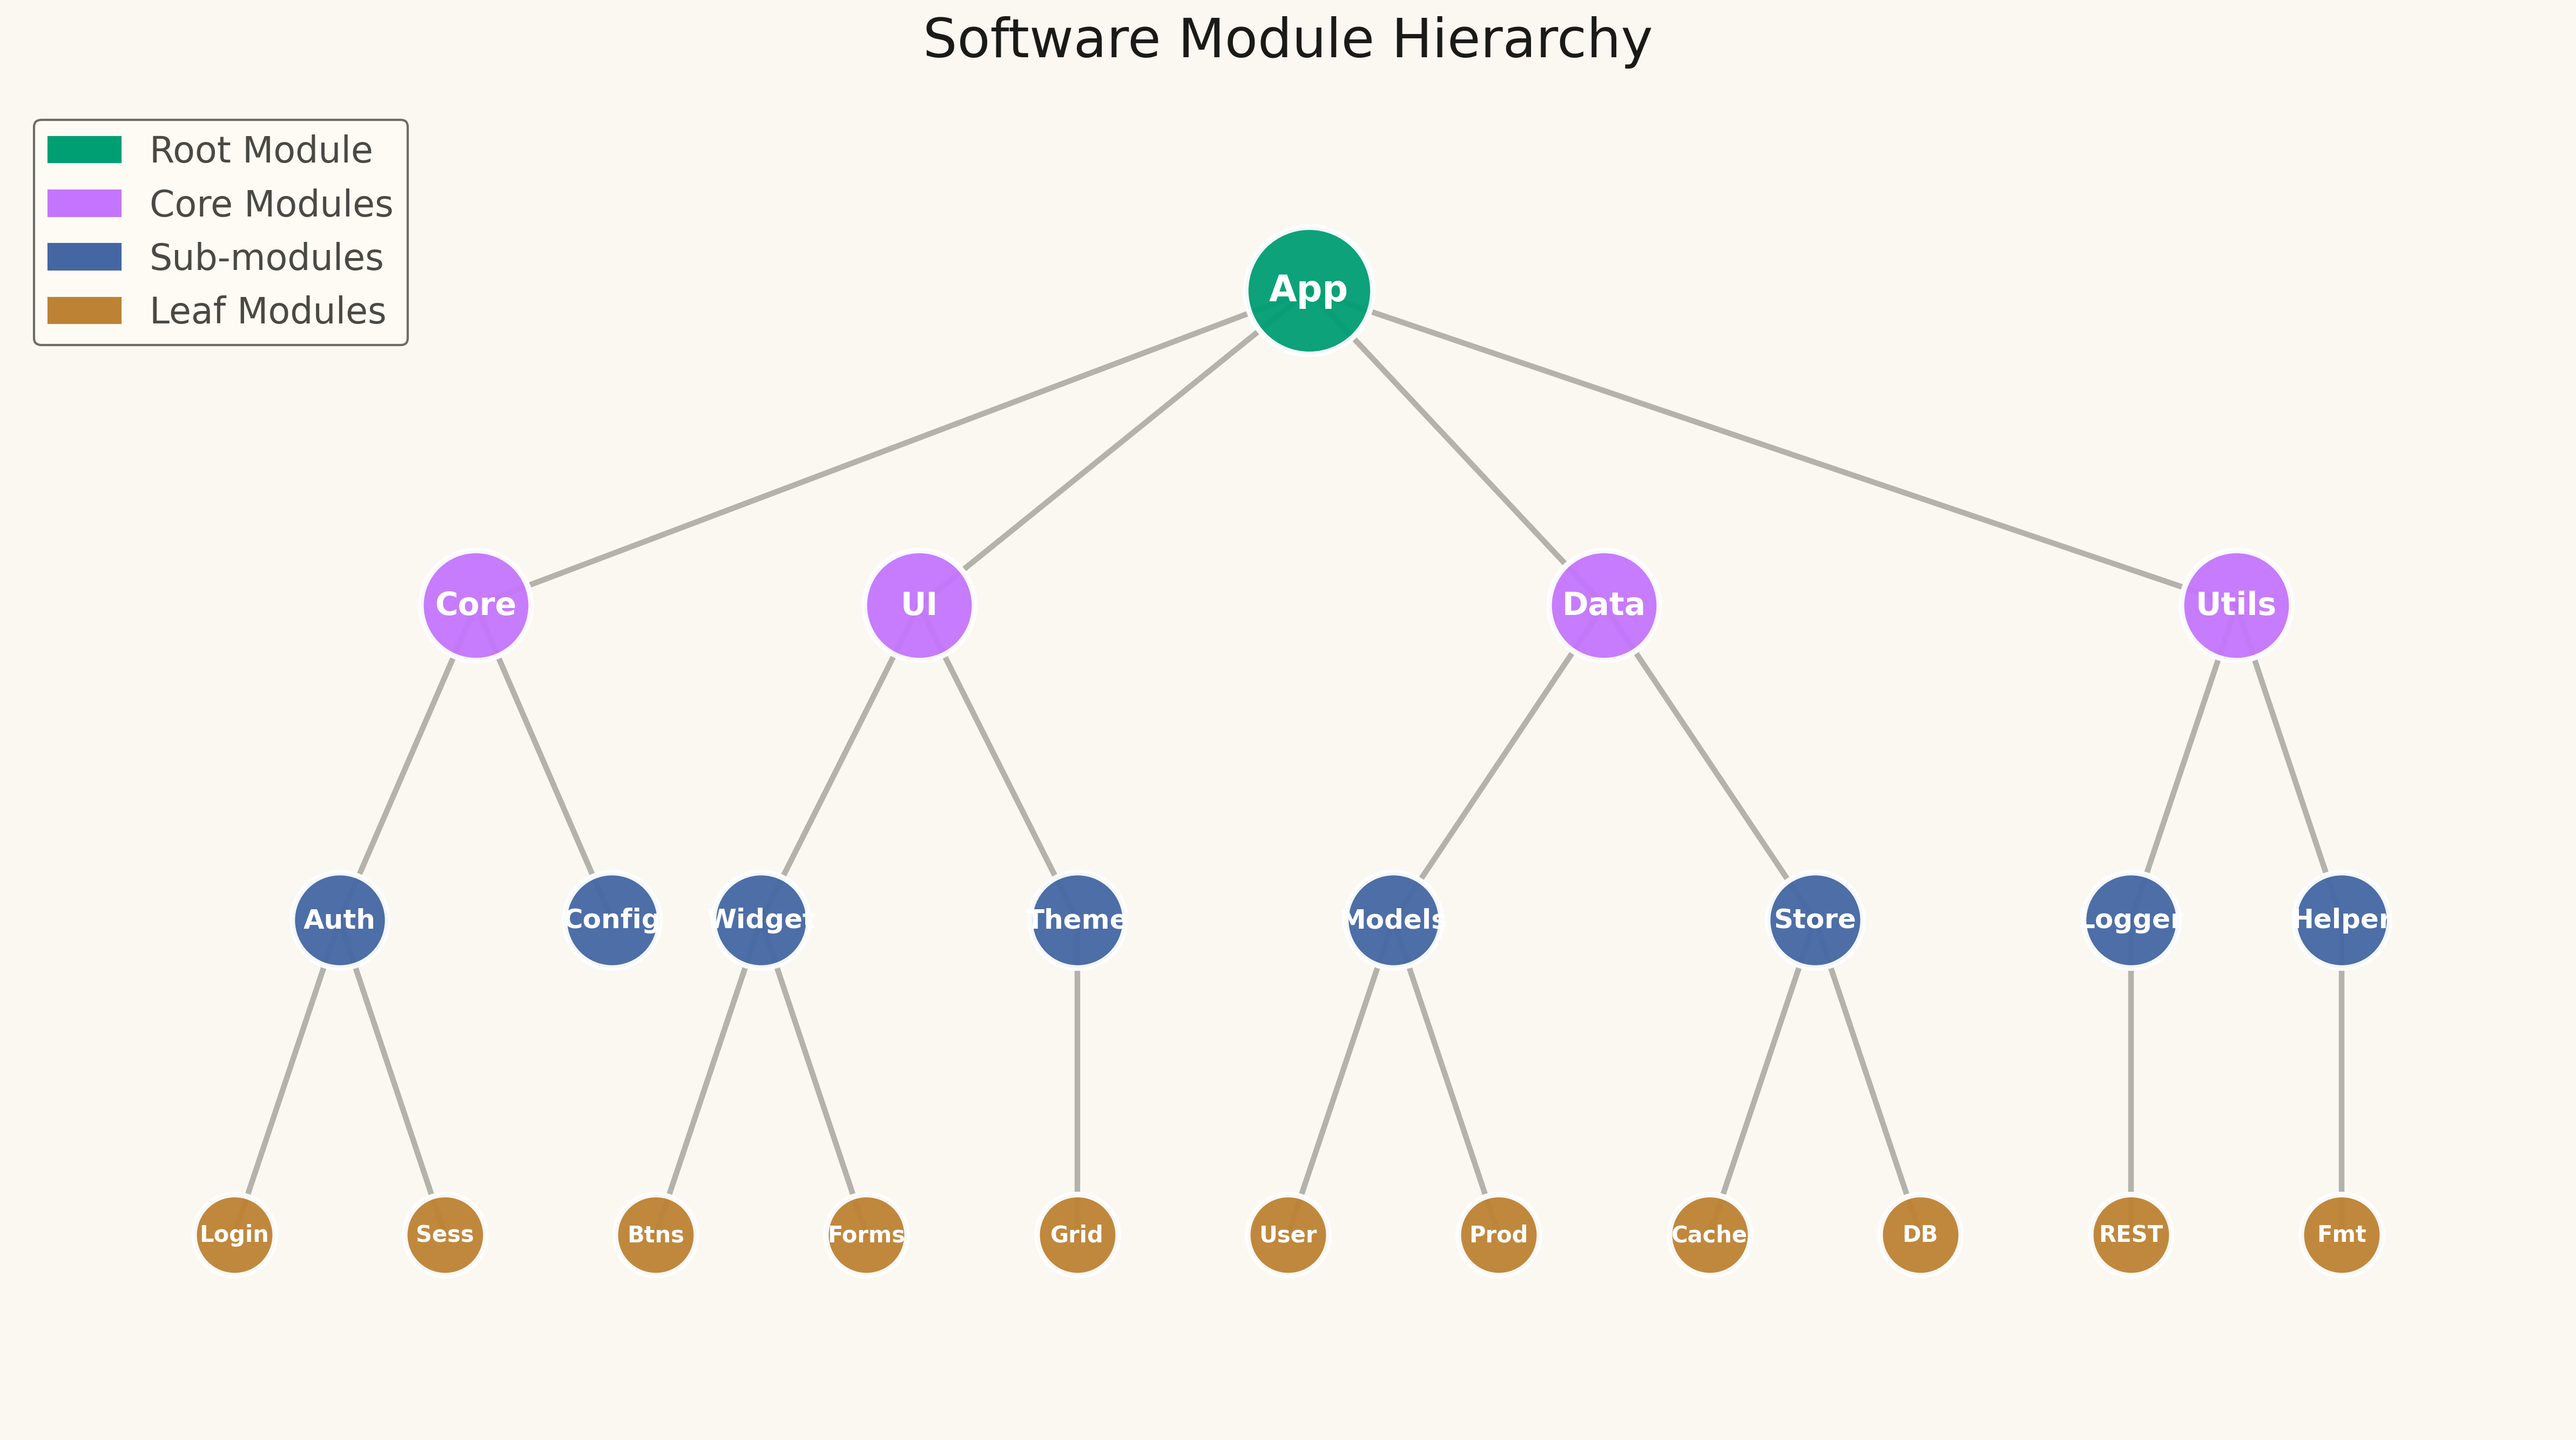
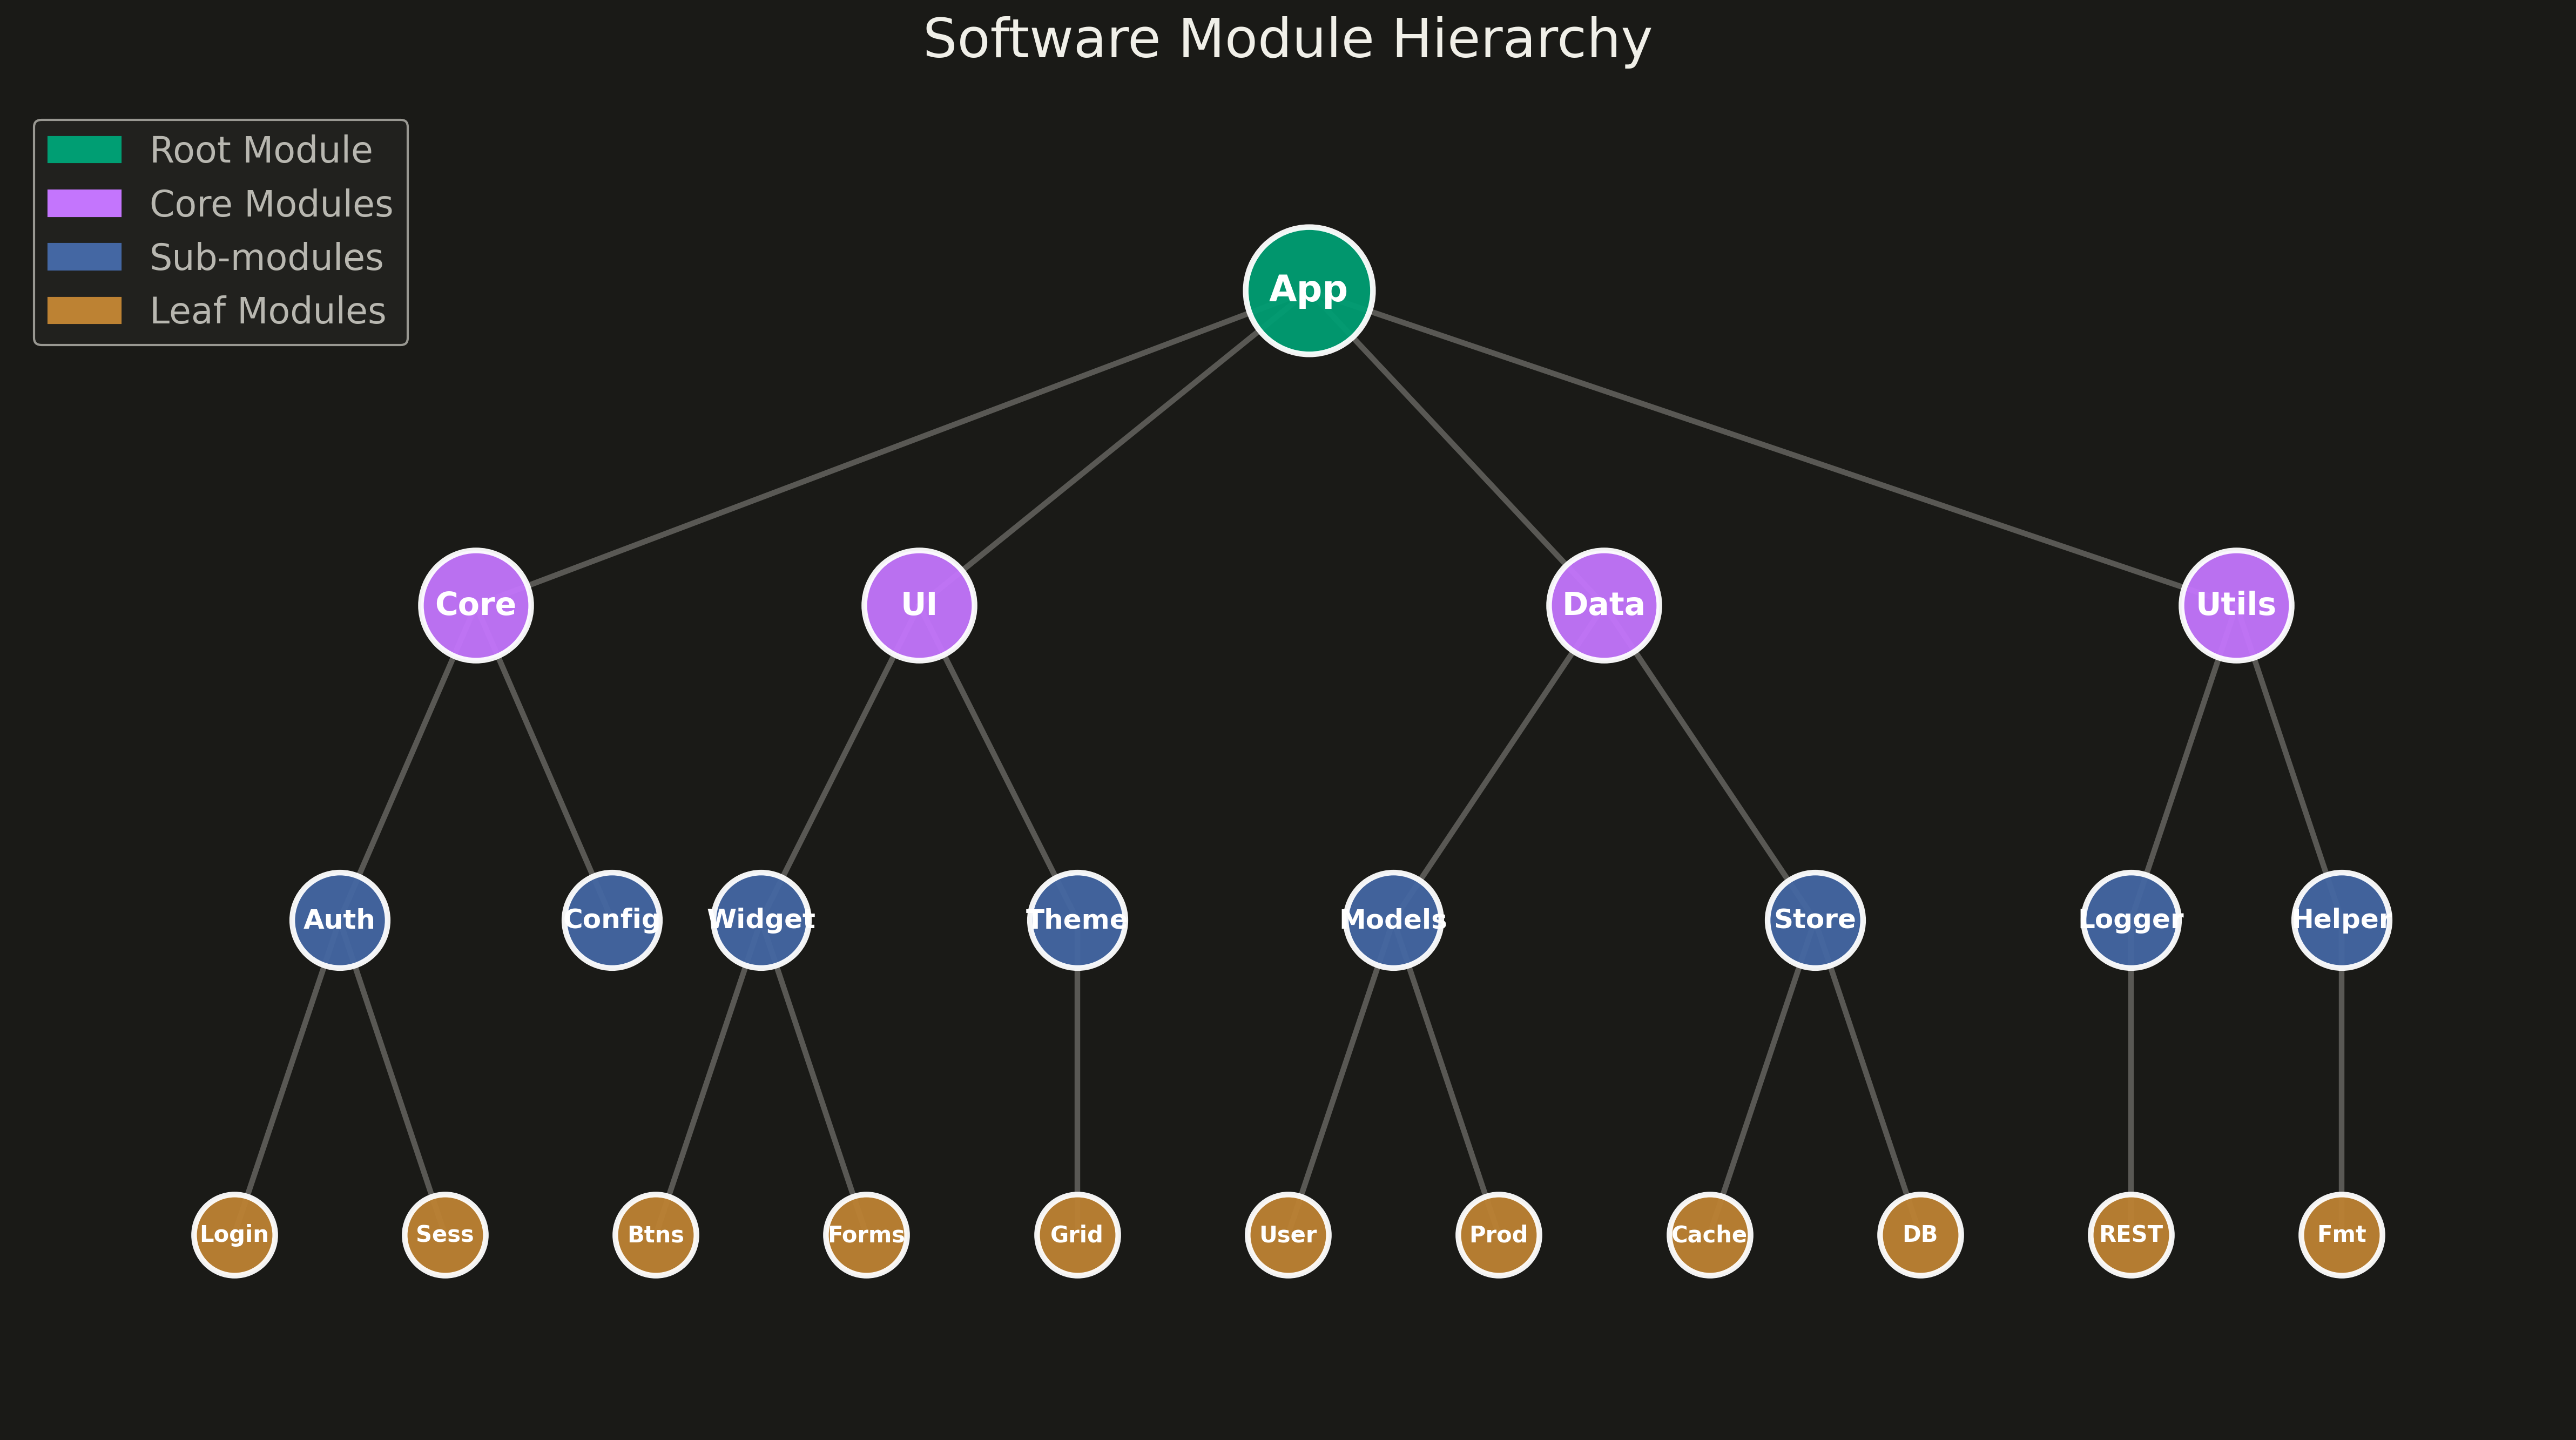
A hierarchical network graph organizes nodes in distinct levels from root to leaves, with edges showing parent-child relationships between levels. Unlike force-directed layouts that optimize for aesthetic spacing, hierarchical layouts explicitly encode tree structure by positioning nodes at fixed vertical or horizontal levels. This visualization reveals organizational depth, branching patterns, and the overall tree structure at a glance.
""" anyplot.ai
network-hierarchical: Hierarchical Network Graph with Tree Layout
Library: matplotlib 3.10.9 | Python 3.13.13
Quality: 92/100 | Updated: 2026-05-17
"""

import os
import sys


# Remove current directory from path to avoid matplotlib module conflict
sys.path = [p for p in sys.path if p != "" and not p.endswith(os.path.dirname(__file__))]

import matplotlib.patches as mpatches
import matplotlib.pyplot as plt
import numpy as np


# Theme configuration
THEME = os.getenv("ANYPLOT_THEME", "light")
PAGE_BG = "#FAF8F1" if THEME == "light" else "#1A1A17"
ELEVATED_BG = "#FFFDF6" if THEME == "light" else "#242420"
INK = "#1A1A17" if THEME == "light" else "#F0EFE8"
INK_SOFT = "#4A4A44" if THEME == "light" else "#B8B7B0"
INK_MUTED = "#6B6A63" if THEME == "light" else "#A8A79F"

# Okabe-Ito palette
IMPRINT = ["#009E73", "#C475FD", "#4467A3", "#BD8233"]

# Data: Software Module Hierarchy (24 nodes, 4 levels)
np.random.seed(42)

nodes = [
    # Level 0 - Root
    ("app", "App", 0, None),
    # Level 1 - Core modules (4 nodes)
    ("core", "Core", 1, "app"),
    ("ui", "UI", 1, "app"),
    ("data", "Data", 1, "app"),
    ("utils", "Utils", 1, "app"),
    # Level 2 - Sub-modules (8 nodes - 2 per parent)
    ("auth", "Auth", 2, "core"),
    ("config", "Config", 2, "core"),
    ("widgets", "Widget", 2, "ui"),
    ("themes", "Theme", 2, "ui"),
    ("models", "Models", 2, "data"),
    ("store", "Store", 2, "data"),
    ("logger", "Logger", 2, "utils"),
    ("helpers", "Helper", 2, "utils"),
    # Level 3 - Leaf modules (11 nodes)
    ("login", "Login", 3, "auth"),
    ("session", "Sess", 3, "auth"),
    ("buttons", "Btns", 3, "widgets"),
    ("forms", "Forms", 3, "widgets"),
    ("grid", "Grid", 3, "themes"),
    ("user", "User", 3, "models"),
    ("product", "Prod", 3, "models"),
    ("cache", "Cache", 3, "store"),
    ("db", "DB", 3, "store"),
    ("rest", "REST", 3, "logger"),
    ("format", "Fmt", 3, "helpers"),
]

# Create lookup dictionaries
hierarchy = {n[0]: (n[1], n[2], n[3]) for n in nodes}

# Group nodes by level
levels = {0: [], 1: [], 2: [], 3: []}
for node_id, _label, level, _parent in nodes:
    levels[level].append(node_id)

# Calculate positions using breadth-first approach
positions = {}
y_positions = {0: 8.5, 1: 6.0, 2: 3.5, 3: 1.0}

# Position level 3 (leaves) first with even spacing
level3_nodes = levels[3]
n_leaves = len(level3_nodes)
x_positions_l3 = np.linspace(1, 15.5, n_leaves)
for i, node_id in enumerate(level3_nodes):
    positions[node_id] = (x_positions_l3[i], y_positions[3])

# Position level 2 - center each parent over its children
for node_id in levels[2]:
    children = [n[0] for n in nodes if n[3] == node_id]
    if children:
        child_xs = [positions[c][0] for c in children]
        positions[node_id] = (np.mean(child_xs), y_positions[2])
    else:
        idx = levels[2].index(node_id)
        positions[node_id] = (2 + idx * 1.6, y_positions[2])

# Position level 1 - center each parent over its children
for node_id in levels[1]:
    children = [n[0] for n in nodes if n[3] == node_id]
    if children:
        child_xs = [positions[c][0] for c in children]
        positions[node_id] = (np.mean(child_xs), y_positions[1])

# Position level 0 - center over children
for node_id in levels[0]:
    children = [n[0] for n in nodes if n[3] == node_id]
    if children:
        child_xs = [positions[c][0] for c in children]
        positions[node_id] = (np.mean(child_xs), y_positions[0])

# Use Okabe-Ito palette for levels
level_colors = {
    0: IMPRINT[0],  # Brand green (#009E73)
    1: IMPRINT[1],  # Vermillion (#C475FD)
    2: IMPRINT[2],  # Blue (#4467A3)
    3: IMPRINT[3],  # Reddish purple (#BD8233)
}
level_names = ["Root Module", "Core Modules", "Sub-modules", "Leaf Modules"]

# Create figure
fig, ax = plt.subplots(figsize=(16, 9), facecolor=PAGE_BG)
ax.set_facecolor(PAGE_BG)

# Draw edges (parent-child connections)
for node_id, _label, _level, parent_id in nodes:
    if parent_id is not None:
        x1, y1 = positions[parent_id]
        x2, y2 = positions[node_id]
        ax.plot([x1, x2], [y1, y2], color=INK_SOFT, linewidth=2.5, alpha=0.4, zorder=1)

# Draw nodes by level
for level in [3, 2, 1, 0]:
    level_node_ids = levels[level]
    for node_id in level_node_ids:
        x, y = positions[node_id]
        label = hierarchy[node_id][0]
        color = level_colors[level]

        # Node size based on level
        node_size = {0: 3200, 1: 2400, 2: 1800, 3: 1300}[level]

        ax.scatter(x, y, s=node_size, c=color, edgecolors="white", linewidths=2.5, zorder=10 + level, alpha=0.95)

        # Add label inside node
        font_size = {0: 16, 1: 14, 2: 12, 3: 10}[level]
        text_color = "white"

        ax.annotate(
            label,
            (x, y),
            ha="center",
            va="center",
            fontsize=font_size,
            fontweight="bold",
            color=text_color,
            zorder=20 + level,
        )

# Create legend
legend_handles = [mpatches.Patch(color=level_colors[i], label=level_names[i]) for i in range(4)]
leg = ax.legend(
    handles=legend_handles, loc="upper left", fontsize=16, frameon=True, facecolor=ELEVATED_BG, edgecolor=INK_SOFT
)
for text in leg.get_texts():
    text.set_color(INK_SOFT)

# Styling
ax.set_title("Software Module Hierarchy", fontsize=24, fontweight="medium", color=INK, pad=20)
ax.set_xlim(-0.5, 17)
ax.set_ylim(-0.5, 10)
ax.axis("off")

plt.tight_layout()
plt.savefig(f"plot-{THEME}.png", dpi=300, bbox_inches="tight", facecolor=PAGE_BG)
Runnable source as JSON, for any HTTP client: https://api.anyplot.ai/specs/network-hierarchical/matplotlib/code. Any spec id and library id listed in llms-full.txt fit the same URL shape; every URL below is complete and callable.
{
  "spec_id": "network-hierarchical",
  "language": "python",
  "library": "matplotlib",
  "page": "https://anyplot.ai/network-hierarchical/python/matplotlib",
  "hub": "https://anyplot.ai/network-hierarchical",
  "code_json": "https://api.anyplot.ai/specs/network-hierarchical/matplotlib/code",
  "spec_json": "https://api.anyplot.ai/specs/network-hierarchical",
  "render_light_png": "https://storage.googleapis.com/anyplot-images/plots/network-hierarchical/python/matplotlib/plot-light.png",
  "render_dark_png": "https://storage.googleapis.com/anyplot-images/plots/network-hierarchical/python/matplotlib/plot-dark.png",
  "quality_score": 92.0,
  "license": "MIT",
  "guide": "https://anyplot.ai/llms.txt"
}
Part of Hierarchical Network Graph with Tree Layout on anyplot.ai.