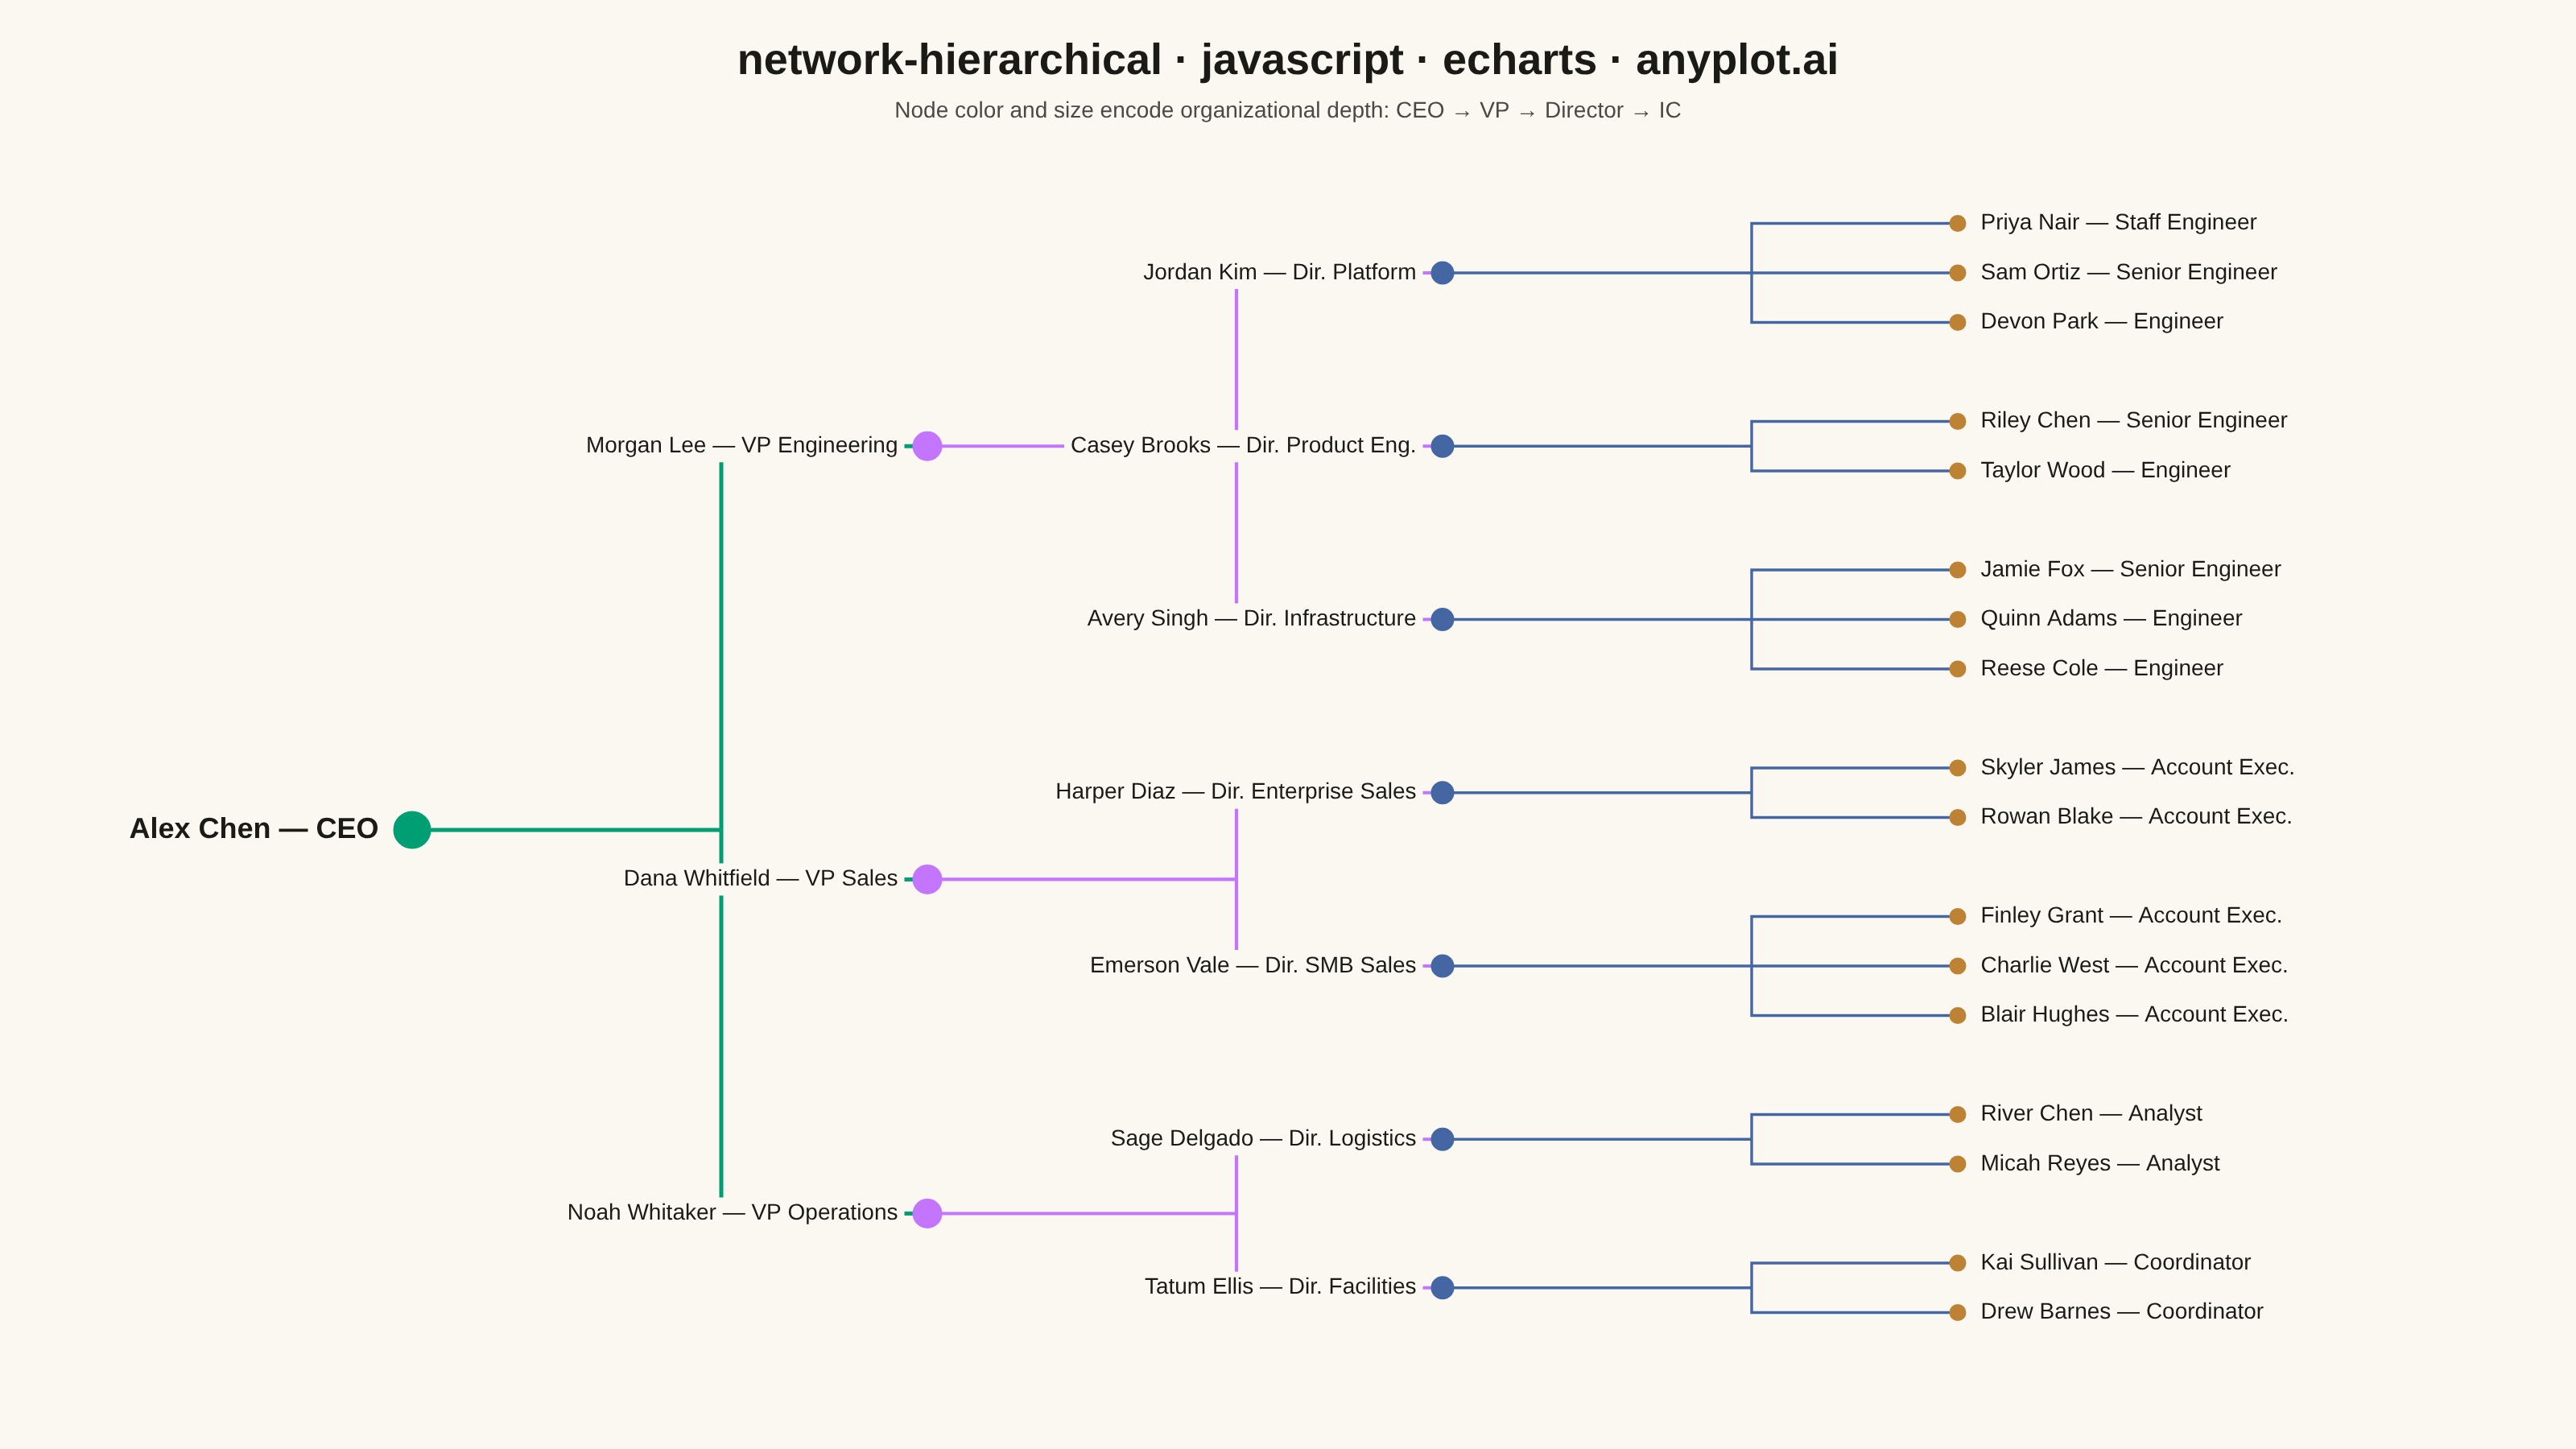
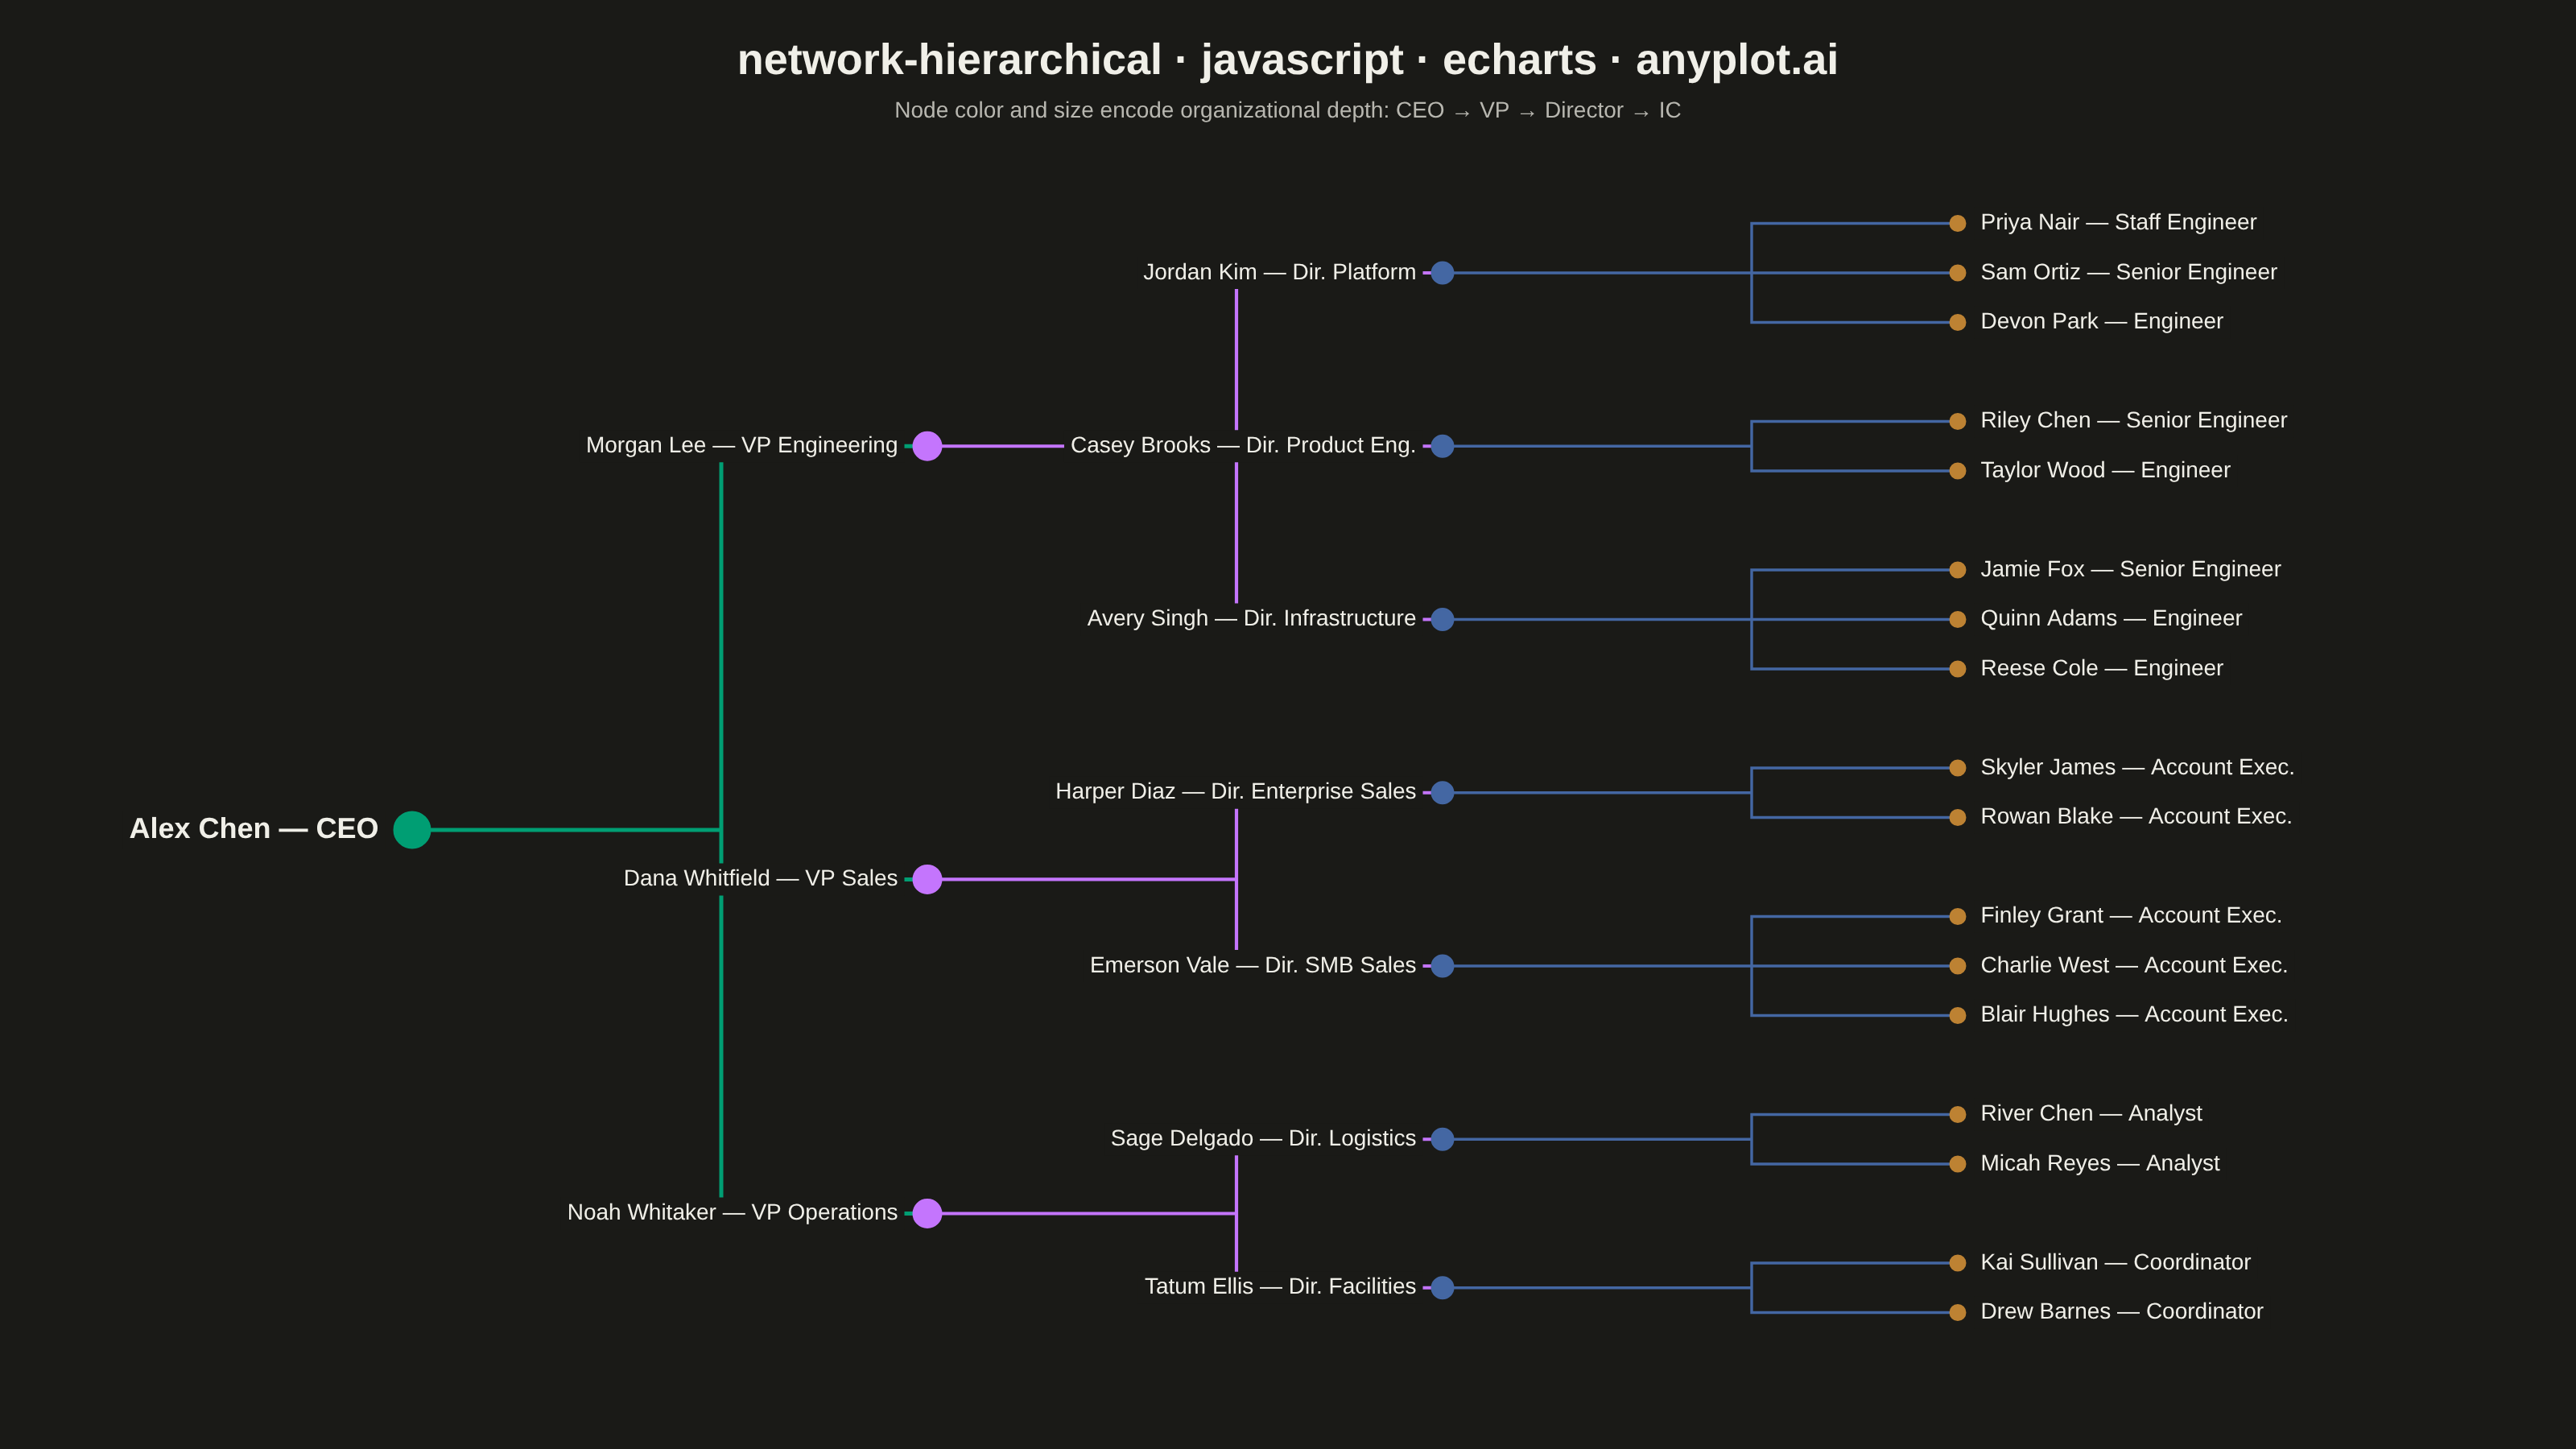
The same plot in 14 other libraries — JavaScript: Chart.js, D3.js, Highcharts, MUI X Charts; Python: Altair, Bokeh, lets-plot, Matplotlib, Plotly, plotnine, Pygal, Seaborn; R: ggplot2; Julia: Makie.jl. Compare all 15 side by side: Hierarchical Network Graph with Tree Layout in Python, R, Julia and JavaScript.
A hierarchical network graph organizes nodes in distinct levels from root to leaves, with edges showing parent-child relationships between levels. Unlike force-directed layouts that optimize for aesthetic spacing, hierarchical layouts explicitly encode tree structure by positioning nodes at fixed vertical or horizontal levels. This visualization reveals organizational depth, branching patterns, and the overall tree structure at a glance.
// anyplot.ai
// network-hierarchical: Hierarchical Network Graph with Tree Layout
// Library: echarts 6.1.0 | JavaScript 22.23.2
// Quality: 94/100 | Created: 2026-09-02

const t = window.ANYPLOT_TOKENS;

// One Imprint hue per management level (0=CEO..3=individual contributors)
// makes the four levels the spec calls for instantly scannable. ECharts'
// tree series has no per-depth "levels" config (unlike sunburst/graph), so
// style is set directly on each data node and applied recursively below.
function styleByDepth(node, depth = 0) {
  const style = [
    {
      color: t.palette[0],
      symbolSize: 22,
      label: { fontSize: 18, fontWeight: "bold" },
    },
    { color: t.palette[1], symbolSize: 17 },
    { color: t.palette[2], symbolSize: 13 },
    { color: t.palette[3], symbolSize: 9 },
  ][depth];
  node.itemStyle = { color: style.color, borderColor: style.color };
  node.lineStyle = { color: style.color, width: 2.5 - depth * 0.4 };
  node.symbolSize = style.symbolSize;
  if (style.label) node.label = style.label;
  (node.children || []).forEach((child) => styleByDepth(child, depth + 1));
  return node;
}

// --- Data (in-memory, deterministic) -----------------------------------
// Org chart: CEO -> VPs -> Directors -> individual contributors (4 levels)
const orgChart = styleByDepth({
  name: "Alex Chen — CEO",
  children: [
    {
      name: "Morgan Lee — VP Engineering",
      children: [
        {
          name: "Jordan Kim — Dir. Platform",
          children: [
            { name: "Priya Nair — Staff Engineer" },
            { name: "Sam Ortiz — Senior Engineer" },
            { name: "Devon Park — Engineer" },
          ],
        },
        {
          name: "Casey Brooks — Dir. Product Eng.",
          children: [
            { name: "Riley Chen — Senior Engineer" },
            { name: "Taylor Wood — Engineer" },
          ],
        },
        {
          name: "Avery Singh — Dir. Infrastructure",
          children: [
            { name: "Jamie Fox — Senior Engineer" },
            { name: "Quinn Adams — Engineer" },
            { name: "Reese Cole — Engineer" },
          ],
        },
      ],
    },
    {
      name: "Dana Whitfield — VP Sales",
      children: [
        {
          name: "Harper Diaz — Dir. Enterprise Sales",
          children: [
            { name: "Skyler James — Account Exec." },
            { name: "Rowan Blake — Account Exec." },
          ],
        },
        {
          name: "Emerson Vale — Dir. SMB Sales",
          children: [
            { name: "Finley Grant — Account Exec." },
            { name: "Charlie West — Account Exec." },
            { name: "Blair Hughes — Account Exec." },
          ],
        },
      ],
    },
    {
      name: "Noah Whitaker — VP Operations",
      children: [
        {
          name: "Sage Delgado — Dir. Logistics",
          children: [
            { name: "River Chen — Analyst" },
            { name: "Micah Reyes — Analyst" },
          ],
        },
        {
          name: "Tatum Ellis — Dir. Facilities",
          children: [
            { name: "Kai Sullivan — Coordinator" },
            { name: "Drew Barnes — Coordinator" },
          ],
        },
      ],
    },
  ],
});

// --- Init ----------------------------------------------------------------
const chart = echarts.init(document.getElementById("container"));

// --- Option ----------------------------------------------------------------
chart.setOption({
  animation: false,
  backgroundColor: "transparent",
  title: {
    text: "network-hierarchical · javascript · echarts · anyplot.ai",
    subtext: "Node color and size encode organizational depth: CEO → VP → Director → IC",
    left: "center",
    top: 20,
    textStyle: { color: t.ink, fontSize: 27 },
    subtextStyle: { color: t.inkSoft, fontSize: 14 },
  },
  series: [
    {
      type: "tree",
      data: [orgChart],
      orient: "LR",
      top: "12%",
      bottom: "6%",
      left: "16%",
      right: "24%",
      symbol: "circle",
      // A page-bg backdrop keeps each label a legible island where the
      // parent/child connector lines pass behind the text, not through it.
      label: {
        position: "left",
        verticalAlign: "middle",
        align: "right",
        fontSize: 14,
        color: t.ink,
        backgroundColor: t.pageBg,
        padding: [3, 4],
      },
      leaves: {
        label: {
          position: "right",
          verticalAlign: "middle",
          align: "left",
          fontSize: 14,
          color: t.ink,
          backgroundColor: t.pageBg,
          padding: [3, 4],
        },
      },
      edgeShape: "polyline",
      edgeForkPosition: "60%",
      expandAndCollapse: false,
      initialTreeDepth: -1,
      roam: false,
      emphasis: { focus: "descendant" },
    },
  ],
});
Runnable source as JSON, for any HTTP client: https://api.anyplot.ai/specs/network-hierarchical/echarts/code. Any spec id and library id listed in llms-full.txt fit the same URL shape; every URL below is complete and callable.
{
  "spec_id": "network-hierarchical",
  "language": "javascript",
  "library": "echarts",
  "page": "https://anyplot.ai/network-hierarchical/javascript/echarts",
  "hub": "https://anyplot.ai/network-hierarchical",
  "code_json": "https://api.anyplot.ai/specs/network-hierarchical/echarts/code",
  "spec_json": "https://api.anyplot.ai/specs/network-hierarchical",
  "render_light_png": "https://storage.googleapis.com/anyplot-images/plots/network-hierarchical/javascript/echarts/plot-light.png",
  "render_dark_png": "https://storage.googleapis.com/anyplot-images/plots/network-hierarchical/javascript/echarts/plot-dark.png",
  "interactive_light_html": "https://storage.googleapis.com/anyplot-images/plots/network-hierarchical/javascript/echarts/plot-light.html",
  "interactive_dark_html": "https://storage.googleapis.com/anyplot-images/plots/network-hierarchical/javascript/echarts/plot-dark.html",
  "quality_score": 94.0,
  "license": "MIT",
  "guide": "https://anyplot.ai/llms.txt"
}
Part of Hierarchical Network Graph with Tree Layout on anyplot.ai.