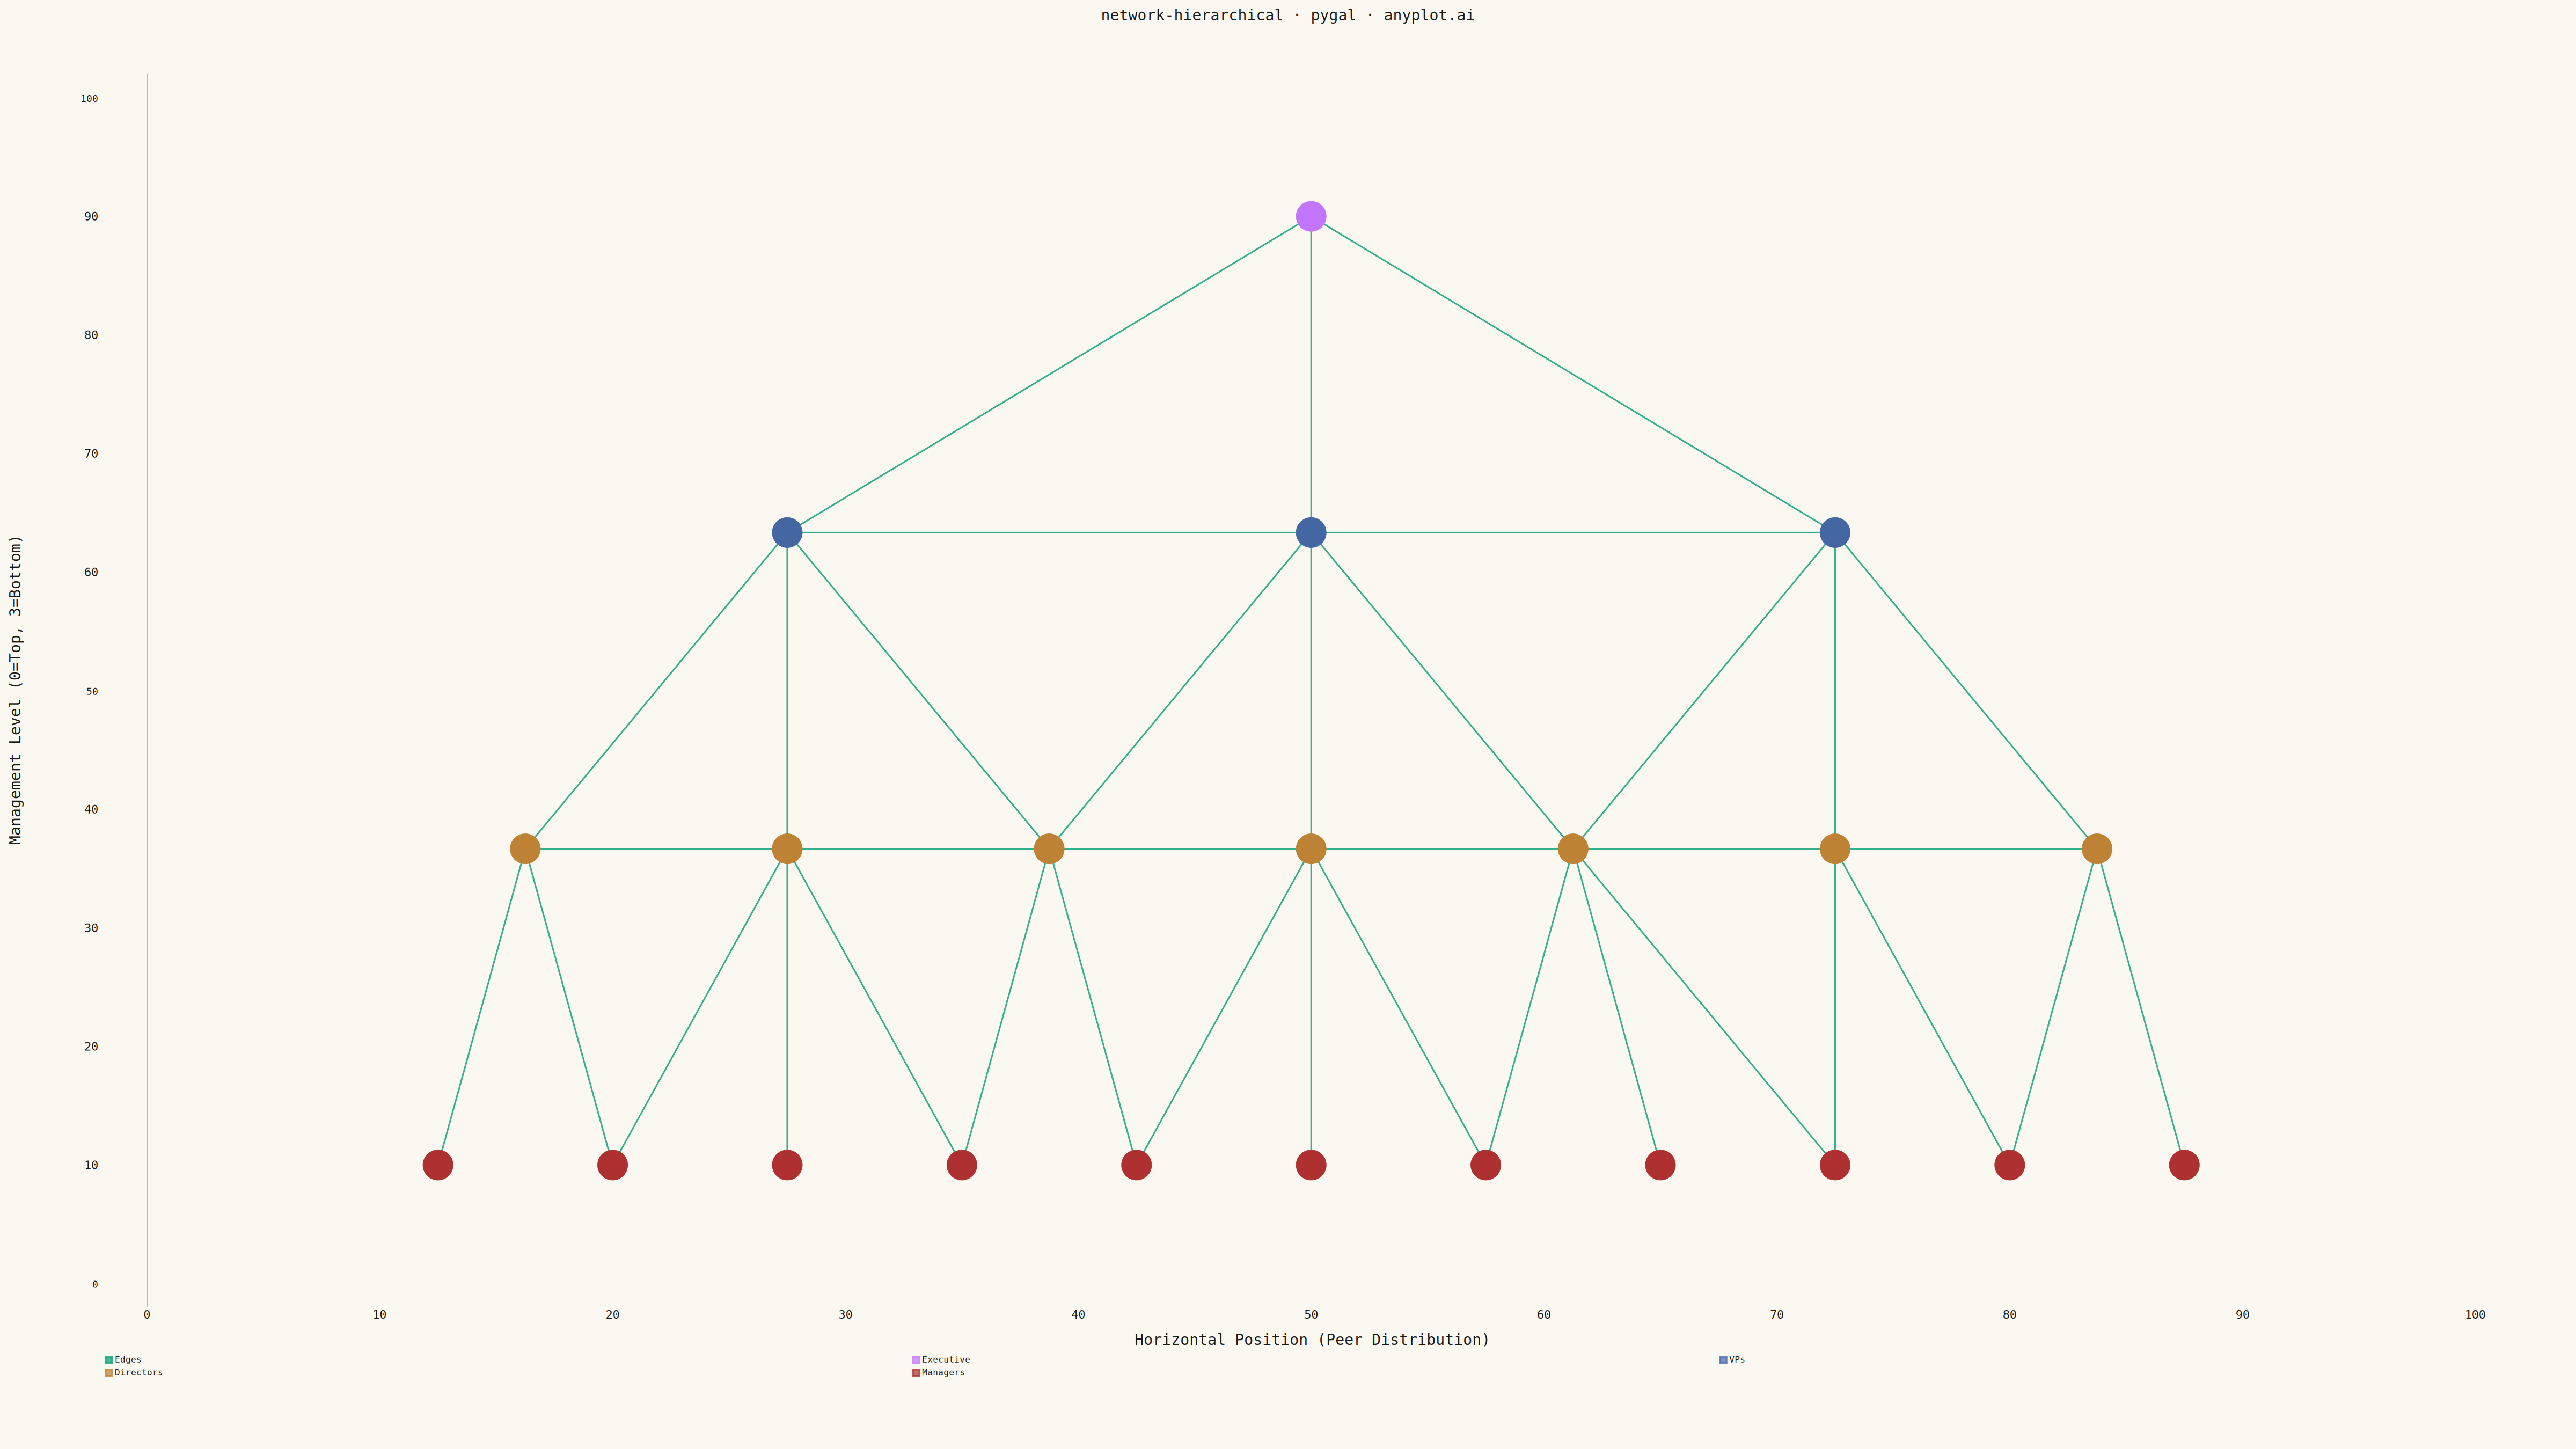
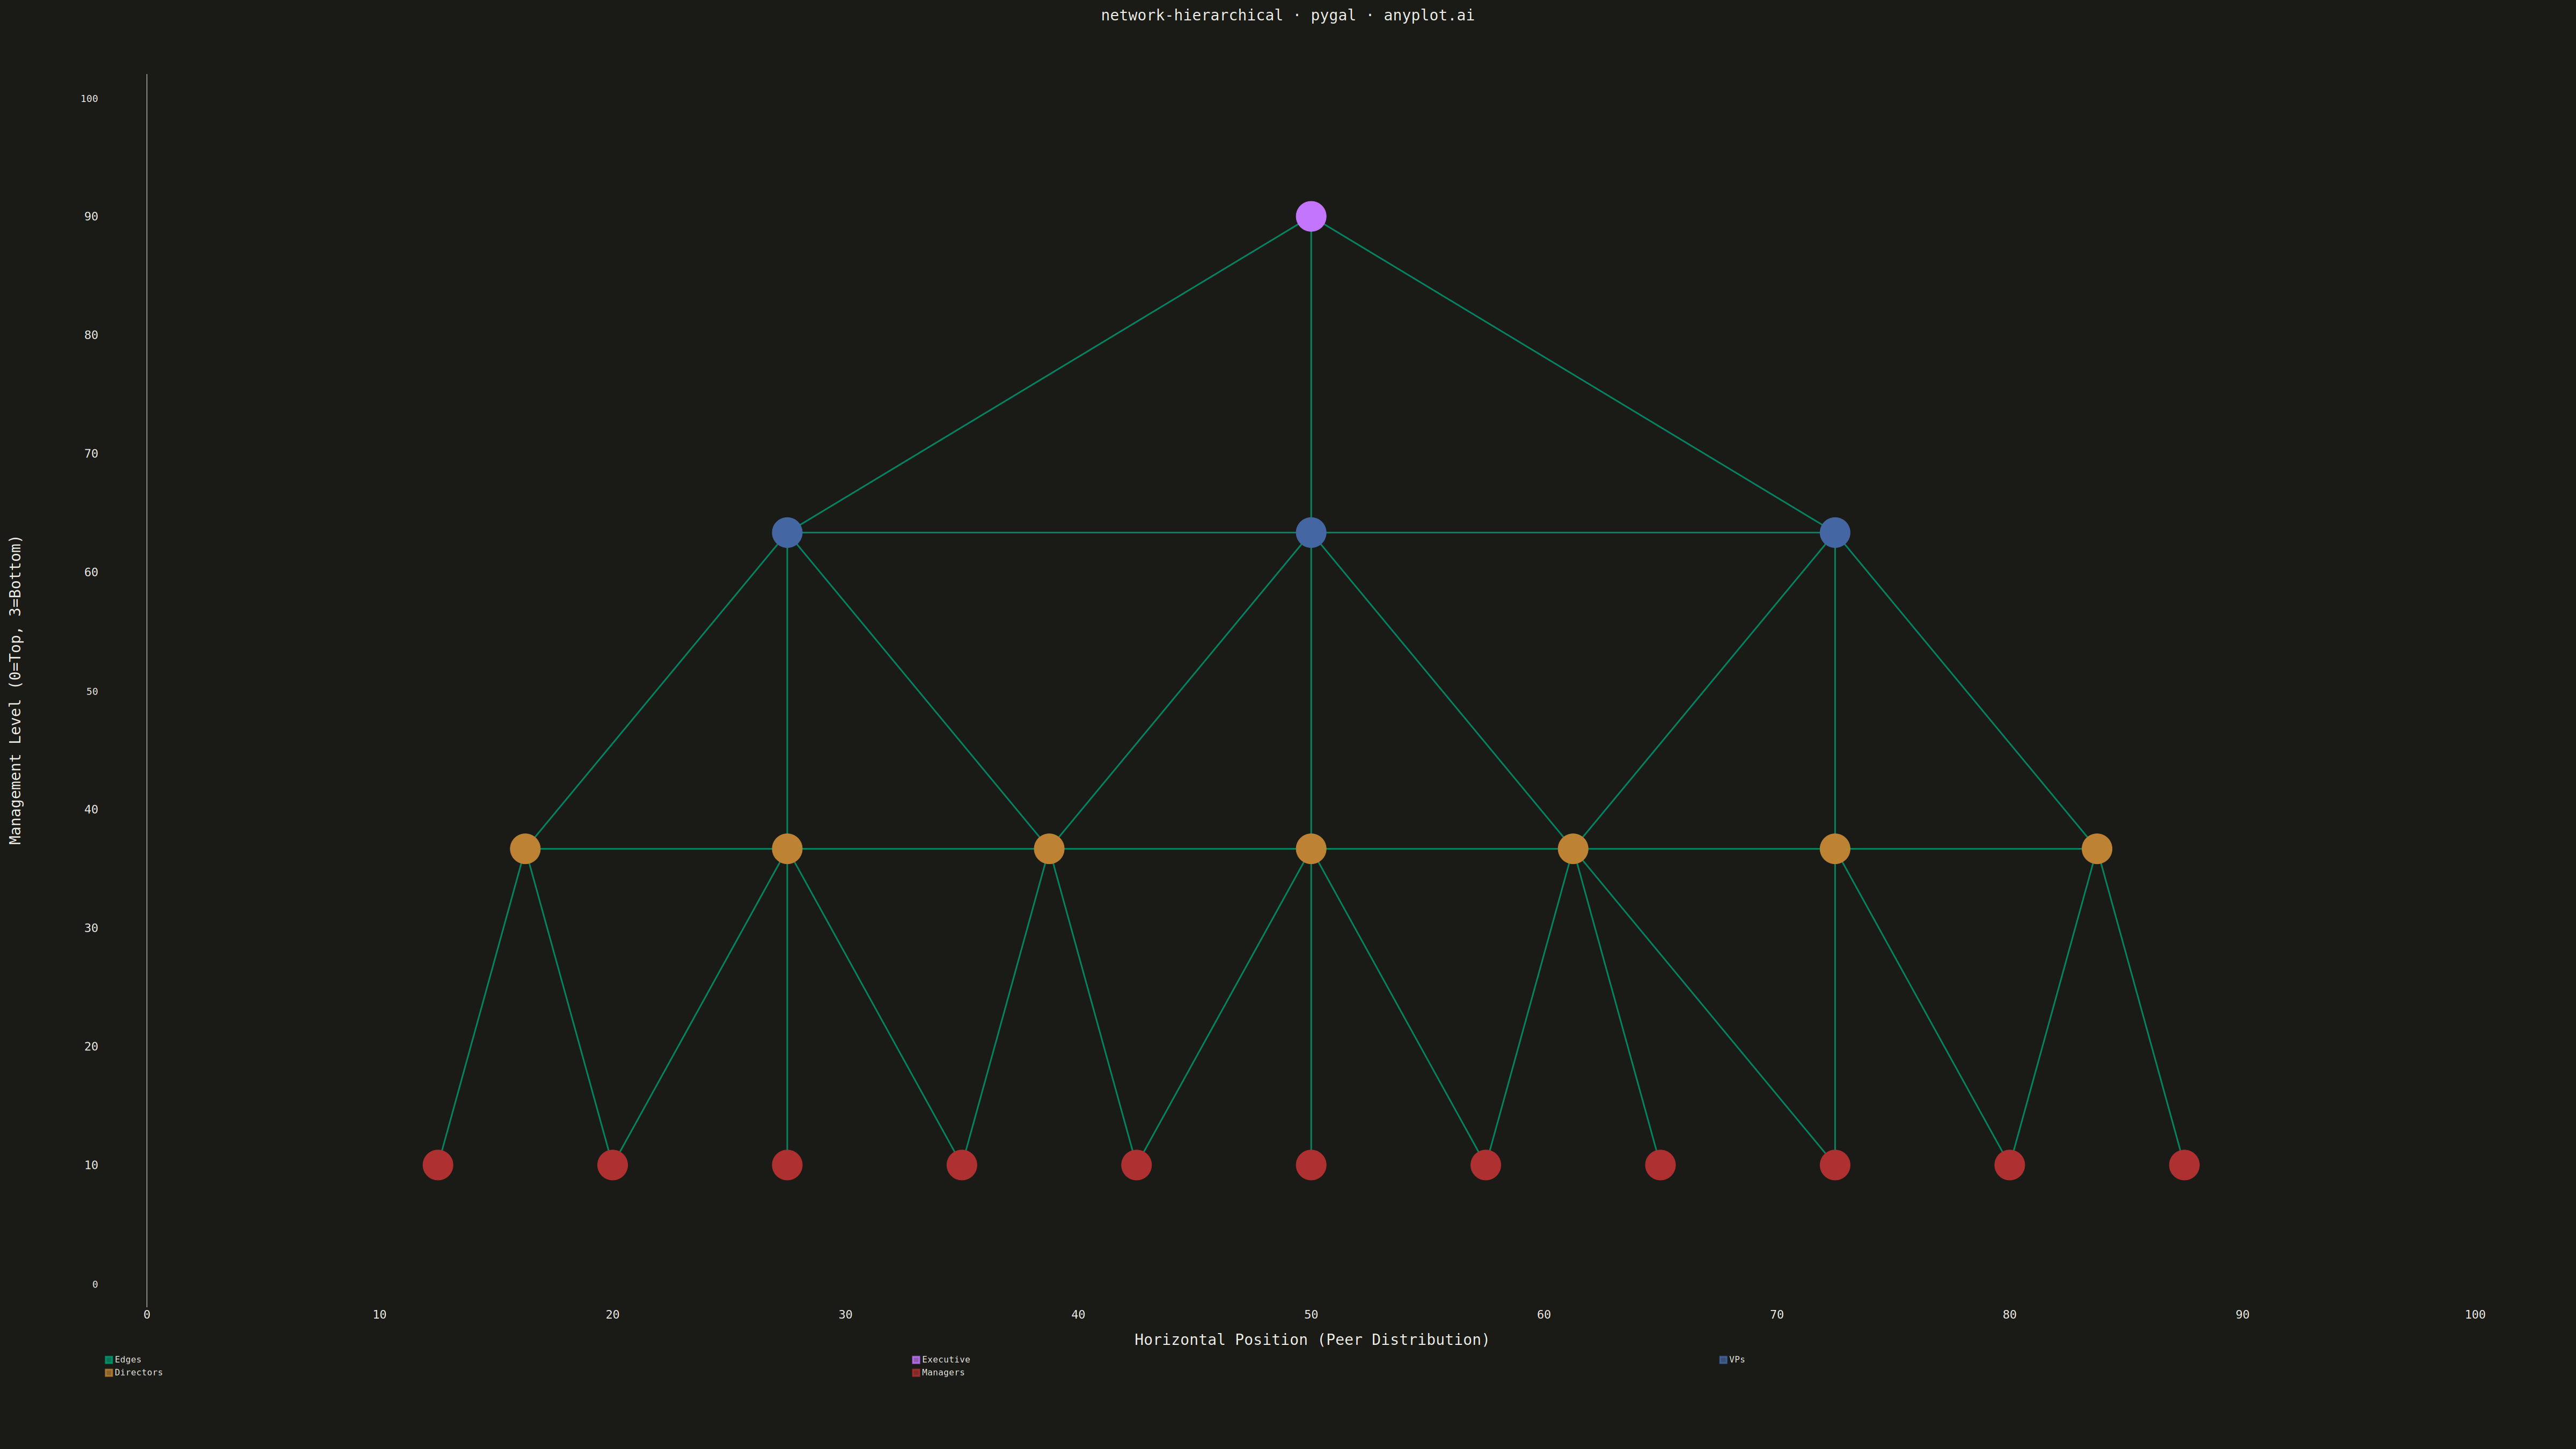
A hierarchical network graph organizes nodes in distinct levels from root to leaves, with edges showing parent-child relationships between levels. Unlike force-directed layouts that optimize for aesthetic spacing, hierarchical layouts explicitly encode tree structure by positioning nodes at fixed vertical or horizontal levels. This visualization reveals organizational depth, branching patterns, and the overall tree structure at a glance.
""" anyplot.ai
network-hierarchical: Hierarchical Network Graph with Tree Layout
Library: pygal 3.1.0 | Python 3.13.13
Quality: 81/100 | Updated: 2026-05-17
"""

import os
import shutil
import subprocess

import pygal
from pygal.style import Style


THEME = os.getenv("ANYPLOT_THEME", "light")
PAGE_BG = "#FAF8F1" if THEME == "light" else "#1A1A17"
INK = "#1A1A17" if THEME == "light" else "#F0EFE8"
INK_MUTED = "#6B6A63" if THEME == "light" else "#A8A79F"

IMPRINT = ("#009E73", "#C475FD", "#4467A3", "#BD8233", "#AE3030", "#2ABCCD", "#954477")

# Define organizational hierarchy (CEO -> VPs -> Directors -> Managers)
hierarchy = {
    0: ("CEO", 0, None),
    1: ("VP Eng", 1, 0),
    2: ("VP Sales", 1, 0),
    3: ("VP Ops", 1, 0),
    4: ("Dir FE", 2, 1),
    5: ("Dir BE", 2, 1),
    6: ("Dir DevOps", 2, 1),
    7: ("Dir Americas", 2, 2),
    8: ("Dir EMEA", 2, 2),
    9: ("Dir Logistics", 2, 3),
    10: ("Dir HR", 2, 3),
    11: ("Mgr React", 3, 4),
    12: ("Mgr Vue", 3, 4),
    13: ("Mgr API", 3, 5),
    14: ("Mgr DB", 3, 5),
    15: ("Mgr Cloud", 3, 6),
    16: ("Mgr NA", 3, 7),
    17: ("Mgr LATAM", 3, 7),
    18: ("Mgr UK", 3, 8),
    19: ("Mgr DE", 3, 8),
    20: ("Mgr Supply", 3, 9),
    21: ("Mgr Talent", 3, 10),
}

# Group nodes by level
levels = {}
for node_id, (_label, level, _parent) in hierarchy.items():
    if level not in levels:
        levels[level] = []
    levels[level].append(node_id)

# Calculate node positions using tree layout
node_positions = {}
max_level = max(levels.keys())
y_min, y_max = 10, 90
y_spacing = (y_max - y_min) / max_level

for level, nodes in levels.items():
    num_nodes = len(nodes)
    x_spacing = 90 / (num_nodes + 1)
    for i, node_id in enumerate(nodes):
        x = 5 + (i + 1) * x_spacing
        y = y_max - (level * y_spacing)
        node_positions[node_id] = (x, y)

# Level colors using Okabe-Ito palette
level_colors = [IMPRINT[0], IMPRINT[1], IMPRINT[2], IMPRINT[3]]
level_names = ["Executive", "VPs", "Directors", "Managers"]

# Create custom style with theme-adaptive colors
custom_style = Style(
    background=PAGE_BG,
    plot_background=PAGE_BG,
    foreground=INK,
    foreground_strong=INK,
    foreground_subtle=INK_MUTED,
    guide_stroke_color=INK_MUTED,
    guide_stroke_dasharray="none",
    colors=IMPRINT,
    title_font_size=28,
    label_font_size=22,
    major_label_font_size=18,
    legend_font_size=16,
    value_font_size=14,
    tooltip_font_size=14,
    stroke_width=3,
)

# Create XY chart with legend
chart = pygal.XY(
    width=4800,
    height=2700,
    style=custom_style,
    title="network-hierarchical · pygal · anyplot.ai",
    x_title="Horizontal Position (Peer Distribution)",
    y_title="Management Level (0=Top, 3=Bottom)",
    show_legend=True,
    legend_at_bottom=True,
    show_x_guides=False,
    show_y_guides=False,
    stroke=True,
    dots_size=28,
    show_dots=True,
    range=(0, 100),
    xrange=(0, 100),
    explicit_size=True,
    truncate_legend=-1,
    margin_bottom=120,
    margin_top=100,
    margin_left=100,
    margin_right=100,
)

# Add reporting lines
all_edges = []
for node_id, (_label, _level, parent_id) in hierarchy.items():
    if parent_id is not None:
        parent_pos = node_positions[parent_id]
        child_pos = node_positions[node_id]
        all_edges.append((parent_pos, child_pos))

edge_data = []
for start, end in all_edges:
    if edge_data:
        edge_data.append(None)
    edge_data.append(start)
    edge_data.append(end)

chart.add("Edges", edge_data, show_dots=False, stroke=True, color=INK_MUTED)

# Add nodes by level with labels visible
for level_idx in range(max_level + 1):
    level_nodes = levels[level_idx]
    level_data = []
    for node_id in level_nodes:
        pos = node_positions[node_id]
        node_label = hierarchy[node_id][0]
        # Create data point with label visible as annotation
        level_data.append({"value": pos, "label": node_label})
    chart.add(level_names[level_idx], level_data, stroke=False, color=level_colors[level_idx])

# Save to PNG and HTML
chart.render_to_file(f"plot-{THEME}.svg")
# For PNG, we write SVG first then use a simple conversion approach
with open(f"plot-{THEME}.html", "wb") as f:
    f.write(chart.render())

# Create static PNG using basic SVG rendering
try:
    subprocess.run(["rsvg-convert", "-f", "png", "-o", f"plot-{THEME}.png", f"plot-{THEME}.svg"], check=True)
except (FileNotFoundError, subprocess.CalledProcessError):
    # Fallback: use cairosvg if available
    try:
        import cairosvg

        cairosvg.svg2png(url=f"plot-{THEME}.svg", write_to=f"plot-{THEME}.png")
    except ImportError:
        # If no PNG converter available, just keep the SVG
        shutil.copy(f"plot-{THEME}.svg", f"plot-{THEME}.png")
Runnable source as JSON, for any HTTP client: https://api.anyplot.ai/specs/network-hierarchical/pygal/code. Any spec id and library id listed in llms-full.txt fit the same URL shape; every URL below is complete and callable.
{
  "spec_id": "network-hierarchical",
  "language": "python",
  "library": "pygal",
  "page": "https://anyplot.ai/network-hierarchical/python/pygal",
  "hub": "https://anyplot.ai/network-hierarchical",
  "code_json": "https://api.anyplot.ai/specs/network-hierarchical/pygal/code",
  "spec_json": "https://api.anyplot.ai/specs/network-hierarchical",
  "render_light_png": "https://storage.googleapis.com/anyplot-images/plots/network-hierarchical/python/pygal/plot-light.png",
  "render_dark_png": "https://storage.googleapis.com/anyplot-images/plots/network-hierarchical/python/pygal/plot-dark.png",
  "interactive_light_html": "https://storage.googleapis.com/anyplot-images/plots/network-hierarchical/python/pygal/plot-light.html",
  "interactive_dark_html": "https://storage.googleapis.com/anyplot-images/plots/network-hierarchical/python/pygal/plot-dark.html",
  "quality_score": 81.0,
  "license": "MIT",
  "guide": "https://anyplot.ai/llms.txt"
}
Part of Hierarchical Network Graph with Tree Layout on anyplot.ai.